SlideShare a Scribd company logo
1 of 50
Article Reviews: each class will typically offer at least one
article that you are expected to read and which will be discussed
during class. You may choose up to 5 articles during the
semester and prepare a concise 2 page maximum essay (plus a
cover sheet, cites page with full cites of the article and any
other resources used, and any attached or embedded exhibits) to
summarize key points in the article and how they apply
specifically to the strategy and simulation decision-making for
your team in J411. Graded essays submitted via the OnCourse
Assignments tab and discussed by the author in class by the
deadline earn up to 20 points each (15 points max if late or if
not discussed).
Monthly Profit Report Trad'lPERFORMANCE DRINKS -
MONTHLY PROFIT REPORTBasicHydrationIntensityPost
WorkoutTotalREVENUE Sales$ 125,000$ 120,000$
74,250$ 93,000$ 412,250COSTS Direct Materials$
40,000$ 50,000$ 31,000$ 33,000$ 154,000 Direct Labor$
25,000$ 20,000$ 10,000$ 18,000$ 73,000 Fringe Benefits
on Direct Labor$ 11,250.00$ 9,000.00$ 4,500.00$
8,100.00$ 32,850.00 Manufacturing Overhead$ 43,750.00$
35,000.00$ 17,500.00$ 31,500.00$ 127,750.00 TOTAL
COST$ 120,000.00$ 114,000.00$ 63,000.00$ 90,600.00$
387,600.00GROSS MARGIN$ 5,000.00$ 6,000.00$
11,250.00$ 2,400.00$ 24,650.00GROSS MARGIN
RATIO4.00%5.00%15.15%2.58%5.98%Annual
Volume:100,00080,00045,00060,000285,000Unit Price:$ 1.25$
1.50$ 1.65$ 1.55$ 1.45Unit Cost:$ 1.200$ 1.425$
1.400$ 1.510$ 1.360
Mfg OHDPERFORMANCE DRINKS - MONTHLY MFG OHD
COST REPORTMonthly ChargeIndirect Labor$
55,000.00Fringe Benefits on Indirect Labor$
24,750.00Utilities$ 5,000.00Processing Equipment -
Depreciation$ 10,000.00Preventative Maintenance$
10,000.00Information Technology$ 23,000.00Total$
127,750.00
ACCT640 – Managerial Accounting
Fall 2013
Case #2 – Performance Drinks: Applying Activity Based
Costing
Background:
Performance Drinks, LLC is owned by Dave N. Port.
Performance Drinks produces a variety of sports centered
drinks. They began operations in 1993 shortly after Mr. Port
graduated with his M.B.A. from Davenport University. The
company saw early success as sports and fitness nutritional
products gained new popularity in the 1990’s. Financially the
company is sound and has been wise in controlling their growth
over the years. However, within the last 18 months Mr. Port
has noticed a drop in overall company profitability. This is
especially troubling considering that the company has continued
to experience top-line growth. Mr. Port and his management
team have been considering developing a new product line.
However, those plans have been put on hold until they can
figure out why their profits are shrinking.
Performance Drinks makes four different kinds of sports
drinks. Those drinks are as follows:
· Basic
· Hydration
· Intensity
· Post-Workout
Each of these drinks contains a slightly different nutritional
profile and is targeted for different users and uses. The Basic
drink has the least nutritional benefit and is targeted for general
consumption. The Hydration product targets endurance athletes
and specializes in hydration replacement. The Intensity product
was designed with energy enhancement in mind. It serves the
needs of extreme athletes who need long durations of sustained
energy. Lastly, the Post-Workout product is a nutritional
replacement product that is generally used following exertion.
You are the Controller for Performance Drinks. You feel
as though you have a good handle on the financial reporting and
the overall company performance. However, admittedly, your
accounting information system has been designed to serve the
needs of external users from an aggregate perspective. To that
end you utilize absorption costing exclusively within the
organization. You recall studying the concept of Activity Based
Management (ABM) and Activity Based Costing (ABC) while
taking a managerial accounting course. You wonder if applying
those ideas to your business would help to uncover the mystery
of the disappearing profits.
You recall from your Management Accounting class that
product costs are comprised of:
· Direct Materials
· Direct Labor
· Manufacturing Overhead
You don’t suspect that anything strange is going with your
direct costs. You do wonder, however, if a more thorough
understanding of your indirect costs may be in order. Over a
series of weeks you talk with a variety of employees,
representing a multitude of functional areas, from within the
company. During those conversations you take careful note on
what activities might be consuming resources and how those
activities might be measured. You sharpen your pencil and
begin to unpack what you’ve learned. You start with reviewing
last month’s Product-Level Profit Report. That report is
following:
Since your primary area of focus is on the indirect costs
you compile the following report which further details your
overhead charges:
Overhead Activities:
Using traditional costing methods, which support your
absorption costing system, you base overhead allocation on
direct labor cost. Furthermore, “fringe benefits” are a function
of direct labor cost.
As a result of your many meetings to discuss company overhead
you determine that the majority of your indirect costs are
related to four primary activities. Those activities are
equipment set-ups, production runs, production management and
machine-hour capacity. “Production Management” refers to a
number of items that are correlated to the number of products
the company produces. Ultimately you determine that your key
activities have the following usage patterns, as they pertain to
the monthly overhead costs:
Upon reviewing budget data from the last budget cycle you
discover that the monthly number of set-ups was estimated to be
85. The number of production runs was estimated to be 250.
That monthly machine-hour capacity is presently at 20,000
machine-hours. Lastly, Performance Drinks produces a total of
four products.
After talking with the Plant Manger you create the
following usage data relative to products and activities:
Requirements:
1. Based on all of the date provided, compute the cost driver
rates for each of the four activities.
2. Compute the per unit product costs for each of the four
products. Compute this cost using ABC allocation for overhead.
Show the computation for each per unit product cost in detail.
3. Prepare a “Monthly Profit Report”, like the one provided on
page 4 of this packet. Create this report using the results of
your ABC overhead allocation.
4. Prepare a written “Management Report” that explains to the
management team what Activity Based Costing is, how it was
used to generate the Monthly Profit Report (from requirement
#3). Explain why the profit for each product is different when
comparing the Traditional report with the ABC report. Explain
what the company might consider doing, based on all of this
information, to stop the erosion of company profits. Defend
your recommendations with data.
Additional Consideration:
Mr. Port wonders what would happen to costs if plant
capacity was shifted from 20,000 machine-hours a month to
40,000 machine-hours per month.
Requirements:
5. Compute the new cost per unit for each of the products
considering the increase in capacity. Show the computation for
each per unit product cost in detail.
6. What is the cost of the unused capacity if it is assumed that
the company has 40,000 machine-hours of capacity but it using
20,000 machine-hours? Amend your “Management Report” to
include a discussion on how to best use the additional capacity.
Clarification on format and data:
Clear communication and professionalism are important.
Defending your answer with data is important.
· An electronic copy of this Case (this document) is available
within Blackboard. Additionally, an Excel file, containing the
basic data for the case will be available within Blackboard.
· You will create one professional report. In that report you
should clearly label all of your answers. Make your answers
easy to read and find. Imagine you were giving this report to
your boss. Further imagine you have to lead your boss and the
executive team through your findings.
As it pertains to requirement #4, include the “Management
Report” inside your overall report. You will then have one
Word document as your final product. You will also have one
Excel file.
· Grading is based on both accuracy (see rubric) and your
ability to communicate your answers professionally and clearly.
· Use the following naming structure for your files: last
name_first initial_case2.docx. Of course your Excel file will
have an .xls suffix.
· Double space your report.
· Put good thought into how you organize your Excel document.
Part of your grade will be based upon the usability and layout of
your Excel file. Imagine that have to give the electronic copy of
your Excel file to your boss, or a peer, to work with. Imagine
that you could not coach them at all on how to use your file. Is
your file organized and labeled so clearly that anyone could use
it, easily, without instructions from you? You want to strive for
that kind of clarity in your work.
· Your report should have a title page. Use APA 6th edition for
guidance on title pages.
· Late submissions will result in the following: 10% reduction
in score for each 24 hour period of being late (up to 3 days).
After 3 days late zero credit will be earned.
· As always please come to me with learning questions. This
project is a learning experience.
Rubric:
This project is worth 20% (200 points) of your overall course
grade. I will convert your scores to a 200 point scale.
1
MANAGER'S TOOL KIT
Do you know where the
money's being made in your industry I
Tl
BY ORIT GADIESH AND
JAMES L. GILBERT
ANY MANAGERS CHART
Strategy w i t h o u t a full
u n d e r s t a n d i n g of t h e
sources and distribution of profits in
their industry. Sometimes, they fo-
cus their sights on revenues instead
of profits, assuming that revenue
growth will eventually translate
into profit growth. In other cases,
they simply lack the data or the ana-
lytical tools required to isolate and
Orit Gadiesb is the chairman of
Bain &) Company in Boston, Massa-
chusetts, fames L. Gilbert is a direc-
tor of the firm.
measure variations in profitahility.
Whatever the cause, an incomplete
understanding of profits can create
blind spots in a company's strategic
vision, leading it to overlook attrac-
tive profit-building opportunities or
to become trapped in areas of weak
or fading profitability.
In this article, we will describe a
useful framework for analyzing how
profits are distributed among the
various activities that form an in-
dustry's value chain. Such an analy-
sis can provide a company's man-
agers with a rich understanding of
their industry's profit s t r u c t u r e -
what we call its profit pool - enabling
them to identify which activities are
generating disproportionately large
or small shares of profits. Even more
important, a profit-pool map opens
a window onto the underlying struc-
ture of the industry, helping man-
agers see the economic and competi-
tive forces that are determining the
distribution of profits. As such, a
profit-pool map provides a solid ba-
sis for strategic thinking. (See our ar-
ticle "Profit Pools: A Fresh Look at
Strategy" in this issue of HBR.)
Mapping a profit pool is, in one
sense, a straightforward exercise:
you define the value chain activi-
ties and then you determine their
size and profitability. But while the
goal is simple, achieving it can be
complicated. Why? Because in most
industries, financial data are not re-
ported in niee, neat bundles corre-
sponding to each value-chain activ-
ity. Detailed data may be available
on individual companies, but those
companies will often participate in
many different activities. Similarly,
there may be good information on
product sales or customer purchases
or channel volumes, but the prod-
ucts, customers, and channels will
rarely line up cleanly with the bound-
aries of a particular activity. Trans-
lating the available data into accu-
rate estimates of an activity's size
and profitability requires consider-
able creativity.
Altbough no two companies will
perform the analysis in precisely the
same way, it is possible to describe
a broadly applicable process for get-
ting the answers - a process that lays
out the tasks that need to be accom-
plished, the questions that need to
be asked, the types of data that need
to be collected, and the types of
analyses that need to be done.
A Foui-Step Process
Mapping a profit pool involves four
steps: defining the pool's boundaries,
estimating the pool's overall size, es-
timating the size of each value-chain
activity in the pool, and checking
and reconciling the calculations.
(See the chart "Mapping a Profit
Pool.") We will describe each step
and then provide an example of how
the entire process is applied. Finally,
HARVARD BUSINESS REVIEW M;iy-Junc 1998 149
MANAGER'S TOOL KIT HOW TO MAP YOUR INDUSTRY S
PROFIT POOL
Stepl
Define the pool
TASK
Determine which
value-chain activities
influence your ability
to generate profits
now and in the future
GUIDELINES
Take a broad view
of the value chain;
look beyond traditional
industry definitions
Examine your
industry from three
perspectives: your
own company's,
other players', and
the customer's
Talk to industry players
and analysts to uncover
new or emerging
business models
Don't disaggregate
activities more than
is necessary
OUTPUT
List of all value-chain
activities in your profit
; pool (in sequential
order)
MAPPING A
Step 2
Determine the size
of the pool
Develop a baseline
estimate of the
cumulative profits
generated by all
profit-pool activities
Seek a rough but
accurate estimate
Take the easiest
analytical routes
available; go where
the data are
Try to take at least
two different views of
pool size - for example,
company-level and
product-level
Focus on the largest
components - for
example, large compa-
nies, high-volume
products; extrapolate
smaller components
from a sample
Estimate of total
pool profits, usually
expressed as a range
PROFIT POOL
Step 3
Determine the
distribution of profits
Develop estimates of
the profits generated
by each activity
Shift between
aggregation and
disaggregation in
your analysis
Look at your own
company's economics
first, then look at large
pure players, then at
large mixed players,
then at a sample of
smaller players
If relevant company
data are unavailable,
use proxies such
as product-level or
channel-level sales
Think creatively
Point estimates of
profits for each
value-chain activity
Step 4
Reconcile the
estimates
Compare the outputs
of steps 2 and 3 and,
if necessary, reconcile
the numbers
If the numbers
don't add up, check
all assumptions and
calculations
Collect additional
data if necessary
Resolve all
inconsistencies;
don't ignore
them
Final estimates of
activity and total
pool profits
we will look at ways of organizing
the data in chart form as a first step
toward plotting a profit-pool strategy.
Define the pool. Before you can
start analyzing your industry's profit
pool, you need to define its bound-
aries by identifying the value-chain
activities that are relevant to your
own business. Where, for purposes
of developing strategy, should the
value chain be said to begin and to
end? At the conclusion of this step,
you should have a clearly defined list
of the individual value-chain activi-
ties that make up your profit pool.
The key is to define the value
chain broadly enough to capture all
tbe activities that have a meaningful
influence on your ability to earn
profits-not just today but in the fu-
ture as well. You should begin by
150 HARVARD BUSINESS REVIEW May-June 1998
HOW TO MAP YOUR INDUSTRY'S PROFIT POOL
MANAGER'S TOOL KIT
taking a close look at your own busi-
ness, breaking it down into its dis-
crete value-chain activities. But you
shouldn't stop there. Because there
are many ways to compete in any in-
d u s t r y - a n d new ways are being
thought up all the t i m e - y o u should
also look at the activities of your
competitors and potential competi-
tors. Have other companies in your
industry adopted business models
that involve different sets of activi-
ties? Might you have opportunities
to perform new activities in your in-
dustry or in other industries? Are
there activities being performed in
other industries that could displace
or substitute for the activities you
are performing?
A company that operates call cen-
ters to handle telephone orders for
catalog retailers, for example, may
in the future be able to fulfill cus-
tomer service functions for electric
utilities or transportation carriers.
And, just as important, it may one
day face a competitive threat from
companies in other industries, such
as telephone companies, cable tele-
vision operators, or even Internet
service providers. The call-center
operator should, therefore, define its
profit pool to include not only those
value chain activities traditionally
associated with direct-mail retailing
but also activities in other industries
that could infiuence its future cre-
ation of profits.
Finally, you should take a step
hack to look at your industry through
t h e eyes of t h e c u s t o m e r . How
would the customer define the life
cycle of the product or service you
produce? Often, a customer will de-
fine your industry to include activi-
ties that you would consider periph-
eral. If a paint manufacturer, for
example, asks homeowners about
the experience of buying and using
paint, it may find that the disposal
of leftover paint is an important ac-
tivity from their perspective. Dis-
posal requirements may infiuence
the kinds of paint they buy and thus
may have a direct impact on the paint
industry's profit pool. The manufac-
turer would be wise to include paint
disposal as part of its value chain.
In addition to deciding which ac-
tivities to include, a company needs
to decide the proper level of aggrega-
tion for each activity. In the automo-
tive industry, for example, financial
service activities, such as lending,
leasing, and renting, make up an im-
portant part of the profit pool. Do
yon define those activities as a single
value-chain segment or do you look
at them individually? The answer
depends on the business you're in. A
chain of auto parts stores would
probably not need to di-
vide the financial service
segment into its compo-
nent activities - after all,
the company would not
be likely to participate in
any of those activities. A
used ear dealer, however,
might well want to break
down the financial ser-
vices segment into the narrower seg-
ments of lending, leasing, and rent-
ing. Because the dealer controls an
important point of customer con-
tact, it may decide to enter one or
more of these activities in the fu-
ture. It may also find itself compet-
ing with a participant in one of these
activities-say, a new ear dealer that
needs to sell nsed cars coming off
their leases.
Defining the bounds of a profit
pool requires, in short, not just ana-
lytieal skills but also good, basic
business judgment. The pool you
draw m u s t be tailored to fit the
strategic questions you face.
Determine the size of the pool.
Once you have defined the profit
pool, you need to determine its over-
all size. What is the total amount of
profits being earned in all the value
chain activities? At this point, all
you need is a rough estimate of total
industry profits. The idea is to estab-
lish a baseline against which you can
check the reliability of the more de-
tailed, activity-by-activity calcula-
tions you will make later.
If you're lucky, you may be able to
estimate the size of the pool by read-
ing a few industry reports from stock
analysts or other researchers. Or you
may be able to find a reliable esti-
mate of overall industry revenues
and then apply an assumed industry-
average margin to it. Usually, though,
developing this estimate will not he
so straightforward. The way you de-
fine your profit pool is unlikely to
coincide precisely with any tradi-
tional industry definition. More-
over, the financial data yon require
may not be readily available in the
form you need.
A good idea in these situations is
to try to build up estimates of the
total pool based on the profitability
of individual companies, products,
channels, or regions. You should al-
How you define your profit
pool is unlikely to coincide
precisely with any traditional
industry definition.
ways try to focus first on the biggest
pieces-the largest companies or the
highest-volume products, for exam-
ple. If there are large public compa-
nies that account for a significant
proportion of industry profits, use
their financial statements as a start-
ing point. To gauge the profits of the
smaller players, you adjust the lead-
ers' margins-to reflect the smaller
players' competitive advantages or
disadvantages - and then apply the
adjusted margin to the remaining in-
dustry revenues. You then add the
leaders' actual profits to your esti-
mate of the total profits of the smaller
companies to gain an overall esti-
mate of industry profits. (See the in-
sert "What Is 'Profit' Anyway?")
While a high degree of precision
isn't necessary at this point, you do
need to have confidence in the gen-
eral accuracy of the estimate. There-
fore, it is always advisable to develop
estimates based on at least two dif-
ferent views of an industry. Try to
develop estimates based, for exam-
ple, on players and produets. You can
then compare the estimates to en-
sure they're in the sam.e ballpark.
The more data you have and the
more a n a l y t i c a l approaches you
take, the more accurate your esti-
mate will be.
D e t e r m i n e t h e d i s t r i b u t i o n of
profits. Determining the way profits
are distributed among different value-
chain activities is the core challenge
of profit-pool mapping. There are
HARVARD BUSINESS REVIEW M;iy-|unc 1998 151
MANAGER'S TOOL KfT HOW TO MAP YOUR INDUSTRY S
PROFIT POOL
WHAT IS "PROFIT" ANYWAY?
Today there are almost as many
ways to define profit as there are
to make it. For practical purposes,
though, managers tend to think
about profit in one of three ways:
as accounting profit, as return on
investment, or as cash-flow con-
tribution. Because each of the
measures can be used as the basis
for management decisions, they
all can he important in profit-pool
mapping.
Aeeounting profit represents a
eompany's earnings as formally
reported. It is the measurement
method underlying net-income
and earnings-per-share calcula-
tions in shareholder reports and
other official filings. Its precise
method of calculation can vary,
depending on t h e a c c o u n t i n g
standards specific to a given in-
dustry or country.
Return on investment repre-
sents a company's earnings after
taking into account the cost of
capital invested in the business.
Because ROI represents the true
profit associated with investment
in an industry, it is an essential
measure for evaluating potential
new investments. It can be mea-
sured using a number of different
methodologies, which all have
advantages and disadvantages.
One of the most useful ROI mea-
sures is economic value-added
(EVAj, which equals after-tax op-
erating profits minus the cost of
all invested capital. Because EVA
expresses returns as an absolute
profit value rather than as a per-
centage, it lends itself well to
profit-pool mapping.
two general analytical approaches to
this task: aggregation and disaggre-
gation. If you are in an industry in
which all the companies focus on
a single value-chain a c t i v i t y - i n
which all are, in other words, "pure
players" - you will calculate activity
profitability by aggregating the prof-
its of all the pure players. If, by con-
Cash-flow contribution is, in
general, a company's earnings be-
fore taking fixed-asset and capital
costs into account. It is frequent-
ly expressed as earnings before
income taxes, depreciation, and
amortization (EBITDA). In some
cases, fixed operating costs, such
as overhead, are also suhtracted.
An incremental measure, it repre-
se n t s the a m o u n t of cash left
from a sale after subtracting the
variable costs associated w i t h
that sale. Cash-flow contribution
is frequently used as the basis for
management decision making in
m a t u r e , h i g h - f i x e d - c o s t , and
cyclical industries, particularly
during down cycles. It is also a
useful profit measure for compa-
nies that are investing to gain
market share and for those that
are engaged in leveraged huyouts.
Developing detailed profit-pool
maps using all three measures
would be a forbiddingly complex
undertaking. In m.ost cases, fortu-
nately, it is sufficient to use just
one basis of measurement for in-
depth mapping. Other relevant
measures ean then be roughly es-
timated as needed. Most compa-
nies will use accounting profit as
t h e i r b a s i c m e a s u r e b e c a u s e
that's the form in which profit
data are generally reported. How-
ever, when a company's profit
pool extends across industries or
countries, managers need to he
aware of and take into account
possible differences in account-
ing standards. The goal should al-
ways be to measure profit consis-
tently across the entire pool.
trast, all the companies in your in-
d u s t r y are v e r t i c a l l y i n t e g r a t e d
"mixed players," each performing
many different activities, you will
need to disaggregate each company's
financial data to arrive at estimates
for a specific activity.
In reality, of course, most indus-
tries include a combination of pure
players and mixed players. Your
analysis, therefore, will likely in-
clude both aggregation and disaggre-
gation. At some stages, you'll be
tearing data apart. At others, you'll
be building it up.
You start, once again, by looking
at the economics of your own com-
pany, examining revenues, costs,
and profits by activity. If you're a
pure player, this won't take much
w o r k - a l l your revenues and costs
will be allocated to the same activ-
ity. If you're involved in many activi-
ties and your financial-reporting sys-
tem does not clearly distinguish
among them, you will need to disen-
tangle your revenues and costs. In
companies whose fixed costs are
shared hy a number of different ac-
tivities, as is the case in many finan-
cial-services institutions, allocating
costs will likely require not only
careful analysis but also some in-
depth thinking about the structure
of the business.
Now you look outside your com-
pany to examine the economics of
other players in the industry. Al-
though the sources of company data
will vary by industry, there are some
common places to look. You will
draw on annual reports, 10-K filings,
and stock-analyst reports (for public
companies), as well as company pro-
files by research organizations such
as Dun &. Bradstreet, reports by in-
dustry associations, and trade maga-
zines. Eor regulated industries, the
government can be a good source.
And in some industries, there are
companies that specialize in collect-
ing and reporting detailed financial
information. If data are unavailable
on a company, you may need to esti-
mate its profitability based on the
performance of a similar company
for which data are available.
You should always look first at
any pure players. Once you know
their revenues, costs, and profits,
you'll have an economic yardstick
for measuring the activity in which
they specialize. You can then look at
the mixed players. In some cases,
they will report their financial infor-
mation by activity, making your
work easier. In other cases, however,
the information they report will he
aggregated-you'll need to break it
152 HARVARD BUSINESS REVIEW May-(unc 1998
MANAGER'S TOOL KIT HOW TO MAP YOUR INDUSTRY'S
PROFIT POOL
down by activity. To accomplish
that, you can often use what you
learned about the margins and cost
structure of the pure players to make
accurate a s s u m p t i o n s about the
mixed players' economics for a given
activity, taking into account their
particular competitive advantages
and disadvantages. For activities in
which your company participates,
you may also be able to use your own
economics as a yardstick.
You won't need to collect data on
all the companies participating in all
the value chain activities. In most
industries, the 80/20 rule will apply:
20% of the companies will account
for 80% of the revenues. By collect-
ing data on the largest companies,
you will likely have covered most of
the industry. You can then extrapo-
late the economic data for the smaller
companies by collecting data on a
sample of them. Once you have the
data on your own company, the large
pure players, the large mixed play-
ers, and a sample of the smaller eom-
panies, you add up the figures, activ-
ity by activity, to arrive at overall
estimates.
Sometimes, it will actually be eas-
ier to gather financial data on prod-
ucts, customers, or channels than on
companies. This is often the case in
industries characterized by a high
degree of vertical integration. In
such eases, you should go where the
data are. If you can get detailed data
on the economies of different prod-
uct types, for example, you can allo-
cate costs, revenues, and profits to
different activities at the product
level. Then you add up the numbers,
activity by activity, to arrive at total
estimates. As witb company data,
the process is a matter of aggregating
and disaggregating.
At the end of this step, the shape
of your profit pool should be clear.
You will know the profits - as well as
the revenues, costs, and margins-of
each value-chain activity. And you
will know how your own economi cs
stack up to the averages, activity by
activity.
R e c o n c i l e t h e e s t i m a t e s . T h e
fourth and final step in the analysis
serves as a reality check. You add up
the profit estimates for each activity,
and you compare the total with the
overall estimate of industry profits
you developed earlier. If there are
discrepancies, you need to go back
and check your assumptions and cal-
culations and, if necessary, collect
additional data. Don't be surprised if
you have to spend considerable time
reconciling the numbers. Because
you will often have made your esti-
mates in an indirect way, based on
fragmented or incomplete data, dis-
crepancies will be common.
Applying the Process:
The RegionBank Case
To show how a company would ac-
tually use this process, let's put our-
selves in the shoes of the managers
of RegionBank, a hypothetical retail
bank based in tbe midwestern United
States. RegionBank is in a tight spot.
Fundamental changes in the finan-
cial services industry have under-
mined the traditional advantages of
its vertically integrated, regionally
focused business model. Powerful
national product specialists -MBNA
in credit cards, Fidelity in mutual
funds. Countrywide Mortgage in
mortgage lending-are stealing away
m a n y of i t s b e s t cus-
tomers. New distribution
channels, such as tele-
phone and on-line bank-
ing, threaten to render its
e x p e n s i v e n e t w o r k of
local branches obsolete.
Even its back-office trans-
actional functions, like credit card
processing, are under attack from
bighly efficient specialists sucb as
First Data Corporation.
As RegionBank's m a n a g e m e n t
team, we know we cannot simply
stay the course, hoping for the best.
As margins narrow, our current busi-
ness model seems unsustainable.
But to develop a new m o d e l - o n e
that will allow us to carve out and
hold on to a substantial piece of tbe
banking industry's rapidly shifting
profit p o o l - w e need to have a thor-
ough understanding of the industry
and its patterns of profit creation.
Where in the banking value chain
are attractive profits being generated?
Why is the profitability of some
banking activities rising wbile the
profitability of others is falling?
Wliich companies are capturing the
profits? What are their b u s i n e s s
models? Only after we know where
and how profits are being m a d e - and
by wliom - will we be in a position to
think about the forces shaping our
industry and to make rational deci-
sions about our strategic direction.
Define the pool. We start by set-
ting the bounds of our profit pool.
After looking at the activities we
perform, the aetivities performed by
current and potential competitors,
and the ways customers perceive our
business, we see that our industry is
broader than the regional banking
industry as traditionally defined. It
encompasses the entire U.S. con-
sumer-financial-services industry,
which can be viewed as including
three core activities: acquiring cus-
tomers through branches or other
channels (acquisition); lending and
managing money (for simplicity,
we'll eall this activity funding); and
delivering a variety of related back-
room services, such as transactions
and reporting [servicing). These ac-
tivities define RegionBank's playing
field, and by focusing on tbem we
will have the necessary breadth of
Determining the distribution
of profits among value chain
activities is the core challenge.
vision to answer the question on
wbich all our strategic decisions
turn: Wbere in consumer financial
services will companies be able to
make money?
Determine the size of the pool. To
develop a rough but accurate esti-
mate of our profit pool, we under-
t a k e two different a n a l y s e s . We
determine tbe eumulative profits
generated by all the industry's major
products, and then we determine the
cumulative profits earned by all the
companies competing in the three
industry activities. We choose prod-
ucts and players for a simple reason:
those are the ways financial data are
typically reported in the industry.
First, we examine products. We
know that the consumer-financial-
services industry, as we have defined
it, has five major product categories:
154 HARVARD BUSINESS REVIEW May-June 1998
MANAGER'S TOOL KIT HOW TO MAP YOUR INDUSTRY'S
PROFIT POOL
credit cards, mortgages, deposits,
mutual funds, and consumer loans.
Sales and profitability data for each
of these categories are reported regu-
larly by the federal government as
well as by private data-reporting
companies, making data collection a
simple exercise.
Similarly, when we turn to the
players, we know that companies in
the industry are required to report
their financial information in con-
siderable detail. By looking at the
largest players individually and ex-
trapolating from a sample of the
smaller players, we are able to quick-
ly estimate total profits. Both meth-
odologies yield a similar range of es-
timates for the size of the profit
pool-between $60 billion and $70
billion-so we are confident that we
have a reliable estimate.
Determine the distribution of
profits. Now we have an estimate of
the size of RegionBank's current in-
dustry profit pool-in total and by
product and player. What we don't
have, however, is an understanding
of how the pool is distributed among
the three value-chain activities: ac-
quisition, funding, and servicing.
This leads to our first major analyti-
cal problem. In consumer financial
services, revenue and profit infor-
mation simply isn't available for
individual value-chain activities.
Rather, as we saw before, financial
information is organized by compa-
ny and by product type. We will not,
therefore, be able to measure value
chain activities directly. Instead, we
will have to construct five different
profit pools-one for each major
product category-and divide each
pool into the three activities. We
UNTANGLING THE CREDIT-CARD VALUE CHAIN
The credit-card value chain encompasses three business
activities. As a
result of variations in the type of data available, the profits
generated in
each activity need to be calculated in very different ways.
Acquisition Funding Servicing
$80 value of a subscriber
$ 6 4 *"°^'' °^ acquiring
a subscriber
average annual
revenues per
subscriber
• $ 2 3 5 ^^^""^S^ annual
costs per subscriber
$ 6 0 ^ " i ^ " ^ ' payments
to servicer per
subscriber
1 7 average servicer
margin
acquisition profit
per subscriber
amortized average life of
^ % ^ subscriber account
annual funding
profit per subscriber
$ 1 0 ^""'^^' servicing
profit per subscriber
$ 3 2 0 ^'^"'^^' acquisition
profit per subscriber
X 2 6 0 ^°^^' number of
million subscribers
X 260
million subscribers
V 2 6 0 total number of
million subscribers
$800
million acquisition profits
+ $11.4
billion funding profits
$2.6 .. ^
billion servicing profits
total
credit-card
profits
= $14.8
billion
156 HARVARD BUSINESS REVIEW May-June 1998
P E N N S T A T E
E X E C U T I V E
P R O G R A M S
riic Smi;;il College ol" I^ll^iln:^^ Aditiiiu;,l[aLion
TM
IlLJIi
OVER 4 0 YEARS
OF EXECUTIVE
EDUCATION
General Management
Programs
Operations/Logistics/
Purchasing
Human Resources
Programs
Marketing Program
Custom Programs
TO RECEIVE PROGRAM
INFORMATION, PLEASE CALL:
Toll-free wilhin U.S.: (800) 31 l-63fi4
Oulsicic U.S.: (814) 865-3435
rilX. {ol^/ au^-jj iL
E-Mail: [email protected]
Web Silc: lillp://www,snical.psu.cdu/pscp
A digital strategy
is more than a business plan.
In successful companies,
it's the entire
business.
Unleashing the
Killer App
offers the first blueprint
for designing, deveioping—
and deploying—a digital
strategy of your own.
$24.95
At bookstones everywhere or
call 1-888-500-1016 • 1-617-496-1449
Mention Ppiopity Code Z7G0
foraword by
NicHoLas
NegRopoNte
unlaashing
ths
Killer
App
digital
strategies
for Market
doninance
LaRRy DOWNes
CHUNka m u i
H A R V A R D B U S i n J E S S
S C H O O L P R E S S
BOSTON, MA 0 2 1 B 3
w w w - k i l l Q r - a p p s . c o m
will then be able to add up the aetiv-
ity data for each product to gain an
industrywide measure of activity
profitability.
For the sake of illustration, let's
take one product-credit cards-and
walk through the way we determine
the distribution of its profit pool. We
start by gathering profit and revenue
data for all the key players in the
credit card business: ĉard issuers^
subscriber and merchant acquirers,
and customer and account servicers.
Because RegionBank is itself an is-
suer of credit cards, we can use our
internal financial data as a bench-
mark for credit eard profitability.
Since there are literally thousands
of credit card issuers, it would not he
practicable to collect financial infor-
mation on all of them. We therefore
pursue an 80/20 approach, collecting
data on all the major industry play-
ers but analyzing only a sample of
the smaller players. To ensure that
we don't overlook any important
competitors, we take the time to
talk to people representing different
aspects of the industry, including
leading banks in overseas markets
and companies in related industries
such as home equity lending. We
need to remember, as we pull to-
gether the information, that compe-
tition in our industry is shifting
rapidly, with many kinds of new
players entering the fray. As the
strategic landscape evolves, new
competitors and new services could
present threats or opportunities to
RegionBank. Failing to consider
them now could be costly.
Once we have profit data for all
the relevant players in the credit
card industry, we need to disaggre-
gate the data hy value chain seg-
ment. (See the chart "Untangling
the Credit-Card Value Chain.") We
use a different calculation method
for each segment:
• Seivicing. Because there are several
large, public companies that special-
ize in credit card servicing-pure
players-servicing is the easiest of
the three segments for which to esti-
mate profits. So it's a good place to
start. We know, from our own expe-
rience as a card issuer, that a typical
issuer pays approximately $60 per
subscriber per year to third-party
MANAGER'S TOOL KIT HOW TO MAP YOUR. INDUSTRY'S
PROFIT POOL
processors to handle transaction pro-
cessing, statement generation, and
all the other back-office tasks associ-
ated with that subscriber. By study-
ing the financial stateinents of the
pure players, we find that their aver-
age pretax margin for servicing is
17%, indicating that about $10 per
year in servicing profits are generat-
ed per subscriber ($60 x .17). Given
the roughly 260 million credit-card
subscribers in the United States, this
works out to $2.6 billion in annual
servicing profits.
• Acquisition. There are no pure
players in credit card acquisition, so
we need to be a little more creative
here. By examining recent purchases
of credit-card-subscriber portfolios,
we find that the price paid, per sub-
scriber, is approximately $80. We
also know, from our own experience
and from general industry studies,
that the average cost of gaining a
new card subscriber is in the neigh-
borhood of $64, which indicates that
the acquisition profit per card is $16.
Amortizing this figure over the aver-
age life of a subscriber account (five
years) yields $3.20 in annual acquisi-
tion profits per subscriber, or $800
million for the entire credit-card
business.
• Funding. Finally, to estimate fund-
ing profits, we detail all the revenues
and costs associated with funding a
credit c a r d - i n other words, we cre-
ate a profit and loss statement for a
card. The data required for this exer-
cise are reported in the secondary
markets where card portfolios are
bought and sold. First, we add up all
the annual revenues accruing to a
typical card from interest, annual
fees and other charges, and mer-
chant payments ($279), and then we
subtract all the costs associated with
that card [$235), many of which,
such as acquiring and servicing, we
have already detailed. We arrive at
an annual funding profit of $44 per
subscriber, or $11.4 billion in total
We now have categorized the credit
card profit pool by value chain activ-
ity: $800 million for acquisition,
$11.4 billion for funding, and $2.6
billion for servicing. We make simi-
lar calculations for each of the other
four product categories-mortgages,
deposits, m u t u a l funds, and con-
REGIONBANK'S PROFIT-POOL MAP
A profit-pool map compares a value chain activity's revenues
with
its profitability. By developing a map of the current U.S.
consumer-
financial-services industry, RegionBank is able to see the
profits
being generated by acquisition, funding, and servicing
activities.
By comparing this map with a map from an earlier point in time,
the company will be able to spot trends in profit distribution.
20% —,
acquisition funding
share of industry revenue
100%
servicing
sumer loans-and we add up the to-
tals to establish estimates for tbe
size of each activity in t h e con-
sumer-financial-services industry:
$10.0 billion in acquisition, $42.4
billion in funding, and $10.4 billion
in servicing. We now know the cur-
rent shape of our profit pool.
Reconcile the estimates. As a re-
ality check, we add up the activity
totals ($63 billion) and compare the
suin with our initial estimate of the
industry profit pool (between $60
billion and $70 billion). Tbe num-
bers jibe, so we are confident that
our estiinates arc reasonable.
Visualizing the Profit Pool
As the end product of profit-pool
mapping-and the starting point of
strategy d e v e l o p m e n t - you will
want to portray the data you've col-
lected in a series of charts. Visualiz-
ing the profit pool makes it easier to
spot areas of d i s p r o p o r t i o n a t e l y
large and disproportionately small
profits and to identify trends infiu-
encing the distrihution of profits.
The resulting insights can form the
basis for the development of a strat-
egy that will enable a company to
capitalize on or even control the di-
rection of profit-pool shifts.
There are several different ways to
chart a profit pool, each of which
provides different insights. One of
the simplest but most useful charts
is what we call a profit-pool map, in
which profit distribution is com-
pared w i t h revenue distribution.
(See the chart "RegionBank's Profit-
Pool Map.") Tbe map takes the form
of a series of building blocks-each
representing a value chain activity-
plotted on a graph. The horizontal
axis of tbe graph represents the per-
centage of industry revenues, and
the vertical axis represents operat-
ing margins. Thus the width of each
block indicates the activity's share
of total industry revenues, its height
indicates the activity's profitability,
and its area indicates the activity's
total profits.
The profit-pool map portrays the
distribution of profits and revenues
160 HARVARD BUSINESS REVIEW May-fune 1998
HOW TO MAP YOUR INDUSTRY'S PROFIT POOL
MANAGER'S TOOL KIT
along a single dimension: value
chain activity. It will often be useful,
however, to chart the profit pool
along two dimensions simultane-
ously. In RegionBank's case, for ex-
ample, we know that many new
players-product specialists, servic-
ing specialists, and various other
nontraditional competitors - have
entered the industry in recent years.
It would therefore be illuminating to
see how industry profits are distrib-
uted among different types of com-
panies as well as among different
value-chain activities. To visualize
a profit pool in two dimensions, we
can create a graph that we eall a
profit-pool mosaic. [See the chart
"RegionBank's Profit-Pool Mosaic")
In a profit-pool mosaic, the total
area of the chart equals ioo% of in-
dustry profits [in RegionBank's case,
$63 hillion). The horizontal axis in-
dicates the percentage of total indus-
try profits created in each activity-
roughly 67% in funding, 17% in ser-
vicing, and 16% in acquisition-and
the vertical axis shows the percent-
age of profits created by company
type within an activity. (Depending
on a company's partieular situation
and challenges, other dimensions,
such as products, channels, and geo-
graphic regions, can he plotted in a
mosaie.] By looking at the mosaic,
we can see not only how much
money is being made, activity by
activity, but also who's making it.
Profit-pool maps and mosaics are
only snapshots, of course. They
show us the shape of the pool as it
exists today, hut they don't show us
REGIONBANK'S PROFIT-POOL MOSAIC
A profit-pool mosaic reveals the distribution of an industry's
profits along two dimensions. RegionBank uses a mosaic to see
the profits being earned by different types of companies within
each of the three core value-chain activities in its industry.
100%
80 —
4g
Q.
60 —
40 —
20 —
other other other
credit unions
credit unions
securities firms
securities firms^ „ otherjoan specialist_s_
other specialists auto loan specialists
credit card specialists
deposit specialists
other specialists
mortgage specialists
• mutual fund specialists
deposit specialists )i-'
mutual fund specialists
mortgage specialists
mutual fund specialists
credit card specialists
servicing specialists
government-sponsored enterprises
deposit specialists
banks
banks
banks
acquisition funding
share of industry profits
100%
servicing
HAKVAKD BUSINESS REVIEW May-funcl998 161
MANAGER'S TOOL KIT HOW TO MAP YOUR INDUSTRY'S
PROFIT POOL
how the pool has been changing. To
get a more dynamic view-which is
essential for strategy development-
we need to plot similar charts for the
profit pool at earlier points in time.
To develop such comparison charts,
we go through the same steps of data
collection and analysis; we just use
data from an earlier year. By seeing
how the pool's shape has changed-
where profits have increased or di-
minished, who's been gaining or los-
ing profits - we can often infer which
competitive, economic, and other
forces have been shaping the indus-
try's profit structure.
In turn, we can project how these
forces might reshape the pool in the
future. It is often a useful exercise, in
fact, to plot a projected profit pool. If
your industry is stable, with no ma-
jor uncertainties on the horizon, you
will probably need to develop only a
single view of the future, projecting
future profit data based on current
trends. If there's a lot of uncertainty
in your industry, you should develop
a range of possible views of t h e
future. For instance, RegionBank
m i g h t c r e a t e a series of m o s a i c
charts representing different scenar-
ios for how its industry might look
in five years. Practically speaking,
you won't be able to chart all the
possible future permutations of a
profit pool. We have found, though,
that plotting three to five scenarios,
representing a range of possibilities,
is enough to provide valuable guid-
ance in strategy development.
A Foundation for Strategy
Profit-pool mapping reveals the loca-
tion and size of profit concentrations
within an industry and sheds light
on how those concentrations might
shift. We have focused on analyzing
the pool in terms of value chain ac-
tivity. Knowing the distribution of
profits along the value chain pro-
vides you with the broadest view of
profit trends in your industry. Such
a view is essential for identifying
structural shifts that could influ-
ence the profits available to you and
your competitors in the future. It is
important to note, however, that
profits concentrate not just in partic-
ular value-chain activities but also
in particular product types, cus-
tomer segments, distribution chan-
nels, and geographic regions. To
develop the fullest possible under-
standing of your profit pool, you will
want to map the pool along some, if
not all, of these dimensions as well.
As even our simplified Region-
Bank case i n d i c a t e s , profit-pool
mapping often requires a consider-
able investment of time. And, since
every business situation is unique,
tough questions about scope and
methodology will need to be an-
swered at every step of the analysis.
But mapping your profit pool will
provide you with important bene-
fits. You'll gain a new store of strate-
gic information and, even more im-
portant, a more creative approach to
strategy formulation.
The sheer act of defining, catego-
rizing, and mapping a pool can stir
the thinking of your management
team, leading it to challenge old as-
sumptions and to generate valuable
new business insights. When you de-
fine the shape of today's profit pool,
you refine and deepen your knowl-
edge of the mechanics of your indus-
t r y - w h e r e profits are created, how
they're created, and who's creating
them. And when you think through
the forces shaping the pool, you
identify and isolate the most critical
drivers of future industry profitabil-
ity. Ultimately, the discipline of
profit-pool lnapping rewards you
with a richer view of your business
and where you might lead it. ^
Reprint 98306
To order reprints, see the last page ui this issue.
"I dredged the pool and threw the nierniaids back into the Long
Island Sound."
162 HARVARD BUSINESS REVIEW May-June 1998
Harvard Business Review Notice of Use Restrictions, May 2009
Harvard Business Review and Harvard Business Publishing
Newsletter content on EBSCOhost is licensed for
the private individual use of authorized EBSCOhost users. It is
not intended for use as assigned course material
in academic institutions nor as corporate learning or training
materials in businesses. Academic licensees may
not use this content in electronic reserves, electronic course
packs, persistent linking from syllabi or by any
other means of incorporating the content into course resources.
Business licensees may not host this content on
learning management systems or use persistent linking or other
means to incorporate the content into learning
management systems. Harvard Business Publishing will be
pleased to grant permission to make this content
available through such means. For rates and permission, contact
[email protected]

More Related Content

Similar to Article Reviews each class will typically offer at least one arti.docx

BA 620 Managerial Finance Group Problem Set 2 (125 poi.docx
BA 620 Managerial Finance Group Problem Set 2 (125 poi.docxBA 620 Managerial Finance Group Problem Set 2 (125 poi.docx
BA 620 Managerial Finance Group Problem Set 2 (125 poi.docxrosemaryralphs52525
 
BA 620 Managerial Finance Group Problem Set 2 (125 poi.docx
BA 620 Managerial Finance Group Problem Set 2 (125 poi.docxBA 620 Managerial Finance Group Problem Set 2 (125 poi.docx
BA 620 Managerial Finance Group Problem Set 2 (125 poi.docxwilcockiris
 
Problem 1Preston Recliners manufactures leather recliners and uses.docx
Problem 1Preston Recliners manufactures leather recliners and uses.docxProblem 1Preston Recliners manufactures leather recliners and uses.docx
Problem 1Preston Recliners manufactures leather recliners and uses.docxChantellPantoja184
 
Acc 561 week 5 discussion question 1
Acc 561 week 5 discussion question 1Acc 561 week 5 discussion question 1
Acc 561 week 5 discussion question 1walcawhomza1973
 
FIN 585 Effective Communication - tutorialrank.com
FIN 585 Effective Communication - tutorialrank.comFIN 585 Effective Communication - tutorialrank.com
FIN 585 Effective Communication - tutorialrank.comBartholomew34
 
ACC 561 Expect Success/newtonhelp.com
ACC 561 Expect Success/newtonhelp.comACC 561 Expect Success/newtonhelp.com
ACC 561 Expect Success/newtonhelp.commyblue009
 
ACCT 321 SEC 10K REPORT PROJECT
ACCT 321 SEC 10K REPORT PROJECTACCT 321 SEC 10K REPORT PROJECT
ACCT 321 SEC 10K REPORT PROJECTMalcolmJerry
 
It 205 week 3 discussion questions
It 205 week 3 discussion questionsIt 205 week 3 discussion questions
It 205 week 3 discussion questionsscaberorer1985
 
FIN 585 Exceptional Education - snaptutorial.com
FIN 585   Exceptional Education - snaptutorial.comFIN 585   Exceptional Education - snaptutorial.com
FIN 585 Exceptional Education - snaptutorial.comDavisMurphyB2
 
ACC 561 TUTORIAL Education Planning--acc561tutorial.com
ACC 561 TUTORIAL Education Planning--acc561tutorial.comACC 561 TUTORIAL Education Planning--acc561tutorial.com
ACC 561 TUTORIAL Education Planning--acc561tutorial.comkopiko233
 
FIN 585 Education Specialist / snaptutorial.com
FIN 585  Education Specialist / snaptutorial.com FIN 585  Education Specialist / snaptutorial.com
FIN 585 Education Specialist / snaptutorial.com McdonaldRyan86
 
Bus 437 week 3 dq 1 implementation
Bus 437 week 3 dq 1 implementationBus 437 week 3 dq 1 implementation
Bus 437 week 3 dq 1 implementationhalolida1983
 
Fin 585 Believe Possibilities / snaptutorial.com
Fin 585   Believe Possibilities / snaptutorial.comFin 585   Believe Possibilities / snaptutorial.com
Fin 585 Believe Possibilities / snaptutorial.comDavis18a
 
2.2 Assignment Totaling CostsGetting StartedProdu.docx
2.2 Assignment Totaling CostsGetting StartedProdu.docx2.2 Assignment Totaling CostsGetting StartedProdu.docx
2.2 Assignment Totaling CostsGetting StartedProdu.docxRAJU852744
 
Acc 561 week 5 discussion question 2
Acc 561 week 5 discussion question 2Acc 561 week 5 discussion question 2
Acc 561 week 5 discussion question 2nuesteamcompa1981
 

Similar to Article Reviews each class will typically offer at least one arti.docx (15)

BA 620 Managerial Finance Group Problem Set 2 (125 poi.docx
BA 620 Managerial Finance Group Problem Set 2 (125 poi.docxBA 620 Managerial Finance Group Problem Set 2 (125 poi.docx
BA 620 Managerial Finance Group Problem Set 2 (125 poi.docx
 
BA 620 Managerial Finance Group Problem Set 2 (125 poi.docx
BA 620 Managerial Finance Group Problem Set 2 (125 poi.docxBA 620 Managerial Finance Group Problem Set 2 (125 poi.docx
BA 620 Managerial Finance Group Problem Set 2 (125 poi.docx
 
Problem 1Preston Recliners manufactures leather recliners and uses.docx
Problem 1Preston Recliners manufactures leather recliners and uses.docxProblem 1Preston Recliners manufactures leather recliners and uses.docx
Problem 1Preston Recliners manufactures leather recliners and uses.docx
 
Acc 561 week 5 discussion question 1
Acc 561 week 5 discussion question 1Acc 561 week 5 discussion question 1
Acc 561 week 5 discussion question 1
 
FIN 585 Effective Communication - tutorialrank.com
FIN 585 Effective Communication - tutorialrank.comFIN 585 Effective Communication - tutorialrank.com
FIN 585 Effective Communication - tutorialrank.com
 
ACC 561 Expect Success/newtonhelp.com
ACC 561 Expect Success/newtonhelp.comACC 561 Expect Success/newtonhelp.com
ACC 561 Expect Success/newtonhelp.com
 
ACCT 321 SEC 10K REPORT PROJECT
ACCT 321 SEC 10K REPORT PROJECTACCT 321 SEC 10K REPORT PROJECT
ACCT 321 SEC 10K REPORT PROJECT
 
It 205 week 3 discussion questions
It 205 week 3 discussion questionsIt 205 week 3 discussion questions
It 205 week 3 discussion questions
 
FIN 585 Exceptional Education - snaptutorial.com
FIN 585   Exceptional Education - snaptutorial.comFIN 585   Exceptional Education - snaptutorial.com
FIN 585 Exceptional Education - snaptutorial.com
 
ACC 561 TUTORIAL Education Planning--acc561tutorial.com
ACC 561 TUTORIAL Education Planning--acc561tutorial.comACC 561 TUTORIAL Education Planning--acc561tutorial.com
ACC 561 TUTORIAL Education Planning--acc561tutorial.com
 
FIN 585 Education Specialist / snaptutorial.com
FIN 585  Education Specialist / snaptutorial.com FIN 585  Education Specialist / snaptutorial.com
FIN 585 Education Specialist / snaptutorial.com
 
Bus 437 week 3 dq 1 implementation
Bus 437 week 3 dq 1 implementationBus 437 week 3 dq 1 implementation
Bus 437 week 3 dq 1 implementation
 
Fin 585 Believe Possibilities / snaptutorial.com
Fin 585   Believe Possibilities / snaptutorial.comFin 585   Believe Possibilities / snaptutorial.com
Fin 585 Believe Possibilities / snaptutorial.com
 
2.2 Assignment Totaling CostsGetting StartedProdu.docx
2.2 Assignment Totaling CostsGetting StartedProdu.docx2.2 Assignment Totaling CostsGetting StartedProdu.docx
2.2 Assignment Totaling CostsGetting StartedProdu.docx
 
Acc 561 week 5 discussion question 2
Acc 561 week 5 discussion question 2Acc 561 week 5 discussion question 2
Acc 561 week 5 discussion question 2
 

More from fredharris32

A report writingAt least 5 pagesTitle pageExecutive Su.docx
A report writingAt least 5 pagesTitle pageExecutive Su.docxA report writingAt least 5 pagesTitle pageExecutive Su.docx
A report writingAt least 5 pagesTitle pageExecutive Su.docxfredharris32
 
A reflection of how your life has changedevolved as a result of the.docx
A reflection of how your life has changedevolved as a result of the.docxA reflection of how your life has changedevolved as a result of the.docx
A reflection of how your life has changedevolved as a result of the.docxfredharris32
 
A Princeton University study argues that the preferences of average.docx
A Princeton University study argues that the preferences of average.docxA Princeton University study argues that the preferences of average.docx
A Princeton University study argues that the preferences of average.docxfredharris32
 
A rapidly growing small firm does not have access to sufficient exte.docx
A rapidly growing small firm does not have access to sufficient exte.docxA rapidly growing small firm does not have access to sufficient exte.docx
A rapidly growing small firm does not have access to sufficient exte.docxfredharris32
 
A psychiatrist bills for 10 hours of psychotherapy and medication ch.docx
A psychiatrist bills for 10 hours of psychotherapy and medication ch.docxA psychiatrist bills for 10 hours of psychotherapy and medication ch.docx
A psychiatrist bills for 10 hours of psychotherapy and medication ch.docxfredharris32
 
A project to put on a major international sporting competition has t.docx
A project to put on a major international sporting competition has t.docxA project to put on a major international sporting competition has t.docx
A project to put on a major international sporting competition has t.docxfredharris32
 
A professional services company wants to globalize by offering s.docx
A professional services company wants to globalize by offering s.docxA professional services company wants to globalize by offering s.docx
A professional services company wants to globalize by offering s.docxfredharris32
 
A presentation( PowerPoint) on the novel, Disgrace by J . M. Coetzee.docx
A presentation( PowerPoint) on the novel, Disgrace by J . M. Coetzee.docxA presentation( PowerPoint) on the novel, Disgrace by J . M. Coetzee.docx
A presentation( PowerPoint) on the novel, Disgrace by J . M. Coetzee.docxfredharris32
 
a presentatiion on how the over dependence of IOT AI and robotics di.docx
a presentatiion on how the over dependence of IOT AI and robotics di.docxa presentatiion on how the over dependence of IOT AI and robotics di.docx
a presentatiion on how the over dependence of IOT AI and robotics di.docxfredharris32
 
A P P L I C A T I O N S A N D I M P L E M E N T A T I O Nh.docx
A P P L I C A T I O N S A N D I M P L E M E N T A T I O Nh.docxA P P L I C A T I O N S A N D I M P L E M E N T A T I O Nh.docx
A P P L I C A T I O N S A N D I M P L E M E N T A T I O Nh.docxfredharris32
 
A nursing care plan (NCP) is a formal process that includes .docx
A nursing care plan (NCP) is a formal process that includes .docxA nursing care plan (NCP) is a formal process that includes .docx
A nursing care plan (NCP) is a formal process that includes .docxfredharris32
 
A nurse educator is preparing an orientation on culture and the wo.docx
A nurse educator is preparing an orientation on culture and the wo.docxA nurse educator is preparing an orientation on culture and the wo.docx
A nurse educator is preparing an orientation on culture and the wo.docxfredharris32
 
A NOVEL TEACHER EVALUATION MODEL 1 Branching Paths A Nove.docx
A NOVEL TEACHER EVALUATION MODEL 1 Branching Paths A Nove.docxA NOVEL TEACHER EVALUATION MODEL 1 Branching Paths A Nove.docx
A NOVEL TEACHER EVALUATION MODEL 1 Branching Paths A Nove.docxfredharris32
 
A Look at the Marburg Fever OutbreaksThis week we will exami.docx
A Look at the Marburg Fever OutbreaksThis week we will exami.docxA Look at the Marburg Fever OutbreaksThis week we will exami.docx
A Look at the Marburg Fever OutbreaksThis week we will exami.docxfredharris32
 
A network consisting of M cities and M-1 roads connecting them is gi.docx
A network consisting of M cities and M-1 roads connecting them is gi.docxA network consisting of M cities and M-1 roads connecting them is gi.docx
A network consisting of M cities and M-1 roads connecting them is gi.docxfredharris32
 
A minimum 20-page (not including cover page, abstract, table of cont.docx
A minimum 20-page (not including cover page, abstract, table of cont.docxA minimum 20-page (not including cover page, abstract, table of cont.docx
A minimum 20-page (not including cover page, abstract, table of cont.docxfredharris32
 
A major component of being a teacher is the collaboration with t.docx
A major component of being a teacher is the collaboration with t.docxA major component of being a teacher is the collaboration with t.docx
A major component of being a teacher is the collaboration with t.docxfredharris32
 
a mad professor slips a secret tablet in your food that makes you gr.docx
a mad professor slips a secret tablet in your food that makes you gr.docxa mad professor slips a secret tablet in your food that makes you gr.docx
a mad professor slips a secret tablet in your food that makes you gr.docxfredharris32
 
A New Mindset for   Leading Change [WLO 1][CLO 6]Through.docx
A New Mindset for   Leading Change [WLO 1][CLO 6]Through.docxA New Mindset for   Leading Change [WLO 1][CLO 6]Through.docx
A New Mindset for   Leading Change [WLO 1][CLO 6]Through.docxfredharris32
 
A N A M E R I C A N H I S T O R YG I V E M EL I B.docx
A N  A M E R I C A N  H I S T O R YG I V E  M EL I B.docxA N  A M E R I C A N  H I S T O R YG I V E  M EL I B.docx
A N A M E R I C A N H I S T O R YG I V E M EL I B.docxfredharris32
 

More from fredharris32 (20)

A report writingAt least 5 pagesTitle pageExecutive Su.docx
A report writingAt least 5 pagesTitle pageExecutive Su.docxA report writingAt least 5 pagesTitle pageExecutive Su.docx
A report writingAt least 5 pagesTitle pageExecutive Su.docx
 
A reflection of how your life has changedevolved as a result of the.docx
A reflection of how your life has changedevolved as a result of the.docxA reflection of how your life has changedevolved as a result of the.docx
A reflection of how your life has changedevolved as a result of the.docx
 
A Princeton University study argues that the preferences of average.docx
A Princeton University study argues that the preferences of average.docxA Princeton University study argues that the preferences of average.docx
A Princeton University study argues that the preferences of average.docx
 
A rapidly growing small firm does not have access to sufficient exte.docx
A rapidly growing small firm does not have access to sufficient exte.docxA rapidly growing small firm does not have access to sufficient exte.docx
A rapidly growing small firm does not have access to sufficient exte.docx
 
A psychiatrist bills for 10 hours of psychotherapy and medication ch.docx
A psychiatrist bills for 10 hours of psychotherapy and medication ch.docxA psychiatrist bills for 10 hours of psychotherapy and medication ch.docx
A psychiatrist bills for 10 hours of psychotherapy and medication ch.docx
 
A project to put on a major international sporting competition has t.docx
A project to put on a major international sporting competition has t.docxA project to put on a major international sporting competition has t.docx
A project to put on a major international sporting competition has t.docx
 
A professional services company wants to globalize by offering s.docx
A professional services company wants to globalize by offering s.docxA professional services company wants to globalize by offering s.docx
A professional services company wants to globalize by offering s.docx
 
A presentation( PowerPoint) on the novel, Disgrace by J . M. Coetzee.docx
A presentation( PowerPoint) on the novel, Disgrace by J . M. Coetzee.docxA presentation( PowerPoint) on the novel, Disgrace by J . M. Coetzee.docx
A presentation( PowerPoint) on the novel, Disgrace by J . M. Coetzee.docx
 
a presentatiion on how the over dependence of IOT AI and robotics di.docx
a presentatiion on how the over dependence of IOT AI and robotics di.docxa presentatiion on how the over dependence of IOT AI and robotics di.docx
a presentatiion on how the over dependence of IOT AI and robotics di.docx
 
A P P L I C A T I O N S A N D I M P L E M E N T A T I O Nh.docx
A P P L I C A T I O N S A N D I M P L E M E N T A T I O Nh.docxA P P L I C A T I O N S A N D I M P L E M E N T A T I O Nh.docx
A P P L I C A T I O N S A N D I M P L E M E N T A T I O Nh.docx
 
A nursing care plan (NCP) is a formal process that includes .docx
A nursing care plan (NCP) is a formal process that includes .docxA nursing care plan (NCP) is a formal process that includes .docx
A nursing care plan (NCP) is a formal process that includes .docx
 
A nurse educator is preparing an orientation on culture and the wo.docx
A nurse educator is preparing an orientation on culture and the wo.docxA nurse educator is preparing an orientation on culture and the wo.docx
A nurse educator is preparing an orientation on culture and the wo.docx
 
A NOVEL TEACHER EVALUATION MODEL 1 Branching Paths A Nove.docx
A NOVEL TEACHER EVALUATION MODEL 1 Branching Paths A Nove.docxA NOVEL TEACHER EVALUATION MODEL 1 Branching Paths A Nove.docx
A NOVEL TEACHER EVALUATION MODEL 1 Branching Paths A Nove.docx
 
A Look at the Marburg Fever OutbreaksThis week we will exami.docx
A Look at the Marburg Fever OutbreaksThis week we will exami.docxA Look at the Marburg Fever OutbreaksThis week we will exami.docx
A Look at the Marburg Fever OutbreaksThis week we will exami.docx
 
A network consisting of M cities and M-1 roads connecting them is gi.docx
A network consisting of M cities and M-1 roads connecting them is gi.docxA network consisting of M cities and M-1 roads connecting them is gi.docx
A network consisting of M cities and M-1 roads connecting them is gi.docx
 
A minimum 20-page (not including cover page, abstract, table of cont.docx
A minimum 20-page (not including cover page, abstract, table of cont.docxA minimum 20-page (not including cover page, abstract, table of cont.docx
A minimum 20-page (not including cover page, abstract, table of cont.docx
 
A major component of being a teacher is the collaboration with t.docx
A major component of being a teacher is the collaboration with t.docxA major component of being a teacher is the collaboration with t.docx
A major component of being a teacher is the collaboration with t.docx
 
a mad professor slips a secret tablet in your food that makes you gr.docx
a mad professor slips a secret tablet in your food that makes you gr.docxa mad professor slips a secret tablet in your food that makes you gr.docx
a mad professor slips a secret tablet in your food that makes you gr.docx
 
A New Mindset for   Leading Change [WLO 1][CLO 6]Through.docx
A New Mindset for   Leading Change [WLO 1][CLO 6]Through.docxA New Mindset for   Leading Change [WLO 1][CLO 6]Through.docx
A New Mindset for   Leading Change [WLO 1][CLO 6]Through.docx
 
A N A M E R I C A N H I S T O R YG I V E M EL I B.docx
A N  A M E R I C A N  H I S T O R YG I V E  M EL I B.docxA N  A M E R I C A N  H I S T O R YG I V E  M EL I B.docx
A N A M E R I C A N H I S T O R YG I V E M EL I B.docx
 

Recently uploaded

ECONOMIC CONTEXT - LONG FORM TV DRAMA - PPT
ECONOMIC CONTEXT - LONG FORM TV DRAMA - PPTECONOMIC CONTEXT - LONG FORM TV DRAMA - PPT
ECONOMIC CONTEXT - LONG FORM TV DRAMA - PPTiammrhaywood
 
BASLIQ CURRENT LOOKBOOK LOOKBOOK(1) (1).pdf
BASLIQ CURRENT LOOKBOOK  LOOKBOOK(1) (1).pdfBASLIQ CURRENT LOOKBOOK  LOOKBOOK(1) (1).pdf
BASLIQ CURRENT LOOKBOOK LOOKBOOK(1) (1).pdfSoniaTolstoy
 
Software Engineering Methodologies (overview)
Software Engineering Methodologies (overview)Software Engineering Methodologies (overview)
Software Engineering Methodologies (overview)eniolaolutunde
 
Call Girls in Dwarka Mor Delhi Contact Us 9654467111
Call Girls in Dwarka Mor Delhi Contact Us 9654467111Call Girls in Dwarka Mor Delhi Contact Us 9654467111
Call Girls in Dwarka Mor Delhi Contact Us 9654467111Sapana Sha
 
भारत-रोम व्यापार.pptx, Indo-Roman Trade,
भारत-रोम व्यापार.pptx, Indo-Roman Trade,भारत-रोम व्यापार.pptx, Indo-Roman Trade,
भारत-रोम व्यापार.pptx, Indo-Roman Trade,Virag Sontakke
 
Crayon Activity Handout For the Crayon A
Crayon Activity Handout For the Crayon ACrayon Activity Handout For the Crayon A
Crayon Activity Handout For the Crayon AUnboundStockton
 
POINT- BIOCHEMISTRY SEM 2 ENZYMES UNIT 5.pptx
POINT- BIOCHEMISTRY SEM 2 ENZYMES UNIT 5.pptxPOINT- BIOCHEMISTRY SEM 2 ENZYMES UNIT 5.pptx
POINT- BIOCHEMISTRY SEM 2 ENZYMES UNIT 5.pptxSayali Powar
 
call girls in Kamla Market (DELHI) 🔝 >༒9953330565🔝 genuine Escort Service 🔝✔️✔️
call girls in Kamla Market (DELHI) 🔝 >༒9953330565🔝 genuine Escort Service 🔝✔️✔️call girls in Kamla Market (DELHI) 🔝 >༒9953330565🔝 genuine Escort Service 🔝✔️✔️
call girls in Kamla Market (DELHI) 🔝 >༒9953330565🔝 genuine Escort Service 🔝✔️✔️9953056974 Low Rate Call Girls In Saket, Delhi NCR
 
Enzyme, Pharmaceutical Aids, Miscellaneous Last Part of Chapter no 5th.pdf
Enzyme, Pharmaceutical Aids, Miscellaneous Last Part of Chapter no 5th.pdfEnzyme, Pharmaceutical Aids, Miscellaneous Last Part of Chapter no 5th.pdf
Enzyme, Pharmaceutical Aids, Miscellaneous Last Part of Chapter no 5th.pdfSumit Tiwari
 
ENGLISH5 QUARTER4 MODULE1 WEEK1-3 How Visual and Multimedia Elements.pptx
ENGLISH5 QUARTER4 MODULE1 WEEK1-3 How Visual and Multimedia Elements.pptxENGLISH5 QUARTER4 MODULE1 WEEK1-3 How Visual and Multimedia Elements.pptx
ENGLISH5 QUARTER4 MODULE1 WEEK1-3 How Visual and Multimedia Elements.pptxAnaBeatriceAblay2
 
Alper Gobel In Media Res Media Component
Alper Gobel In Media Res Media ComponentAlper Gobel In Media Res Media Component
Alper Gobel In Media Res Media ComponentInMediaRes1
 
Painted Grey Ware.pptx, PGW Culture of India
Painted Grey Ware.pptx, PGW Culture of IndiaPainted Grey Ware.pptx, PGW Culture of India
Painted Grey Ware.pptx, PGW Culture of IndiaVirag Sontakke
 
How to Configure Email Server in Odoo 17
How to Configure Email Server in Odoo 17How to Configure Email Server in Odoo 17
How to Configure Email Server in Odoo 17Celine George
 
CARE OF CHILD IN INCUBATOR..........pptx
CARE OF CHILD IN INCUBATOR..........pptxCARE OF CHILD IN INCUBATOR..........pptx
CARE OF CHILD IN INCUBATOR..........pptxGaneshChakor2
 
Class 11 Legal Studies Ch-1 Concept of State .pdf
Class 11 Legal Studies Ch-1 Concept of State .pdfClass 11 Legal Studies Ch-1 Concept of State .pdf
Class 11 Legal Studies Ch-1 Concept of State .pdfakmcokerachita
 
SOCIAL AND HISTORICAL CONTEXT - LFTVD.pptx
SOCIAL AND HISTORICAL CONTEXT - LFTVD.pptxSOCIAL AND HISTORICAL CONTEXT - LFTVD.pptx
SOCIAL AND HISTORICAL CONTEXT - LFTVD.pptxiammrhaywood
 
The Most Excellent Way | 1 Corinthians 13
The Most Excellent Way | 1 Corinthians 13The Most Excellent Way | 1 Corinthians 13
The Most Excellent Way | 1 Corinthians 13Steve Thomason
 
Hybridoma Technology ( Production , Purification , and Application )
Hybridoma Technology  ( Production , Purification , and Application  ) Hybridoma Technology  ( Production , Purification , and Application  )
Hybridoma Technology ( Production , Purification , and Application ) Sakshi Ghasle
 

Recently uploaded (20)

ECONOMIC CONTEXT - LONG FORM TV DRAMA - PPT
ECONOMIC CONTEXT - LONG FORM TV DRAMA - PPTECONOMIC CONTEXT - LONG FORM TV DRAMA - PPT
ECONOMIC CONTEXT - LONG FORM TV DRAMA - PPT
 
BASLIQ CURRENT LOOKBOOK LOOKBOOK(1) (1).pdf
BASLIQ CURRENT LOOKBOOK  LOOKBOOK(1) (1).pdfBASLIQ CURRENT LOOKBOOK  LOOKBOOK(1) (1).pdf
BASLIQ CURRENT LOOKBOOK LOOKBOOK(1) (1).pdf
 
Software Engineering Methodologies (overview)
Software Engineering Methodologies (overview)Software Engineering Methodologies (overview)
Software Engineering Methodologies (overview)
 
Call Girls in Dwarka Mor Delhi Contact Us 9654467111
Call Girls in Dwarka Mor Delhi Contact Us 9654467111Call Girls in Dwarka Mor Delhi Contact Us 9654467111
Call Girls in Dwarka Mor Delhi Contact Us 9654467111
 
9953330565 Low Rate Call Girls In Rohini Delhi NCR
9953330565 Low Rate Call Girls In Rohini  Delhi NCR9953330565 Low Rate Call Girls In Rohini  Delhi NCR
9953330565 Low Rate Call Girls In Rohini Delhi NCR
 
भारत-रोम व्यापार.pptx, Indo-Roman Trade,
भारत-रोम व्यापार.pptx, Indo-Roman Trade,भारत-रोम व्यापार.pptx, Indo-Roman Trade,
भारत-रोम व्यापार.pptx, Indo-Roman Trade,
 
Crayon Activity Handout For the Crayon A
Crayon Activity Handout For the Crayon ACrayon Activity Handout For the Crayon A
Crayon Activity Handout For the Crayon A
 
Model Call Girl in Bikash Puri Delhi reach out to us at 🔝9953056974🔝
Model Call Girl in Bikash Puri  Delhi reach out to us at 🔝9953056974🔝Model Call Girl in Bikash Puri  Delhi reach out to us at 🔝9953056974🔝
Model Call Girl in Bikash Puri Delhi reach out to us at 🔝9953056974🔝
 
POINT- BIOCHEMISTRY SEM 2 ENZYMES UNIT 5.pptx
POINT- BIOCHEMISTRY SEM 2 ENZYMES UNIT 5.pptxPOINT- BIOCHEMISTRY SEM 2 ENZYMES UNIT 5.pptx
POINT- BIOCHEMISTRY SEM 2 ENZYMES UNIT 5.pptx
 
call girls in Kamla Market (DELHI) 🔝 >༒9953330565🔝 genuine Escort Service 🔝✔️✔️
call girls in Kamla Market (DELHI) 🔝 >༒9953330565🔝 genuine Escort Service 🔝✔️✔️call girls in Kamla Market (DELHI) 🔝 >༒9953330565🔝 genuine Escort Service 🔝✔️✔️
call girls in Kamla Market (DELHI) 🔝 >༒9953330565🔝 genuine Escort Service 🔝✔️✔️
 
Enzyme, Pharmaceutical Aids, Miscellaneous Last Part of Chapter no 5th.pdf
Enzyme, Pharmaceutical Aids, Miscellaneous Last Part of Chapter no 5th.pdfEnzyme, Pharmaceutical Aids, Miscellaneous Last Part of Chapter no 5th.pdf
Enzyme, Pharmaceutical Aids, Miscellaneous Last Part of Chapter no 5th.pdf
 
ENGLISH5 QUARTER4 MODULE1 WEEK1-3 How Visual and Multimedia Elements.pptx
ENGLISH5 QUARTER4 MODULE1 WEEK1-3 How Visual and Multimedia Elements.pptxENGLISH5 QUARTER4 MODULE1 WEEK1-3 How Visual and Multimedia Elements.pptx
ENGLISH5 QUARTER4 MODULE1 WEEK1-3 How Visual and Multimedia Elements.pptx
 
Alper Gobel In Media Res Media Component
Alper Gobel In Media Res Media ComponentAlper Gobel In Media Res Media Component
Alper Gobel In Media Res Media Component
 
Painted Grey Ware.pptx, PGW Culture of India
Painted Grey Ware.pptx, PGW Culture of IndiaPainted Grey Ware.pptx, PGW Culture of India
Painted Grey Ware.pptx, PGW Culture of India
 
How to Configure Email Server in Odoo 17
How to Configure Email Server in Odoo 17How to Configure Email Server in Odoo 17
How to Configure Email Server in Odoo 17
 
CARE OF CHILD IN INCUBATOR..........pptx
CARE OF CHILD IN INCUBATOR..........pptxCARE OF CHILD IN INCUBATOR..........pptx
CARE OF CHILD IN INCUBATOR..........pptx
 
Class 11 Legal Studies Ch-1 Concept of State .pdf
Class 11 Legal Studies Ch-1 Concept of State .pdfClass 11 Legal Studies Ch-1 Concept of State .pdf
Class 11 Legal Studies Ch-1 Concept of State .pdf
 
SOCIAL AND HISTORICAL CONTEXT - LFTVD.pptx
SOCIAL AND HISTORICAL CONTEXT - LFTVD.pptxSOCIAL AND HISTORICAL CONTEXT - LFTVD.pptx
SOCIAL AND HISTORICAL CONTEXT - LFTVD.pptx
 
The Most Excellent Way | 1 Corinthians 13
The Most Excellent Way | 1 Corinthians 13The Most Excellent Way | 1 Corinthians 13
The Most Excellent Way | 1 Corinthians 13
 
Hybridoma Technology ( Production , Purification , and Application )
Hybridoma Technology  ( Production , Purification , and Application  ) Hybridoma Technology  ( Production , Purification , and Application  )
Hybridoma Technology ( Production , Purification , and Application )
 

Article Reviews each class will typically offer at least one arti.docx

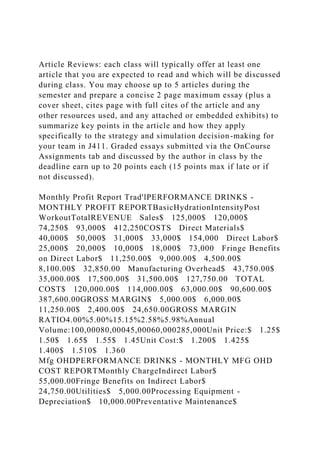
  • 1. Article Reviews: each class will typically offer at least one article that you are expected to read and which will be discussed during class. You may choose up to 5 articles during the semester and prepare a concise 2 page maximum essay (plus a cover sheet, cites page with full cites of the article and any other resources used, and any attached or embedded exhibits) to summarize key points in the article and how they apply specifically to the strategy and simulation decision-making for your team in J411. Graded essays submitted via the OnCourse Assignments tab and discussed by the author in class by the deadline earn up to 20 points each (15 points max if late or if not discussed). Monthly Profit Report Trad'lPERFORMANCE DRINKS - MONTHLY PROFIT REPORTBasicHydrationIntensityPost WorkoutTotalREVENUE Sales$ 125,000$ 120,000$ 74,250$ 93,000$ 412,250COSTS Direct Materials$ 40,000$ 50,000$ 31,000$ 33,000$ 154,000 Direct Labor$ 25,000$ 20,000$ 10,000$ 18,000$ 73,000 Fringe Benefits on Direct Labor$ 11,250.00$ 9,000.00$ 4,500.00$ 8,100.00$ 32,850.00 Manufacturing Overhead$ 43,750.00$ 35,000.00$ 17,500.00$ 31,500.00$ 127,750.00 TOTAL COST$ 120,000.00$ 114,000.00$ 63,000.00$ 90,600.00$ 387,600.00GROSS MARGIN$ 5,000.00$ 6,000.00$ 11,250.00$ 2,400.00$ 24,650.00GROSS MARGIN RATIO4.00%5.00%15.15%2.58%5.98%Annual Volume:100,00080,00045,00060,000285,000Unit Price:$ 1.25$ 1.50$ 1.65$ 1.55$ 1.45Unit Cost:$ 1.200$ 1.425$ 1.400$ 1.510$ 1.360 Mfg OHDPERFORMANCE DRINKS - MONTHLY MFG OHD COST REPORTMonthly ChargeIndirect Labor$ 55,000.00Fringe Benefits on Indirect Labor$ 24,750.00Utilities$ 5,000.00Processing Equipment - Depreciation$ 10,000.00Preventative Maintenance$
  • 2. 10,000.00Information Technology$ 23,000.00Total$ 127,750.00 ACCT640 – Managerial Accounting Fall 2013 Case #2 – Performance Drinks: Applying Activity Based Costing Background: Performance Drinks, LLC is owned by Dave N. Port. Performance Drinks produces a variety of sports centered drinks. They began operations in 1993 shortly after Mr. Port graduated with his M.B.A. from Davenport University. The company saw early success as sports and fitness nutritional products gained new popularity in the 1990’s. Financially the company is sound and has been wise in controlling their growth over the years. However, within the last 18 months Mr. Port has noticed a drop in overall company profitability. This is especially troubling considering that the company has continued to experience top-line growth. Mr. Port and his management team have been considering developing a new product line. However, those plans have been put on hold until they can figure out why their profits are shrinking. Performance Drinks makes four different kinds of sports drinks. Those drinks are as follows: · Basic · Hydration · Intensity · Post-Workout Each of these drinks contains a slightly different nutritional
  • 3. profile and is targeted for different users and uses. The Basic drink has the least nutritional benefit and is targeted for general consumption. The Hydration product targets endurance athletes and specializes in hydration replacement. The Intensity product was designed with energy enhancement in mind. It serves the needs of extreme athletes who need long durations of sustained energy. Lastly, the Post-Workout product is a nutritional replacement product that is generally used following exertion. You are the Controller for Performance Drinks. You feel as though you have a good handle on the financial reporting and the overall company performance. However, admittedly, your accounting information system has been designed to serve the needs of external users from an aggregate perspective. To that end you utilize absorption costing exclusively within the organization. You recall studying the concept of Activity Based Management (ABM) and Activity Based Costing (ABC) while taking a managerial accounting course. You wonder if applying those ideas to your business would help to uncover the mystery of the disappearing profits. You recall from your Management Accounting class that product costs are comprised of: · Direct Materials · Direct Labor · Manufacturing Overhead You don’t suspect that anything strange is going with your direct costs. You do wonder, however, if a more thorough understanding of your indirect costs may be in order. Over a series of weeks you talk with a variety of employees, representing a multitude of functional areas, from within the company. During those conversations you take careful note on what activities might be consuming resources and how those activities might be measured. You sharpen your pencil and begin to unpack what you’ve learned. You start with reviewing last month’s Product-Level Profit Report. That report is following:
  • 4. Since your primary area of focus is on the indirect costs you compile the following report which further details your overhead charges: Overhead Activities: Using traditional costing methods, which support your absorption costing system, you base overhead allocation on direct labor cost. Furthermore, “fringe benefits” are a function of direct labor cost. As a result of your many meetings to discuss company overhead you determine that the majority of your indirect costs are related to four primary activities. Those activities are equipment set-ups, production runs, production management and machine-hour capacity. “Production Management” refers to a number of items that are correlated to the number of products the company produces. Ultimately you determine that your key activities have the following usage patterns, as they pertain to the monthly overhead costs: Upon reviewing budget data from the last budget cycle you discover that the monthly number of set-ups was estimated to be 85. The number of production runs was estimated to be 250. That monthly machine-hour capacity is presently at 20,000 machine-hours. Lastly, Performance Drinks produces a total of four products. After talking with the Plant Manger you create the following usage data relative to products and activities: Requirements: 1. Based on all of the date provided, compute the cost driver rates for each of the four activities. 2. Compute the per unit product costs for each of the four products. Compute this cost using ABC allocation for overhead. Show the computation for each per unit product cost in detail. 3. Prepare a “Monthly Profit Report”, like the one provided on page 4 of this packet. Create this report using the results of
  • 5. your ABC overhead allocation. 4. Prepare a written “Management Report” that explains to the management team what Activity Based Costing is, how it was used to generate the Monthly Profit Report (from requirement #3). Explain why the profit for each product is different when comparing the Traditional report with the ABC report. Explain what the company might consider doing, based on all of this information, to stop the erosion of company profits. Defend your recommendations with data. Additional Consideration: Mr. Port wonders what would happen to costs if plant capacity was shifted from 20,000 machine-hours a month to 40,000 machine-hours per month. Requirements: 5. Compute the new cost per unit for each of the products considering the increase in capacity. Show the computation for each per unit product cost in detail. 6. What is the cost of the unused capacity if it is assumed that the company has 40,000 machine-hours of capacity but it using 20,000 machine-hours? Amend your “Management Report” to include a discussion on how to best use the additional capacity. Clarification on format and data: Clear communication and professionalism are important. Defending your answer with data is important. · An electronic copy of this Case (this document) is available within Blackboard. Additionally, an Excel file, containing the basic data for the case will be available within Blackboard. · You will create one professional report. In that report you should clearly label all of your answers. Make your answers easy to read and find. Imagine you were giving this report to your boss. Further imagine you have to lead your boss and the executive team through your findings. As it pertains to requirement #4, include the “Management Report” inside your overall report. You will then have one Word document as your final product. You will also have one Excel file.
  • 6. · Grading is based on both accuracy (see rubric) and your ability to communicate your answers professionally and clearly. · Use the following naming structure for your files: last name_first initial_case2.docx. Of course your Excel file will have an .xls suffix. · Double space your report. · Put good thought into how you organize your Excel document. Part of your grade will be based upon the usability and layout of your Excel file. Imagine that have to give the electronic copy of your Excel file to your boss, or a peer, to work with. Imagine that you could not coach them at all on how to use your file. Is your file organized and labeled so clearly that anyone could use it, easily, without instructions from you? You want to strive for that kind of clarity in your work. · Your report should have a title page. Use APA 6th edition for guidance on title pages. · Late submissions will result in the following: 10% reduction in score for each 24 hour period of being late (up to 3 days). After 3 days late zero credit will be earned. · As always please come to me with learning questions. This project is a learning experience. Rubric: This project is worth 20% (200 points) of your overall course grade. I will convert your scores to a 200 point scale. 1 MANAGER'S TOOL KIT Do you know where the money's being made in your industry I Tl
  • 7. BY ORIT GADIESH AND JAMES L. GILBERT ANY MANAGERS CHART Strategy w i t h o u t a full u n d e r s t a n d i n g of t h e sources and distribution of profits in their industry. Sometimes, they fo- cus their sights on revenues instead of profits, assuming that revenue growth will eventually translate into profit growth. In other cases, they simply lack the data or the ana- lytical tools required to isolate and Orit Gadiesb is the chairman of Bain &) Company in Boston, Massa- chusetts, fames L. Gilbert is a direc- tor of the firm. measure variations in profitahility. Whatever the cause, an incomplete understanding of profits can create blind spots in a company's strategic vision, leading it to overlook attrac- tive profit-building opportunities or to become trapped in areas of weak or fading profitability. In this article, we will describe a useful framework for analyzing how profits are distributed among the various activities that form an in-
  • 8. dustry's value chain. Such an analy- sis can provide a company's man- agers with a rich understanding of their industry's profit s t r u c t u r e - what we call its profit pool - enabling them to identify which activities are generating disproportionately large or small shares of profits. Even more important, a profit-pool map opens a window onto the underlying struc- ture of the industry, helping man- agers see the economic and competi- tive forces that are determining the distribution of profits. As such, a profit-pool map provides a solid ba- sis for strategic thinking. (See our ar- ticle "Profit Pools: A Fresh Look at Strategy" in this issue of HBR.) Mapping a profit pool is, in one sense, a straightforward exercise: you define the value chain activi- ties and then you determine their size and profitability. But while the goal is simple, achieving it can be complicated. Why? Because in most industries, financial data are not re- ported in niee, neat bundles corre- sponding to each value-chain activ- ity. Detailed data may be available on individual companies, but those companies will often participate in many different activities. Similarly, there may be good information on product sales or customer purchases
  • 9. or channel volumes, but the prod- ucts, customers, and channels will rarely line up cleanly with the bound- aries of a particular activity. Trans- lating the available data into accu- rate estimates of an activity's size and profitability requires consider- able creativity. Altbough no two companies will perform the analysis in precisely the same way, it is possible to describe a broadly applicable process for get- ting the answers - a process that lays out the tasks that need to be accom- plished, the questions that need to be asked, the types of data that need to be collected, and the types of analyses that need to be done. A Foui-Step Process Mapping a profit pool involves four steps: defining the pool's boundaries, estimating the pool's overall size, es- timating the size of each value-chain activity in the pool, and checking and reconciling the calculations. (See the chart "Mapping a Profit Pool.") We will describe each step and then provide an example of how the entire process is applied. Finally, HARVARD BUSINESS REVIEW M;iy-Junc 1998 149
  • 10. MANAGER'S TOOL KIT HOW TO MAP YOUR INDUSTRY S PROFIT POOL Stepl Define the pool TASK Determine which value-chain activities influence your ability to generate profits now and in the future GUIDELINES Take a broad view of the value chain; look beyond traditional industry definitions Examine your industry from three perspectives: your own company's, other players', and the customer's Talk to industry players and analysts to uncover new or emerging business models Don't disaggregate activities more than is necessary
  • 11. OUTPUT List of all value-chain activities in your profit ; pool (in sequential order) MAPPING A Step 2 Determine the size of the pool Develop a baseline estimate of the cumulative profits generated by all profit-pool activities Seek a rough but accurate estimate Take the easiest analytical routes available; go where the data are Try to take at least two different views of pool size - for example, company-level and product-level Focus on the largest
  • 12. components - for example, large compa- nies, high-volume products; extrapolate smaller components from a sample Estimate of total pool profits, usually expressed as a range PROFIT POOL Step 3 Determine the distribution of profits Develop estimates of the profits generated by each activity Shift between aggregation and disaggregation in your analysis Look at your own company's economics first, then look at large pure players, then at large mixed players, then at a sample of smaller players If relevant company data are unavailable,
  • 13. use proxies such as product-level or channel-level sales Think creatively Point estimates of profits for each value-chain activity Step 4 Reconcile the estimates Compare the outputs of steps 2 and 3 and, if necessary, reconcile the numbers If the numbers don't add up, check all assumptions and calculations Collect additional data if necessary Resolve all inconsistencies; don't ignore them Final estimates of activity and total pool profits
  • 14. we will look at ways of organizing the data in chart form as a first step toward plotting a profit-pool strategy. Define the pool. Before you can start analyzing your industry's profit pool, you need to define its bound- aries by identifying the value-chain activities that are relevant to your own business. Where, for purposes of developing strategy, should the value chain be said to begin and to end? At the conclusion of this step, you should have a clearly defined list of the individual value-chain activi- ties that make up your profit pool. The key is to define the value chain broadly enough to capture all tbe activities that have a meaningful influence on your ability to earn profits-not just today but in the fu- ture as well. You should begin by 150 HARVARD BUSINESS REVIEW May-June 1998 HOW TO MAP YOUR INDUSTRY'S PROFIT POOL MANAGER'S TOOL KIT taking a close look at your own busi- ness, breaking it down into its dis- crete value-chain activities. But you
  • 15. shouldn't stop there. Because there are many ways to compete in any in- d u s t r y - a n d new ways are being thought up all the t i m e - y o u should also look at the activities of your competitors and potential competi- tors. Have other companies in your industry adopted business models that involve different sets of activi- ties? Might you have opportunities to perform new activities in your in- dustry or in other industries? Are there activities being performed in other industries that could displace or substitute for the activities you are performing? A company that operates call cen- ters to handle telephone orders for catalog retailers, for example, may in the future be able to fulfill cus- tomer service functions for electric utilities or transportation carriers. And, just as important, it may one day face a competitive threat from companies in other industries, such as telephone companies, cable tele- vision operators, or even Internet service providers. The call-center operator should, therefore, define its profit pool to include not only those value chain activities traditionally associated with direct-mail retailing but also activities in other industries that could infiuence its future cre- ation of profits.
  • 16. Finally, you should take a step hack to look at your industry through t h e eyes of t h e c u s t o m e r . How would the customer define the life cycle of the product or service you produce? Often, a customer will de- fine your industry to include activi- ties that you would consider periph- eral. If a paint manufacturer, for example, asks homeowners about the experience of buying and using paint, it may find that the disposal of leftover paint is an important ac- tivity from their perspective. Dis- posal requirements may infiuence the kinds of paint they buy and thus may have a direct impact on the paint industry's profit pool. The manufac- turer would be wise to include paint disposal as part of its value chain. In addition to deciding which ac- tivities to include, a company needs to decide the proper level of aggrega- tion for each activity. In the automo- tive industry, for example, financial service activities, such as lending, leasing, and renting, make up an im- portant part of the profit pool. Do yon define those activities as a single value-chain segment or do you look at them individually? The answer depends on the business you're in. A chain of auto parts stores would
  • 17. probably not need to di- vide the financial service segment into its compo- nent activities - after all, the company would not be likely to participate in any of those activities. A used ear dealer, however, might well want to break down the financial ser- vices segment into the narrower seg- ments of lending, leasing, and rent- ing. Because the dealer controls an important point of customer con- tact, it may decide to enter one or more of these activities in the fu- ture. It may also find itself compet- ing with a participant in one of these activities-say, a new ear dealer that needs to sell nsed cars coming off their leases. Defining the bounds of a profit pool requires, in short, not just ana- lytieal skills but also good, basic business judgment. The pool you draw m u s t be tailored to fit the strategic questions you face. Determine the size of the pool. Once you have defined the profit pool, you need to determine its over- all size. What is the total amount of profits being earned in all the value chain activities? At this point, all you need is a rough estimate of total
  • 18. industry profits. The idea is to estab- lish a baseline against which you can check the reliability of the more de- tailed, activity-by-activity calcula- tions you will make later. If you're lucky, you may be able to estimate the size of the pool by read- ing a few industry reports from stock analysts or other researchers. Or you may be able to find a reliable esti- mate of overall industry revenues and then apply an assumed industry- average margin to it. Usually, though, developing this estimate will not he so straightforward. The way you de- fine your profit pool is unlikely to coincide precisely with any tradi- tional industry definition. More- over, the financial data yon require may not be readily available in the form you need. A good idea in these situations is to try to build up estimates of the total pool based on the profitability of individual companies, products, channels, or regions. You should al- How you define your profit pool is unlikely to coincide precisely with any traditional industry definition.
  • 19. ways try to focus first on the biggest pieces-the largest companies or the highest-volume products, for exam- ple. If there are large public compa- nies that account for a significant proportion of industry profits, use their financial statements as a start- ing point. To gauge the profits of the smaller players, you adjust the lead- ers' margins-to reflect the smaller players' competitive advantages or disadvantages - and then apply the adjusted margin to the remaining in- dustry revenues. You then add the leaders' actual profits to your esti- mate of the total profits of the smaller companies to gain an overall esti- mate of industry profits. (See the in- sert "What Is 'Profit' Anyway?") While a high degree of precision isn't necessary at this point, you do need to have confidence in the gen- eral accuracy of the estimate. There- fore, it is always advisable to develop estimates based on at least two dif- ferent views of an industry. Try to develop estimates based, for exam- ple, on players and produets. You can then compare the estimates to en- sure they're in the sam.e ballpark. The more data you have and the more a n a l y t i c a l approaches you take, the more accurate your esti- mate will be.
  • 20. D e t e r m i n e t h e d i s t r i b u t i o n of profits. Determining the way profits are distributed among different value- chain activities is the core challenge of profit-pool mapping. There are HARVARD BUSINESS REVIEW M;iy-|unc 1998 151 MANAGER'S TOOL KfT HOW TO MAP YOUR INDUSTRY S PROFIT POOL WHAT IS "PROFIT" ANYWAY? Today there are almost as many ways to define profit as there are to make it. For practical purposes, though, managers tend to think about profit in one of three ways: as accounting profit, as return on investment, or as cash-flow con- tribution. Because each of the measures can be used as the basis for management decisions, they all can he important in profit-pool mapping. Aeeounting profit represents a eompany's earnings as formally reported. It is the measurement method underlying net-income and earnings-per-share calcula- tions in shareholder reports and other official filings. Its precise method of calculation can vary, depending on t h e a c c o u n t i n g
  • 21. standards specific to a given in- dustry or country. Return on investment repre- sents a company's earnings after taking into account the cost of capital invested in the business. Because ROI represents the true profit associated with investment in an industry, it is an essential measure for evaluating potential new investments. It can be mea- sured using a number of different methodologies, which all have advantages and disadvantages. One of the most useful ROI mea- sures is economic value-added (EVAj, which equals after-tax op- erating profits minus the cost of all invested capital. Because EVA expresses returns as an absolute profit value rather than as a per- centage, it lends itself well to profit-pool mapping. two general analytical approaches to this task: aggregation and disaggre- gation. If you are in an industry in which all the companies focus on a single value-chain a c t i v i t y - i n which all are, in other words, "pure players" - you will calculate activity profitability by aggregating the prof- its of all the pure players. If, by con- Cash-flow contribution is, in
  • 22. general, a company's earnings be- fore taking fixed-asset and capital costs into account. It is frequent- ly expressed as earnings before income taxes, depreciation, and amortization (EBITDA). In some cases, fixed operating costs, such as overhead, are also suhtracted. An incremental measure, it repre- se n t s the a m o u n t of cash left from a sale after subtracting the variable costs associated w i t h that sale. Cash-flow contribution is frequently used as the basis for management decision making in m a t u r e , h i g h - f i x e d - c o s t , and cyclical industries, particularly during down cycles. It is also a useful profit measure for compa- nies that are investing to gain market share and for those that are engaged in leveraged huyouts. Developing detailed profit-pool maps using all three measures would be a forbiddingly complex undertaking. In m.ost cases, fortu- nately, it is sufficient to use just one basis of measurement for in- depth mapping. Other relevant measures ean then be roughly es- timated as needed. Most compa- nies will use accounting profit as t h e i r b a s i c m e a s u r e b e c a u s e that's the form in which profit data are generally reported. How-
  • 23. ever, when a company's profit pool extends across industries or countries, managers need to he aware of and take into account possible differences in account- ing standards. The goal should al- ways be to measure profit consis- tently across the entire pool. trast, all the companies in your in- d u s t r y are v e r t i c a l l y i n t e g r a t e d "mixed players," each performing many different activities, you will need to disaggregate each company's financial data to arrive at estimates for a specific activity. In reality, of course, most indus- tries include a combination of pure players and mixed players. Your analysis, therefore, will likely in- clude both aggregation and disaggre- gation. At some stages, you'll be tearing data apart. At others, you'll be building it up. You start, once again, by looking at the economics of your own com- pany, examining revenues, costs, and profits by activity. If you're a pure player, this won't take much w o r k - a l l your revenues and costs will be allocated to the same activ- ity. If you're involved in many activi- ties and your financial-reporting sys-
  • 24. tem does not clearly distinguish among them, you will need to disen- tangle your revenues and costs. In companies whose fixed costs are shared hy a number of different ac- tivities, as is the case in many finan- cial-services institutions, allocating costs will likely require not only careful analysis but also some in- depth thinking about the structure of the business. Now you look outside your com- pany to examine the economics of other players in the industry. Al- though the sources of company data will vary by industry, there are some common places to look. You will draw on annual reports, 10-K filings, and stock-analyst reports (for public companies), as well as company pro- files by research organizations such as Dun &. Bradstreet, reports by in- dustry associations, and trade maga- zines. Eor regulated industries, the government can be a good source. And in some industries, there are companies that specialize in collect- ing and reporting detailed financial information. If data are unavailable on a company, you may need to esti- mate its profitability based on the performance of a similar company for which data are available. You should always look first at
  • 25. any pure players. Once you know their revenues, costs, and profits, you'll have an economic yardstick for measuring the activity in which they specialize. You can then look at the mixed players. In some cases, they will report their financial infor- mation by activity, making your work easier. In other cases, however, the information they report will he aggregated-you'll need to break it 152 HARVARD BUSINESS REVIEW May-(unc 1998 MANAGER'S TOOL KIT HOW TO MAP YOUR INDUSTRY'S PROFIT POOL down by activity. To accomplish that, you can often use what you learned about the margins and cost structure of the pure players to make accurate a s s u m p t i o n s about the mixed players' economics for a given activity, taking into account their particular competitive advantages and disadvantages. For activities in which your company participates, you may also be able to use your own economics as a yardstick. You won't need to collect data on all the companies participating in all the value chain activities. In most industries, the 80/20 rule will apply:
  • 26. 20% of the companies will account for 80% of the revenues. By collect- ing data on the largest companies, you will likely have covered most of the industry. You can then extrapo- late the economic data for the smaller companies by collecting data on a sample of them. Once you have the data on your own company, the large pure players, the large mixed play- ers, and a sample of the smaller eom- panies, you add up the figures, activ- ity by activity, to arrive at overall estimates. Sometimes, it will actually be eas- ier to gather financial data on prod- ucts, customers, or channels than on companies. This is often the case in industries characterized by a high degree of vertical integration. In such eases, you should go where the data are. If you can get detailed data on the economies of different prod- uct types, for example, you can allo- cate costs, revenues, and profits to different activities at the product level. Then you add up the numbers, activity by activity, to arrive at total estimates. As witb company data, the process is a matter of aggregating and disaggregating. At the end of this step, the shape of your profit pool should be clear. You will know the profits - as well as
  • 27. the revenues, costs, and margins-of each value-chain activity. And you will know how your own economi cs stack up to the averages, activity by activity. R e c o n c i l e t h e e s t i m a t e s . T h e fourth and final step in the analysis serves as a reality check. You add up the profit estimates for each activity, and you compare the total with the overall estimate of industry profits you developed earlier. If there are discrepancies, you need to go back and check your assumptions and cal- culations and, if necessary, collect additional data. Don't be surprised if you have to spend considerable time reconciling the numbers. Because you will often have made your esti- mates in an indirect way, based on fragmented or incomplete data, dis- crepancies will be common. Applying the Process: The RegionBank Case To show how a company would ac- tually use this process, let's put our- selves in the shoes of the managers of RegionBank, a hypothetical retail bank based in tbe midwestern United States. RegionBank is in a tight spot. Fundamental changes in the finan- cial services industry have under- mined the traditional advantages of
  • 28. its vertically integrated, regionally focused business model. Powerful national product specialists -MBNA in credit cards, Fidelity in mutual funds. Countrywide Mortgage in mortgage lending-are stealing away m a n y of i t s b e s t cus- tomers. New distribution channels, such as tele- phone and on-line bank- ing, threaten to render its e x p e n s i v e n e t w o r k of local branches obsolete. Even its back-office trans- actional functions, like credit card processing, are under attack from bighly efficient specialists sucb as First Data Corporation. As RegionBank's m a n a g e m e n t team, we know we cannot simply stay the course, hoping for the best. As margins narrow, our current busi- ness model seems unsustainable. But to develop a new m o d e l - o n e that will allow us to carve out and hold on to a substantial piece of tbe banking industry's rapidly shifting profit p o o l - w e need to have a thor- ough understanding of the industry and its patterns of profit creation. Where in the banking value chain are attractive profits being generated? Why is the profitability of some banking activities rising wbile the profitability of others is falling?
  • 29. Wliich companies are capturing the profits? What are their b u s i n e s s models? Only after we know where and how profits are being m a d e - and by wliom - will we be in a position to think about the forces shaping our industry and to make rational deci- sions about our strategic direction. Define the pool. We start by set- ting the bounds of our profit pool. After looking at the activities we perform, the aetivities performed by current and potential competitors, and the ways customers perceive our business, we see that our industry is broader than the regional banking industry as traditionally defined. It encompasses the entire U.S. con- sumer-financial-services industry, which can be viewed as including three core activities: acquiring cus- tomers through branches or other channels (acquisition); lending and managing money (for simplicity, we'll eall this activity funding); and delivering a variety of related back- room services, such as transactions and reporting [servicing). These ac- tivities define RegionBank's playing field, and by focusing on tbem we will have the necessary breadth of Determining the distribution of profits among value chain
  • 30. activities is the core challenge. vision to answer the question on wbich all our strategic decisions turn: Wbere in consumer financial services will companies be able to make money? Determine the size of the pool. To develop a rough but accurate esti- mate of our profit pool, we under- t a k e two different a n a l y s e s . We determine tbe eumulative profits generated by all the industry's major products, and then we determine the cumulative profits earned by all the companies competing in the three industry activities. We choose prod- ucts and players for a simple reason: those are the ways financial data are typically reported in the industry. First, we examine products. We know that the consumer-financial- services industry, as we have defined it, has five major product categories: 154 HARVARD BUSINESS REVIEW May-June 1998 MANAGER'S TOOL KIT HOW TO MAP YOUR INDUSTRY'S PROFIT POOL credit cards, mortgages, deposits,
  • 31. mutual funds, and consumer loans. Sales and profitability data for each of these categories are reported regu- larly by the federal government as well as by private data-reporting companies, making data collection a simple exercise. Similarly, when we turn to the players, we know that companies in the industry are required to report their financial information in con- siderable detail. By looking at the largest players individually and ex- trapolating from a sample of the smaller players, we are able to quick- ly estimate total profits. Both meth- odologies yield a similar range of es- timates for the size of the profit pool-between $60 billion and $70 billion-so we are confident that we have a reliable estimate. Determine the distribution of profits. Now we have an estimate of the size of RegionBank's current in- dustry profit pool-in total and by product and player. What we don't have, however, is an understanding of how the pool is distributed among the three value-chain activities: ac- quisition, funding, and servicing. This leads to our first major analyti- cal problem. In consumer financial
  • 32. services, revenue and profit infor- mation simply isn't available for individual value-chain activities. Rather, as we saw before, financial information is organized by compa- ny and by product type. We will not, therefore, be able to measure value chain activities directly. Instead, we will have to construct five different profit pools-one for each major product category-and divide each pool into the three activities. We UNTANGLING THE CREDIT-CARD VALUE CHAIN The credit-card value chain encompasses three business activities. As a result of variations in the type of data available, the profits generated in each activity need to be calculated in very different ways. Acquisition Funding Servicing $80 value of a subscriber $ 6 4 *"°^'' °^ acquiring a subscriber average annual revenues per subscriber • $ 2 3 5 ^^^""^S^ annual costs per subscriber $ 6 0 ^ " i ^ " ^ ' payments
  • 33. to servicer per subscriber 1 7 average servicer margin acquisition profit per subscriber amortized average life of ^ % ^ subscriber account annual funding profit per subscriber $ 1 0 ^""'^^' servicing profit per subscriber $ 3 2 0 ^'^"'^^' acquisition profit per subscriber X 2 6 0 ^°^^' number of million subscribers X 260 million subscribers V 2 6 0 total number of million subscribers $800 million acquisition profits + $11.4 billion funding profits
  • 34. $2.6 .. ^ billion servicing profits total credit-card profits = $14.8 billion 156 HARVARD BUSINESS REVIEW May-June 1998 P E N N S T A T E E X E C U T I V E P R O G R A M S riic Smi;;il College ol" I^ll^iln:^^ Aditiiiu;,l[aLion TM IlLJIi OVER 4 0 YEARS OF EXECUTIVE EDUCATION General Management Programs Operations/Logistics/
  • 35. Purchasing Human Resources Programs Marketing Program Custom Programs TO RECEIVE PROGRAM INFORMATION, PLEASE CALL: Toll-free wilhin U.S.: (800) 31 l-63fi4 Oulsicic U.S.: (814) 865-3435 rilX. {ol^/ au^-jj iL E-Mail: [email protected] Web Silc: lillp://www,snical.psu.cdu/pscp A digital strategy is more than a business plan. In successful companies, it's the entire business. Unleashing the Killer App offers the first blueprint for designing, deveioping— and deploying—a digital
  • 36. strategy of your own. $24.95 At bookstones everywhere or call 1-888-500-1016 • 1-617-496-1449 Mention Ppiopity Code Z7G0 foraword by NicHoLas NegRopoNte unlaashing ths Killer App digital strategies for Market doninance LaRRy DOWNes CHUNka m u i H A R V A R D B U S i n J E S S S C H O O L P R E S S BOSTON, MA 0 2 1 B 3 w w w - k i l l Q r - a p p s . c o m will then be able to add up the aetiv- ity data for each product to gain an
  • 37. industrywide measure of activity profitability. For the sake of illustration, let's take one product-credit cards-and walk through the way we determine the distribution of its profit pool. We start by gathering profit and revenue data for all the key players in the credit card business: ĉard issuers^ subscriber and merchant acquirers, and customer and account servicers. Because RegionBank is itself an is- suer of credit cards, we can use our internal financial data as a bench- mark for credit eard profitability. Since there are literally thousands of credit card issuers, it would not he practicable to collect financial infor- mation on all of them. We therefore pursue an 80/20 approach, collecting data on all the major industry play- ers but analyzing only a sample of the smaller players. To ensure that we don't overlook any important competitors, we take the time to talk to people representing different aspects of the industry, including leading banks in overseas markets and companies in related industries such as home equity lending. We need to remember, as we pull to- gether the information, that compe- tition in our industry is shifting rapidly, with many kinds of new
  • 38. players entering the fray. As the strategic landscape evolves, new competitors and new services could present threats or opportunities to RegionBank. Failing to consider them now could be costly. Once we have profit data for all the relevant players in the credit card industry, we need to disaggre- gate the data hy value chain seg- ment. (See the chart "Untangling the Credit-Card Value Chain.") We use a different calculation method for each segment: • Seivicing. Because there are several large, public companies that special- ize in credit card servicing-pure players-servicing is the easiest of the three segments for which to esti- mate profits. So it's a good place to start. We know, from our own expe- rience as a card issuer, that a typical issuer pays approximately $60 per subscriber per year to third-party MANAGER'S TOOL KIT HOW TO MAP YOUR. INDUSTRY'S PROFIT POOL processors to handle transaction pro- cessing, statement generation, and all the other back-office tasks associ- ated with that subscriber. By study- ing the financial stateinents of the
  • 39. pure players, we find that their aver- age pretax margin for servicing is 17%, indicating that about $10 per year in servicing profits are generat- ed per subscriber ($60 x .17). Given the roughly 260 million credit-card subscribers in the United States, this works out to $2.6 billion in annual servicing profits. • Acquisition. There are no pure players in credit card acquisition, so we need to be a little more creative here. By examining recent purchases of credit-card-subscriber portfolios, we find that the price paid, per sub- scriber, is approximately $80. We also know, from our own experience and from general industry studies, that the average cost of gaining a new card subscriber is in the neigh- borhood of $64, which indicates that the acquisition profit per card is $16. Amortizing this figure over the aver- age life of a subscriber account (five years) yields $3.20 in annual acquisi- tion profits per subscriber, or $800 million for the entire credit-card business. • Funding. Finally, to estimate fund- ing profits, we detail all the revenues and costs associated with funding a credit c a r d - i n other words, we cre- ate a profit and loss statement for a card. The data required for this exer-
  • 40. cise are reported in the secondary markets where card portfolios are bought and sold. First, we add up all the annual revenues accruing to a typical card from interest, annual fees and other charges, and mer- chant payments ($279), and then we subtract all the costs associated with that card [$235), many of which, such as acquiring and servicing, we have already detailed. We arrive at an annual funding profit of $44 per subscriber, or $11.4 billion in total We now have categorized the credit card profit pool by value chain activ- ity: $800 million for acquisition, $11.4 billion for funding, and $2.6 billion for servicing. We make simi- lar calculations for each of the other four product categories-mortgages, deposits, m u t u a l funds, and con- REGIONBANK'S PROFIT-POOL MAP A profit-pool map compares a value chain activity's revenues with its profitability. By developing a map of the current U.S. consumer- financial-services industry, RegionBank is able to see the profits being generated by acquisition, funding, and servicing activities. By comparing this map with a map from an earlier point in time, the company will be able to spot trends in profit distribution. 20% —,
  • 41. acquisition funding share of industry revenue 100% servicing sumer loans-and we add up the to- tals to establish estimates for tbe size of each activity in t h e con- sumer-financial-services industry: $10.0 billion in acquisition, $42.4 billion in funding, and $10.4 billion in servicing. We now know the cur- rent shape of our profit pool. Reconcile the estimates. As a re- ality check, we add up the activity totals ($63 billion) and compare the suin with our initial estimate of the industry profit pool (between $60 billion and $70 billion). Tbe num- bers jibe, so we are confident that our estiinates arc reasonable. Visualizing the Profit Pool As the end product of profit-pool mapping-and the starting point of strategy d e v e l o p m e n t - you will want to portray the data you've col- lected in a series of charts. Visualiz- ing the profit pool makes it easier to spot areas of d i s p r o p o r t i o n a t e l y large and disproportionately small profits and to identify trends infiu-
  • 42. encing the distrihution of profits. The resulting insights can form the basis for the development of a strat- egy that will enable a company to capitalize on or even control the di- rection of profit-pool shifts. There are several different ways to chart a profit pool, each of which provides different insights. One of the simplest but most useful charts is what we call a profit-pool map, in which profit distribution is com- pared w i t h revenue distribution. (See the chart "RegionBank's Profit- Pool Map.") Tbe map takes the form of a series of building blocks-each representing a value chain activity- plotted on a graph. The horizontal axis of tbe graph represents the per- centage of industry revenues, and the vertical axis represents operat- ing margins. Thus the width of each block indicates the activity's share of total industry revenues, its height indicates the activity's profitability, and its area indicates the activity's total profits. The profit-pool map portrays the distribution of profits and revenues 160 HARVARD BUSINESS REVIEW May-fune 1998
  • 43. HOW TO MAP YOUR INDUSTRY'S PROFIT POOL MANAGER'S TOOL KIT along a single dimension: value chain activity. It will often be useful, however, to chart the profit pool along two dimensions simultane- ously. In RegionBank's case, for ex- ample, we know that many new players-product specialists, servic- ing specialists, and various other nontraditional competitors - have entered the industry in recent years. It would therefore be illuminating to see how industry profits are distrib- uted among different types of com- panies as well as among different value-chain activities. To visualize a profit pool in two dimensions, we can create a graph that we eall a profit-pool mosaic. [See the chart "RegionBank's Profit-Pool Mosaic") In a profit-pool mosaic, the total area of the chart equals ioo% of in- dustry profits [in RegionBank's case, $63 hillion). The horizontal axis in- dicates the percentage of total indus- try profits created in each activity- roughly 67% in funding, 17% in ser- vicing, and 16% in acquisition-and the vertical axis shows the percent- age of profits created by company
  • 44. type within an activity. (Depending on a company's partieular situation and challenges, other dimensions, such as products, channels, and geo- graphic regions, can he plotted in a mosaie.] By looking at the mosaic, we can see not only how much money is being made, activity by activity, but also who's making it. Profit-pool maps and mosaics are only snapshots, of course. They show us the shape of the pool as it exists today, hut they don't show us REGIONBANK'S PROFIT-POOL MOSAIC A profit-pool mosaic reveals the distribution of an industry's profits along two dimensions. RegionBank uses a mosaic to see the profits being earned by different types of companies within each of the three core value-chain activities in its industry. 100% 80 — 4g Q. 60 — 40 — 20 — other other other
  • 45. credit unions credit unions securities firms securities firms^ „ otherjoan specialist_s_ other specialists auto loan specialists credit card specialists deposit specialists other specialists mortgage specialists • mutual fund specialists deposit specialists )i-' mutual fund specialists mortgage specialists mutual fund specialists credit card specialists servicing specialists government-sponsored enterprises deposit specialists banks banks banks
  • 46. acquisition funding share of industry profits 100% servicing HAKVAKD BUSINESS REVIEW May-funcl998 161 MANAGER'S TOOL KIT HOW TO MAP YOUR INDUSTRY'S PROFIT POOL how the pool has been changing. To get a more dynamic view-which is essential for strategy development- we need to plot similar charts for the profit pool at earlier points in time. To develop such comparison charts, we go through the same steps of data collection and analysis; we just use data from an earlier year. By seeing how the pool's shape has changed- where profits have increased or di- minished, who's been gaining or los- ing profits - we can often infer which competitive, economic, and other forces have been shaping the indus- try's profit structure. In turn, we can project how these forces might reshape the pool in the future. It is often a useful exercise, in fact, to plot a projected profit pool. If your industry is stable, with no ma-
  • 47. jor uncertainties on the horizon, you will probably need to develop only a single view of the future, projecting future profit data based on current trends. If there's a lot of uncertainty in your industry, you should develop a range of possible views of t h e future. For instance, RegionBank m i g h t c r e a t e a series of m o s a i c charts representing different scenar- ios for how its industry might look in five years. Practically speaking, you won't be able to chart all the possible future permutations of a profit pool. We have found, though, that plotting three to five scenarios, representing a range of possibilities, is enough to provide valuable guid- ance in strategy development. A Foundation for Strategy Profit-pool mapping reveals the loca- tion and size of profit concentrations within an industry and sheds light on how those concentrations might shift. We have focused on analyzing the pool in terms of value chain ac- tivity. Knowing the distribution of profits along the value chain pro- vides you with the broadest view of profit trends in your industry. Such a view is essential for identifying structural shifts that could influ- ence the profits available to you and your competitors in the future. It is
  • 48. important to note, however, that profits concentrate not just in partic- ular value-chain activities but also in particular product types, cus- tomer segments, distribution chan- nels, and geographic regions. To develop the fullest possible under- standing of your profit pool, you will want to map the pool along some, if not all, of these dimensions as well. As even our simplified Region- Bank case i n d i c a t e s , profit-pool mapping often requires a consider- able investment of time. And, since every business situation is unique, tough questions about scope and methodology will need to be an- swered at every step of the analysis. But mapping your profit pool will provide you with important bene- fits. You'll gain a new store of strate- gic information and, even more im- portant, a more creative approach to strategy formulation. The sheer act of defining, catego- rizing, and mapping a pool can stir the thinking of your management team, leading it to challenge old as- sumptions and to generate valuable new business insights. When you de- fine the shape of today's profit pool, you refine and deepen your knowl- edge of the mechanics of your indus-
  • 49. t r y - w h e r e profits are created, how they're created, and who's creating them. And when you think through the forces shaping the pool, you identify and isolate the most critical drivers of future industry profitabil- ity. Ultimately, the discipline of profit-pool lnapping rewards you with a richer view of your business and where you might lead it. ^ Reprint 98306 To order reprints, see the last page ui this issue. "I dredged the pool and threw the nierniaids back into the Long Island Sound." 162 HARVARD BUSINESS REVIEW May-June 1998 Harvard Business Review Notice of Use Restrictions, May 2009 Harvard Business Review and Harvard Business Publishing Newsletter content on EBSCOhost is licensed for the private individual use of authorized EBSCOhost users. It is not intended for use as assigned course material in academic institutions nor as corporate learning or training materials in businesses. Academic licensees may not use this content in electronic reserves, electronic course packs, persistent linking from syllabi or by any
  • 50. other means of incorporating the content into course resources. Business licensees may not host this content on learning management systems or use persistent linking or other means to incorporate the content into learning management systems. Harvard Business Publishing will be pleased to grant permission to make this content available through such means. For rates and permission, contact [email protected]