SlideShare a Scribd company logo
1 of 10
Download to read offline
Detection and Classification
of Intracranial Brain Hemorrhage
K. V. Sharada, Vempaty Prashanthi, and Srinivas Kanakala
Abstract Computer
-aided diagnosis systems (CAD), as their name suggests, utilize computers to
assist doctors to obtain a quick and correct diagnosis. They focused on several
scholars as they are built upon the concept of processing and examining pictures
of various parts of the individual body meant for a fast and correct outcome. CAD
systems are generally area specific because they are augmented for some certain
kinds of infections, various parts of the individual body, diagnosis methods, etc.
They analyze dissimilar types of inputs given, for example, signs, test center, result,
health pictures, etc. varying on their territory. One of the maximum common kind of
diagnosis depends on medical pictures. Our approach is to develop a model to identify
either a brain hemorrhage is present or not in Computed Topography (CT) scan of the
brain and also identify the kind of hemorrhage. The process of detecting and iden-
tifying hemorrhage contains many steps like image pre-processing, segmentation of
image, extracting the features, and classifying the images.
Keywords CT scan · Brain haemorrhage · Image processing · Image segmentation
1 Introduction
Brain hemorrhage implies blood loss within brain. In brief, one quite stroke which
causes draining round the tissues by an artery within the cerebrum is observed as
brain hemorrhage. Draining can happen in between the cerebrum and also the layers
that cover it. The irritation that is caused by the blood from trauma leads to increase of
pressure on brain tissues; this results in reduced percentage of oxygen from reaching
the brain cells. This brain hemorrhage is observed as medical emergency which
needs prompt treatment. There are several factors which might cause or result in
K. V. Sharada · V. Prashanthi (B)
Gokaraju Rangaraju Institute of Engineering and Technology, Hyderabad, India
S. Kanakala
VNR Vignana Jyothi Institute of Engineering and Technology, Hyderabad, India
© The Author(s), under exclusive license to Springer Nature Singapore Pte Ltd. 2022
P. Nayak et al. (eds.), IoT and Analytics for Sensor Networks, Lecture Notes in Networks
and Systems 244, https://doi.org/10.1007/978-981-16-2919-8_41
455
456 K. V. Sharada et al.
cerebral hemorrhage. These components include head injury, blood vessel anoma-
lies, liver disease, brain tumour, extreme high blood pressure, bleeding disorders, and
utilization of illegal medications. Anomalies within the blood vessels are the most
explanation in the majority of the intracerebral hemorrhages that out of nowhere
happen in youngsters, anyway there could be other potential causes which incorpo-
rate blood sicknesses, cerebrum tumors, septicemia, or the work of liquor or illegal
medications. Many people who experience a hemorrhage have side effects as though
they are having a stroke and can create weakness on one side of their body or a feeling
of numbness. Sometimes brain hemorrhage can cause a scope of various indications
like sudden, serious migraine, difficulty in gulping, vision problems, loss of coordi-
nation with the body, confusion or trouble in understanding, difficulty in talking or
stammering discourse, seizures, torpidity or stupor.
Brain hemorrhage often leads to several complications. Because of the draining
nerve cells one cannot speak with different pieces of the body and in this manner stops
ordinary working. Additionally, there are scarcely any basic issues that emerge after a
brain discharge which incorporates development, discourse, or memory issues. A few
difficulties might be lasting relying upon the area of drain and the harm that happens.
These intricacies may incorporate—loss of motion, vision misfortune, and decreased
capacity to talk or get words, disarray, or memory misfortune. These complications
made brain hemorrhage an emergency condition that requires immediate treatment.
Diagnosing a brain drain could be troublesome as certain individuals do not give any
physical indications. Specialists need to do take the assistance of a CT scan or MRI
scan so as to locate the specific area of the seeping in the mind. CT pictures are known
to claim numerous points of interest over MRI. Along these lines, the standard of
CT pictures is sufficiently high to precisely analyse Intracranial Brain Hemorrhage.
PC supported determination frameworks (CAD), as their name proposes, use PCs
to assist specialists with arriving at a quick and exact conclusion. They have been
the focal point of numerous scientists since they depend on preparing and examining
pictures of various pieces of the human body for brisk and exact outcomes. Computer
aided design frameworks are normally area explicit as they are advanced for certain
particular sorts of infections, portions of the body, analysis techniques, and so on.
They investigate various assortments of information, for example, manifestations,
research facility test results, clinical pictures, and so on depending on their space.
One of the most generally perceived sorts of determination is the one that depends
on clinical pictures. Such frameworks are helpful on the grounds that they can be
incorporated with the product of the clinical imaging machine so as to deliver a
brisk and precise finding. Then again, they can be trying since they consolidate the
components of man-made reasoning and advanced picture preparing (Fig. 1).
The rest of the paper is organized as follows: In Session 2 Literature survey
is discussed, in Session 3 proposed system is described, Session 4 describes the
implementation, Session 5 explains the experimentation and results and finally in
Session 6 conclusion is given of our main proceedings series.
Detection and Classification of Intracranial Brain Hemorrhage 457
Fig. 1 CT scan images of five types of brain hemorrhages
2 Literature Survey
Thepaper[1]mainlydiscussedthepre-segmentationprocess.Inthisthetechniquesof
dividingtheinputimageintofourquadrantsusingthemethodofsplittingandmerging
are used. This is called as pre-segmentation of imaging. The pre-segmentation can
be done with the following methods: (1) Thresholding: in thresholding the pixels
of the input image is given certain threshold values and those pixels are mapped to
related areas. (2) Region growing technique. (3) Supervised segmentation methods
and unsupervised segmentation methods. Process of segmentation is as follows: as
a first step the image is split into quadrants. Then histogram and pixel values are
computed for each quadrant separately. The succeeding process for the above step is
comparing each histogram value and pixel value with the predefined threshold criteria
(or) histogram, pixel values. The final step is taking only the region of abnormality
that is detected and feeding this as input to the segmentation process.
In [2] the method includes a combination of the machine with knowledge
discovery techniques. During a CT scan the Intracranial pixel depth is noted. Based
on the depth the pixel intensities are normalized using depth-dependent gray level
normalization and the dense area of the intracranial region is segmented with the
process of region growing and multi-resolution thresholding. The succeeding step
is the construction of the decision tree by applying the algorithm. The first step in
the method is pre-processing, and it involves the separation of pixels containing
the extracranial part and the skull (intracranial pixels). This is used for recognition,
measurement, and classification of a hematoma. In the next step the optimal threshold
is chosen for hematoma segmentation by human experts and this differs from case to
case which leads to instability. In the succeeding step the identification of the largest
area containing Intracranial hematoma is done by considering the largest connected
hyperdense region and excluding other smaller hyperdense regions. The final step is
the construction of a decision tree using algorithm. Limitations: there is difficulty in
recognizing subdural and epidural hematomas.
In [3] there is much focus on Cerebral Ischemia and had been said that if cerebral
ischemia developed once there might not be a successful or complete cure for the
abnormality. The method involved is based on the average thickness of the blood
layer and based on thickness, and it is divided into grades such as good, recovery,
458 K. V. Sharada et al.
dead scaling them as 1, 2, and 3. Computed Tomography (CT) scanned images are
given as input to the process. It is described in this process that a thick localized
subarachnoid layer of blood or diffusion of blood might lead to delayed cerebral
ischemia. This method only focuses on Cerebral Ischemia.
In [4] there is an automatic classification of images into two classes based on
features. The two classes are abnormal and normal. This classification involves four
phases. Pre-process includes the separation of pixels containing the extracranial part
and intracranial part. In feature extraction the original dataset is restricted, and these
extracted features serve as training data and saved into feature library. Next, they
applied the SVM classifier and KNN classifier. While performing this method it was
observed that the K-Nearest Neighbors classifier yielded better results in comparison
withtheSVMclassifier.Thepostprocessingstepisperformedafterimageisclassified
as abnormal. In the post-processing step the image of the skull is removed and then
the abnormal region is extracted. Generally, for removing skull we use brightest pixel
cells as the brain matter appears in grey color. This approach categorizes only two
classes (abnormal and normal) and gives generic results without any specific label.
In [5, 6] the cerebral microbleed is visualized by using susceptibility-weighted
imaging (SWI). Here depending on susceptibility-weighted imaging they constructed
rank based average pooling to identify cerebral microbleed. For detection of cerebral
microbleed, Convolutional Neural Network is used which contains multiple layers.
ReLU layer is used to map the convolution layer with SoftMax activation, tangent
activation and Rectified linear unit activation. It is more effective than the convolu-
tion layer. So, it is more popular. The convolutional layer may have a greater number
of elements in the feature set which will lead to dimension disaster termed as overfit-
ting. In this situation pooling plays a major role that replaces the clusters of related
elements in the feature set with statistic summary value. This is done using a pooling
function. The last advance is rank-based normal pooling which incorporates a normal
of non-zero negative actuations. Rank-based normal pooling can beat the issue of
loss of helpful data which is brought about by normal pooling and most extreme
pooling. This is a very complex method and has a computational burden.
In [7] the method proposed is a densely connected neural network which is called
densenet. To detect cerebral microbleeds the algorithm used is densenet. A sliding
window is utilized to cover the arrangement of unique pictures from left to right and
throughandthrough.Theobjectiveworthischosendependentonthefocalpixelofthe
sub models. Later the cost matrix will be employed, based on the comparison between
the entries in the cost matrix and target value final abnormality region is detected.
Following are the steps included in this algorithm: (1) Traditional Convolutional
Neural Network: the layer age of straight enactment, the capacity is done by means
of convolutions [8]. The following layer, for example, ReLU layer, is utilized to
outline convolution layer with SoftMax enactment, digression actuation, Rectified
straight unit initiation, and so on. It is more effective than the convolution layer.
So, it is more popular. (2) Densenet: It is used to establish connections between
layers. These connections are used for feature maps. The layers that are between the
blocks are called transition layers. Each layer receives information from its previous
layer. (3) Transfer learning: it is based on fully convolutional multiscale residual
Detection and Classification of Intracranial Brain Hemorrhage 459
densenets. It considers the labeled samples to get high classification accuracy. It is
meant to retrain the later layers of densenet. The usage of this transfer learning leads
to an increase in accuracy rate.
In [9, 10] a complete CNN is trained with computed tomography (CT) scans. The
algorithm resulted in high accuracy for the detection of acute Intracranial Hemor-
rhage. This algorithm has shown more accurate results than the measurements that
are calculated by 2–4 radiologists.
The method used in [11, 12] is 3D quantitative analysis which performs 3D
measurements of the parameters of the Intracerebral Brain Hemorrhage region based
on computed tomography (CT) images. This resultant data is correlated with patient
mortality. The image segmentation in this is done using a clustering algorithm whose
strategy is based on fuzzy c-means which minimizes the objective function that repre-
sents the distance of feature vectors from the cluster centers. Based on the features of
the clusters rule-based labelling is done whose components include fact-list, knowl-
edgebase (or) rule-base, and inference engine. The labelling is done on the area, the
color of the region. This is taken as input for the final step. This method not always
perform correct segmentation.
In [13–15] the first step is pre-processing which includes division of the image
into four quadrants called segmentation. Pre-processing is done using a tracking
algorithm to separate skull images from the Gray dura matter in the CT scan image.
Among these four regions the most vulnerable region which has the possibility of
abnormality is considered and remaining regions are excluded. The next step is
a grouping of all the identical homogenous regions to point out the abnormality.
Following are the segmentation methods that are used: (1) Thresholding: it compares
the pixel values with the threshold values. (2) Region growing techniques: it extracts
useful or connected regions. (3) Supervised and unsupervised method: in this method
there is the segmentation of the image in the training stage. Compared to supervised,
unsupervised is efficient and less error sensitive. This method is not fully automatic.
It requires a lot of human intervention.
3 Proposed Method
The proposed method includes CT scan images as the input datasets. Initially CT
Scan images are converted into the format that a network/model can take as input.
Images are converted into jpeg format. Later the images are processed so as to analyze
the images accurately. Otsu’s strategy is utilized with the end goal of segmentation.
In general, it is a method to segment an advanced picture into numerous regions
bolstered a few rules like arrangements of pixels, and so forth. Noise and unwanted
pixels from the image are removed such as the skull part of the image which is of high
intensity. The objective of the segment is to disentangle a picture to be increasingly
significant and simpler to examine. Numerous methodologies for division exist, for
example, thresholding and grouping. This stage sections the cerebrum picture into a
few locales with the goal that we can segregate the ROI (the drain district). The result
460 K. V. Sharada et al.
of this stage is regularly used to distinguish the presence of hemorrhages with most
extreme exactness. Later classification of images is done using the Weka tool. Otsu’s
method of segmentation also minimizes the within-class variance of the system by
finding a threshold value automatically based upon the pixel values, probability
values of a segment. Morphological operations and region growing techniques can
be used to obtain further improvements on the segmented image and finally most
filtered part of ROI is obtained and features like the area of ROI, the axis of ROI,
the circumference of ROI, distance between skull and ROI are extracted, and they
are fed into a neural network through a feature vector pattern. For the extraction
of features accurately Region props tool of MATLAB is used. For the purpose of
classification between various types of hemorrhages the shape of ROI plays a major
role generally for Epidural and Intraparenchymal hemorrhages, there is a convex hull
that is present in the region of Interest whereas for subdural hemorrhage it is concave
in shape. The Region surrounding the ROI is called Bounding Box, which also plays
an important role to extract features of region of interest (ROI). The extracted features
from ROI will be stored as input to train the model. The kind of hemorrhage is then
recognized based on the neural network which is trained. Once the set of input and
output images are saved at that instance then there will be a saved network which is
called a Network file. Later working of a network file is determined using a training
percentage method.
3.1 Preprocessing
Preprocessing is the beginning step of the method that involves removal of high
intensity pixel part of the image such as the skull part and removal of noise. Later the
image is segmented into parts so that it becomes easy for the purpose of analyzing
and it is done by the OTSU’S method which has 100% of accuracy and clustering of
segments with similar properties is made so that identification abnormalities become
easy.
3.2 Segmentation
Segmentation step is continued by the feature extraction step which is main step
to group segments with similar properties together and then later feed into a neural
network. The pixel intensity of the brightest part of the skull is about 250 pixels, and it
must be removed in order to identify the part that has abnormality. It is done through
MATLAB. Image based cad system is used for the purpose of image segmentation.
Later based on the properties of segmented part the type of hemorrhage is detected
using a classifier algorithm (Type detection algorithm).
Type Detection Algorithm (Segmentation)
Detection and Classification of Intracranial Brain Hemorrhage 461
1: BTD (Ss, p, q, Cc, W)  Ss CT scan Data set. n count of feature. C classifier
W is vector.
2: Dd ← BUILDDATASET1 (Ss, p, q)
3: for c ∈ Cc do
4: Acu ← TESTINCLASSIFIER (Dd, c, wc)
5: end for
6: return c Acu
7: end
8: BUILDDATASET1 (Ss, p, q)  Ss Scan Dataset. n count of feature
9: Assign Dd to empty
10: for j ← 0,9 do
11: tt ← EXTRACINTFEATURE (j, n)
12: add tt to the end of Dd
13: end for
14: return Dd
15: end
16: EXTRACTINFEATURE (j, n)  i brains CT scan
17: j is ≥ 251, j = 0; Apply steps 18 to 23
18: perform Otsu j
19: morphological j
20: regions growing j
21: region props
22: classifier
23: return vi
24: end
25: TESTINCLASSIFIER (Dd, c, wc)
26: partition Dd into 10 subset: Dd0..Dd9
27: for k ← 0,9 do
28: Ta ← Dk
29: Tb ← Sk = 0,…,9
30: calculate accuracy
31: return avg of Aj’s for j = 0 to 9
32: end for
33: end procedure.
3.3 Morphological Techniques
The followings are the morphological techniques used Opening-by-remaking, shut-
ting by-remaking, Supplement picture, Compute territorial maxima, Superimpose the
picture, Process Background Markers, Watershed Transformation and the Segmen-
tation, Imagine the Result, Evacuate Background Noise. Morphological operations
basically remove the background and then dilates the inner segment region. An image
462 K. V. Sharada et al.
Fig. 2 Haemorrhagic region after applying segmentation and pre-processing techniques
containing potential regions with suspicious mass is the result of morphological
operations.
3.4 Obtaining Region of Interest
Figure 2 highlighted images that indicate the hemorrhagic region after applying
segmentation and pre-processing techniques. Region growing starts from a single
point and then expand from that point by finding the region that is similar to that
of the seed region. At the end of this step ‘Region of Interest’ is obtained which
is utilized as contribution for ‘Neural Network’ and furthermore as training set.
ROI is very crucial for the success of the proposed system. Resultant image after
applying region growing techniques will be blank for normal brain image, whereas
there will be some portion of image existing for brain image in abnormal condition
after application of region growing technique.
4 Experimentation and Results
Experiments were done by changing the parameters given to the model: changing the
way the data was split was tried by toggling the value of the shuffle argument—True
or False as shown in Fig. 3. The change has not got any specific modifications to
the output of the model. This has happened as little number of samples was utilized
for performing segmentation. Next by changing the image size to 256X256 and the
batch size to 64, the training process a lot more slower compared to when the values
were set to 128 × 128 and 32 which trained the model approximately in 25 min.
The training loss for the 256 × 256 images started learning later because the batch
Detection and Classification of Intracranial Brain Hemorrhage 463
Fig. 3 (a) Loss vs Epoch: for 256X256 image size (b) Loss vs Epoch: for 128X128 image size
size was doubled and further we think it did not reach it. The model trained on 50
epochs but could have been appropriately trained for less number of epochs. This
experiment mainly focused on segmentation of the data and localizing the affected
area.
5 Conclusion
Automated frameworks for grouping medical images have increased a phenomenal
degree of consideration recently. It has considerable impact in recognizing the exis-
tence of cerebral hemorrhage (the paired characterization issue) and in the event
that it exists classification of hemorrhage is done and also problem of multiclass
is also resolved. Although there are some algorithms which detect the hemorrhage
efficiently and produce reasonable results, they are having few limitations like few
algorithms find it difficult in recognizing subdural and epidural hematomas, few of
them cannot detect subarachnoid hemorrhage, few consume more power and some
are not suitable for large datasets, having longer computation time. Main cause for
these limitations is existence of standardized procedures in less numbers. Since the
diagnosis of Brain Hemorrhage is the very complicative and sensitive task, accuracy
and reliability are given much priority. The investigations indicate that later pre-
handling CT Scans, the double arrangement issue untraveled with 100% exactness.
Additionally, the actualized framework accomplished over 92% exactness for the
order issue of deciding the discharge type utilizing convolutional neural systems as a
classifier. The outcomes are truly promising and more elevated levels of exactness for
the characterization issue will be accomplished by getting a vastly improved dataset
with high-level goals pictures held legitimately from the CT scanner. Also, unique
element extraction and highlight choice procedures could be utilized to improve the
presentation of the framework.
464 K. V. Sharada et al.
References
1. Li, Y., Hu, Q., Wu, J.,  Chen, Z. (2009). A hybrid approach to detection of brain hemorrhage
candidates from clinical head ct scans. In 2009 Sixth International Conference on Fuzzy Systems
and Knowledge Discovery. vol. 1. IEEE.
2. Liao, CC., Xiao, F., Wong, J. M.,  Chiang, I. J. (2008). A knowledge discovery approach to
diagnosing intracranial hematomas on brain CT: recognition, measurement and classification.
In International conference on medical biometrics. Berlin, Heidelberg, Springer.
3. Bhadauria, H. S.,  Dewal, M. L. (2014). Intracranial hemorrhage detection using spatial
fuzzy c-mean and region-based active contour on brain CT imaging. Signal, Image and Video
Processing, 8(2), 357–364.
4. Mohsen, F., Pomonis, S.,  Illingworth, R. (1984). Prediction of delayed cerebral ischaemia
aftersubarachnoidhaemorrhagebycomputedtomography.JournalofNeurology,Neurosurgery
 Psychiatry, 47(11), 1197–1202.
5. Kyaw, M. M. (2013). Pre-segmentation for the computer aided diagnosis system. International
Journal of Computer Science  Information Technology, 5(1), 79.
6. Dou, Q., Chen, H., Yu, L., Zhao, L., Qin, J., Wang, D.,  Heng, P. A. (2016). Automatic
detection of cerebral microbleeds from MR images via 3D convolutional neural networks.
IEEE transactions on medical imaging, 35(5), 1182–1195.
7. Ramteke, R. J.,  Monali, K. Y. (2012). Automatic medical image classification and abnor-
mality detection k-nearest neighbour. International Journal of Advanced Computer Research
2(4), 190–196.
8. Wang, S., Jiang, Y., Hou, X., Cheng, H.,  Du, S. (2017). Cerebral micro-bleed detection
based on the convolution neural network with rank based average pooling. IEEE Access, 5,
16576–16583.
9. Kuo, W., Häne, C., Mukherjee, P., Malik, J.,  Yuh, E. L. (2019). Expert-level detection of
acute intracranial hemorrhage on head computed tomography using deep learning. Proceedings
of the National Academy of Sciences, 116(45), 22737–22745
10. Loncaric, S., Dhawan, A. P., Cosic, D., Kovacevic, D., Broderick, J.,  Brott, T. (1999). Quan-
titative intracerebral brain hemorrhage analysis. In Medical Imaging 1999: Image Processing
(Vol. 3661). International Society for Optics and Photonics.
11. Kyaw, M. M. (2013). Computer-Aided Detection system for Hemorrhage contained region.
International Journal of Computational Science and Information Technology, 11–16.
12. Magoulas, G. D.,  Prentza, A. (1999). Machine learning in medical applications. In Advanced
course on artificial intelligence. Berlin, Heidelberg, Springer.
13. Prashanthi, V.,  Srinivas, K. (2020). Plant disease detection using convolutional neural
networks. International Journal of Advanced Trends in Computer Science and Engineering,
9(3), 2632–2637.
14. Hayward, R. D. (1977). Subarachnoid haemorrhage of unknown aetiology: A clinical and
radiological study of 51 cases. Journal of Neurology, Neurosurgery  Psychiatry, 40(9), 926–
931.
15. Prashanthi, V.,  Srinivas, K., Generating analytics from web log. International Journal of
Engineering and Advanced Technology, 9(4), 161–165.

More Related Content

Similar to griet paper pblished(13-9-2021).pdf

Human recognition system based on retina vascular network characteristics
Human recognition system based on retina vascular network characteristicsHuman recognition system based on retina vascular network characteristics
Human recognition system based on retina vascular network characteristics
cbnaikodi
 
A Wavelet Based Automatic Segmentation of Brain Tumor in CT Images Using Opti...
A Wavelet Based Automatic Segmentation of Brain Tumor in CT Images Using Opti...A Wavelet Based Automatic Segmentation of Brain Tumor in CT Images Using Opti...
A Wavelet Based Automatic Segmentation of Brain Tumor in CT Images Using Opti...
CSCJournals
 

Similar to griet paper pblished(13-9-2021).pdf (20)

Exploring Deep Learning-based Segmentation Techniques for Brain Structures in...
Exploring Deep Learning-based Segmentation Techniques for Brain Structures in...Exploring Deep Learning-based Segmentation Techniques for Brain Structures in...
Exploring Deep Learning-based Segmentation Techniques for Brain Structures in...
 
IRJET- Brain Tumor Detection using Convolutional Neural Network
IRJET- Brain Tumor Detection using Convolutional Neural NetworkIRJET- Brain Tumor Detection using Convolutional Neural Network
IRJET- Brain Tumor Detection using Convolutional Neural Network
 
Automatic brain tumor detection using adaptive region growing with thresholdi...
Automatic brain tumor detection using adaptive region growing with thresholdi...Automatic brain tumor detection using adaptive region growing with thresholdi...
Automatic brain tumor detection using adaptive region growing with thresholdi...
 
Overview of convolutional neural networks architectures for brain tumor segm...
Overview of convolutional neural networks architectures for  brain tumor segm...Overview of convolutional neural networks architectures for  brain tumor segm...
Overview of convolutional neural networks architectures for brain tumor segm...
 
BRAIN TUMOR DETECTION
BRAIN TUMOR DETECTIONBRAIN TUMOR DETECTION
BRAIN TUMOR DETECTION
 
BRAIN TUMOR DETECTION USING CNN & ML TECHNIQUES
BRAIN TUMOR DETECTION USING CNN & ML TECHNIQUESBRAIN TUMOR DETECTION USING CNN & ML TECHNIQUES
BRAIN TUMOR DETECTION USING CNN & ML TECHNIQUES
 
An automated system for classifying types of cerebral hemorrhage based on ima...
An automated system for classifying types of cerebral hemorrhage based on ima...An automated system for classifying types of cerebral hemorrhage based on ima...
An automated system for classifying types of cerebral hemorrhage based on ima...
 
IRJET- Machine Learning Techniques for Brain Stroke using MRI
IRJET-  	  Machine Learning Techniques for Brain Stroke using MRIIRJET-  	  Machine Learning Techniques for Brain Stroke using MRI
IRJET- Machine Learning Techniques for Brain Stroke using MRI
 
Human recognition system based on retina vascular network characteristics
Human recognition system based on retina vascular network characteristicsHuman recognition system based on retina vascular network characteristics
Human recognition system based on retina vascular network characteristics
 
IRJET- Brain Tumor Detection and Classification with Feed Forward Back Propag...
IRJET- Brain Tumor Detection and Classification with Feed Forward Back Propag...IRJET- Brain Tumor Detection and Classification with Feed Forward Back Propag...
IRJET- Brain Tumor Detection and Classification with Feed Forward Back Propag...
 
An Approach for Study and Analysis of Brain Tumor Using Soft Approach
An Approach for Study and Analysis of Brain Tumor Using Soft ApproachAn Approach for Study and Analysis of Brain Tumor Using Soft Approach
An Approach for Study and Analysis of Brain Tumor Using Soft Approach
 
A Wavelet Based Automatic Segmentation of Brain Tumor in CT Images Using Opti...
A Wavelet Based Automatic Segmentation of Brain Tumor in CT Images Using Opti...A Wavelet Based Automatic Segmentation of Brain Tumor in CT Images Using Opti...
A Wavelet Based Automatic Segmentation of Brain Tumor in CT Images Using Opti...
 
A Survey On Brain Tumor Detection Techniques
A Survey On Brain Tumor Detection TechniquesA Survey On Brain Tumor Detection Techniques
A Survey On Brain Tumor Detection Techniques
 
PHONOCARDIOGRAM HEART SOUND SIGNAL CLASSIFICATION USING DEEP LEARNING TECHNIQUE
PHONOCARDIOGRAM HEART SOUND SIGNAL CLASSIFICATION USING DEEP LEARNING TECHNIQUEPHONOCARDIOGRAM HEART SOUND SIGNAL CLASSIFICATION USING DEEP LEARNING TECHNIQUE
PHONOCARDIOGRAM HEART SOUND SIGNAL CLASSIFICATION USING DEEP LEARNING TECHNIQUE
 
Brain Abnormality Categorization
Brain Abnormality CategorizationBrain Abnormality Categorization
Brain Abnormality Categorization
 
Survey on “Brain Tumor Detection Using Deep Learning
Survey on “Brain Tumor Detection Using Deep LearningSurvey on “Brain Tumor Detection Using Deep Learning
Survey on “Brain Tumor Detection Using Deep Learning
 
AUTOMATED SEGMENTATION OF FLUORESCENT AND FUNDS IMAGES BASED ON RETINAL BLOOD...
AUTOMATED SEGMENTATION OF FLUORESCENT AND FUNDS IMAGES BASED ON RETINAL BLOOD...AUTOMATED SEGMENTATION OF FLUORESCENT AND FUNDS IMAGES BASED ON RETINAL BLOOD...
AUTOMATED SEGMENTATION OF FLUORESCENT AND FUNDS IMAGES BASED ON RETINAL BLOOD...
 
AUTOMATED SEGMENTATION OF FLUORESCENT AND FUNDS IMAGES BASED ON RETINAL BLOOD...
AUTOMATED SEGMENTATION OF FLUORESCENT AND FUNDS IMAGES BASED ON RETINAL BLOOD...AUTOMATED SEGMENTATION OF FLUORESCENT AND FUNDS IMAGES BASED ON RETINAL BLOOD...
AUTOMATED SEGMENTATION OF FLUORESCENT AND FUNDS IMAGES BASED ON RETINAL BLOOD...
 
A modified residual network for detection and classification of Alzheimer’s ...
A modified residual network for detection and classification of  Alzheimer’s ...A modified residual network for detection and classification of  Alzheimer’s ...
A modified residual network for detection and classification of Alzheimer’s ...
 
MH_Report
MH_ReportMH_Report
MH_Report
 

More from Srinivas Kanakala (13)

FLOWCHARTS.pptx
FLOWCHARTS.pptxFLOWCHARTS.pptx
FLOWCHARTS.pptx
 
Minor project ppt (1).pptx
Minor project ppt (1).pptxMinor project ppt (1).pptx
Minor project ppt (1).pptx
 
system hacking.pptx
system hacking.pptxsystem hacking.pptx
system hacking.pptx
 
RDBMS WIT &WIL.pptx
RDBMS WIT &WIL.pptxRDBMS WIT &WIL.pptx
RDBMS WIT &WIL.pptx
 
UNIT-1-SQE-Dr.K.Srinivas-CSE.pptx
UNIT-1-SQE-Dr.K.Srinivas-CSE.pptxUNIT-1-SQE-Dr.K.Srinivas-CSE.pptx
UNIT-1-SQE-Dr.K.Srinivas-CSE.pptx
 
JAVA PROGRAMMING (1).pptx
JAVA PROGRAMMING (1).pptxJAVA PROGRAMMING (1).pptx
JAVA PROGRAMMING (1).pptx
 
InTERNET Border patrol.pptx
InTERNET Border patrol.pptxInTERNET Border patrol.pptx
InTERNET Border patrol.pptx
 
BHARADWAJ.pptx
BHARADWAJ.pptxBHARADWAJ.pptx
BHARADWAJ.pptx
 
unit-1.pptx
unit-1.pptxunit-1.pptx
unit-1.pptx
 
vaagdevi paper.pdf
vaagdevi paper.pdfvaagdevi paper.pdf
vaagdevi paper.pdf
 
ijatcse21932020.pdf
ijatcse21932020.pdfijatcse21932020.pdf
ijatcse21932020.pdf
 
Turkey music( june 2021).pdf
Turkey music( june 2021).pdfTurkey music( june 2021).pdf
Turkey music( june 2021).pdf
 
patent_vpr.pdf
patent_vpr.pdfpatent_vpr.pdf
patent_vpr.pdf
 

Recently uploaded

Proofreading- Basics to Artificial Intelligence Integration - Presentation:Sl...
Proofreading- Basics to Artificial Intelligence Integration - Presentation:Sl...Proofreading- Basics to Artificial Intelligence Integration - Presentation:Sl...
Proofreading- Basics to Artificial Intelligence Integration - Presentation:Sl...
David Celestin
 
Artificial_intelligence_in_cctv_survelliance FINAL.pptx
Artificial_intelligence_in_cctv_survelliance FINAL.pptxArtificial_intelligence_in_cctv_survelliance FINAL.pptx
Artificial_intelligence_in_cctv_survelliance FINAL.pptx
hariprasad279825
 
Unlocking Exploration: Self-Motivated Agents Thrive on Memory-Driven Curiosity
Unlocking Exploration: Self-Motivated Agents Thrive on Memory-Driven CuriosityUnlocking Exploration: Self-Motivated Agents Thrive on Memory-Driven Curiosity
Unlocking Exploration: Self-Motivated Agents Thrive on Memory-Driven Curiosity
Hung Le
 

Recently uploaded (20)

Digital collaboration with Microsoft 365 as extension of Drupal
Digital collaboration with Microsoft 365 as extension of DrupalDigital collaboration with Microsoft 365 as extension of Drupal
Digital collaboration with Microsoft 365 as extension of Drupal
 
2024 mega trends for the digital workplace - FINAL.pdf
2024 mega trends for the digital workplace - FINAL.pdf2024 mega trends for the digital workplace - FINAL.pdf
2024 mega trends for the digital workplace - FINAL.pdf
 
History of Morena Moshoeshoe birth death
History of Morena Moshoeshoe birth deathHistory of Morena Moshoeshoe birth death
History of Morena Moshoeshoe birth death
 
LITTLE ABOUT LESOTHO FROM THE TIME MOSHOESHOE THE FIRST WAS BORN
LITTLE ABOUT LESOTHO FROM THE TIME MOSHOESHOE THE FIRST WAS BORNLITTLE ABOUT LESOTHO FROM THE TIME MOSHOESHOE THE FIRST WAS BORN
LITTLE ABOUT LESOTHO FROM THE TIME MOSHOESHOE THE FIRST WAS BORN
 
"I hear you": Moving beyond empathy in UXR
"I hear you": Moving beyond empathy in UXR"I hear you": Moving beyond empathy in UXR
"I hear you": Moving beyond empathy in UXR
 
Abortion Pills Fahaheel ௹+918133066128💬@ Safe and Effective Mifepristion and ...
Abortion Pills Fahaheel ௹+918133066128💬@ Safe and Effective Mifepristion and ...Abortion Pills Fahaheel ௹+918133066128💬@ Safe and Effective Mifepristion and ...
Abortion Pills Fahaheel ௹+918133066128💬@ Safe and Effective Mifepristion and ...
 
BIG DEVELOPMENTS IN LESOTHO(DAMS & MINES
BIG DEVELOPMENTS IN LESOTHO(DAMS & MINESBIG DEVELOPMENTS IN LESOTHO(DAMS & MINES
BIG DEVELOPMENTS IN LESOTHO(DAMS & MINES
 
Proofreading- Basics to Artificial Intelligence Integration - Presentation:Sl...
Proofreading- Basics to Artificial Intelligence Integration - Presentation:Sl...Proofreading- Basics to Artificial Intelligence Integration - Presentation:Sl...
Proofreading- Basics to Artificial Intelligence Integration - Presentation:Sl...
 
Using AI to boost productivity for developers
Using AI to boost productivity for developersUsing AI to boost productivity for developers
Using AI to boost productivity for developers
 
STM valmiusseminaari 26-04-2024 PUUMALAINEN Ajankohtaista kansainvälisestä yh...
STM valmiusseminaari 26-04-2024 PUUMALAINEN Ajankohtaista kansainvälisestä yh...STM valmiusseminaari 26-04-2024 PUUMALAINEN Ajankohtaista kansainvälisestä yh...
STM valmiusseminaari 26-04-2024 PUUMALAINEN Ajankohtaista kansainvälisestä yh...
 
SOLID WASTE MANAGEMENT SYSTEM OF FENI PAURASHAVA, BANGLADESH.pdf
SOLID WASTE MANAGEMENT SYSTEM OF FENI PAURASHAVA, BANGLADESH.pdfSOLID WASTE MANAGEMENT SYSTEM OF FENI PAURASHAVA, BANGLADESH.pdf
SOLID WASTE MANAGEMENT SYSTEM OF FENI PAURASHAVA, BANGLADESH.pdf
 
Artificial_intelligence_in_cctv_survelliance FINAL.pptx
Artificial_intelligence_in_cctv_survelliance FINAL.pptxArtificial_intelligence_in_cctv_survelliance FINAL.pptx
Artificial_intelligence_in_cctv_survelliance FINAL.pptx
 
BEAUTIFUL PLACES TO VISIT IN LESOTHO.pptx
BEAUTIFUL PLACES TO VISIT IN LESOTHO.pptxBEAUTIFUL PLACES TO VISIT IN LESOTHO.pptx
BEAUTIFUL PLACES TO VISIT IN LESOTHO.pptx
 
Introduction to Artificial intelligence.
Introduction to Artificial intelligence.Introduction to Artificial intelligence.
Introduction to Artificial intelligence.
 
Ready Set Go Children Sermon about Mark 16:15-20
Ready Set Go Children Sermon about Mark 16:15-20Ready Set Go Children Sermon about Mark 16:15-20
Ready Set Go Children Sermon about Mark 16:15-20
 
Unlocking Exploration: Self-Motivated Agents Thrive on Memory-Driven Curiosity
Unlocking Exploration: Self-Motivated Agents Thrive on Memory-Driven CuriosityUnlocking Exploration: Self-Motivated Agents Thrive on Memory-Driven Curiosity
Unlocking Exploration: Self-Motivated Agents Thrive on Memory-Driven Curiosity
 
globalisation project report displayed overview
globalisation project report displayed overviewglobalisation project report displayed overview
globalisation project report displayed overview
 
in kuwait௹+918133066128....) @abortion pills for sale in Kuwait City
in kuwait௹+918133066128....) @abortion pills for sale in Kuwait Cityin kuwait௹+918133066128....) @abortion pills for sale in Kuwait City
in kuwait௹+918133066128....) @abortion pills for sale in Kuwait City
 
BIG DEVELOPMENTS IN LESOTHO(DAMS & MINES
BIG DEVELOPMENTS IN LESOTHO(DAMS & MINESBIG DEVELOPMENTS IN LESOTHO(DAMS & MINES
BIG DEVELOPMENTS IN LESOTHO(DAMS & MINES
 
The Concession of Asaba International Airport: Balancing Politics and Policy ...
The Concession of Asaba International Airport: Balancing Politics and Policy ...The Concession of Asaba International Airport: Balancing Politics and Policy ...
The Concession of Asaba International Airport: Balancing Politics and Policy ...
 

griet paper pblished(13-9-2021).pdf

  • 1. Detection and Classification of Intracranial Brain Hemorrhage K. V. Sharada, Vempaty Prashanthi, and Srinivas Kanakala Abstract Computer -aided diagnosis systems (CAD), as their name suggests, utilize computers to assist doctors to obtain a quick and correct diagnosis. They focused on several scholars as they are built upon the concept of processing and examining pictures of various parts of the individual body meant for a fast and correct outcome. CAD systems are generally area specific because they are augmented for some certain kinds of infections, various parts of the individual body, diagnosis methods, etc. They analyze dissimilar types of inputs given, for example, signs, test center, result, health pictures, etc. varying on their territory. One of the maximum common kind of diagnosis depends on medical pictures. Our approach is to develop a model to identify either a brain hemorrhage is present or not in Computed Topography (CT) scan of the brain and also identify the kind of hemorrhage. The process of detecting and iden- tifying hemorrhage contains many steps like image pre-processing, segmentation of image, extracting the features, and classifying the images. Keywords CT scan · Brain haemorrhage · Image processing · Image segmentation 1 Introduction Brain hemorrhage implies blood loss within brain. In brief, one quite stroke which causes draining round the tissues by an artery within the cerebrum is observed as brain hemorrhage. Draining can happen in between the cerebrum and also the layers that cover it. The irritation that is caused by the blood from trauma leads to increase of pressure on brain tissues; this results in reduced percentage of oxygen from reaching the brain cells. This brain hemorrhage is observed as medical emergency which needs prompt treatment. There are several factors which might cause or result in K. V. Sharada · V. Prashanthi (B) Gokaraju Rangaraju Institute of Engineering and Technology, Hyderabad, India S. Kanakala VNR Vignana Jyothi Institute of Engineering and Technology, Hyderabad, India © The Author(s), under exclusive license to Springer Nature Singapore Pte Ltd. 2022 P. Nayak et al. (eds.), IoT and Analytics for Sensor Networks, Lecture Notes in Networks and Systems 244, https://doi.org/10.1007/978-981-16-2919-8_41 455
  • 2. 456 K. V. Sharada et al. cerebral hemorrhage. These components include head injury, blood vessel anoma- lies, liver disease, brain tumour, extreme high blood pressure, bleeding disorders, and utilization of illegal medications. Anomalies within the blood vessels are the most explanation in the majority of the intracerebral hemorrhages that out of nowhere happen in youngsters, anyway there could be other potential causes which incorpo- rate blood sicknesses, cerebrum tumors, septicemia, or the work of liquor or illegal medications. Many people who experience a hemorrhage have side effects as though they are having a stroke and can create weakness on one side of their body or a feeling of numbness. Sometimes brain hemorrhage can cause a scope of various indications like sudden, serious migraine, difficulty in gulping, vision problems, loss of coordi- nation with the body, confusion or trouble in understanding, difficulty in talking or stammering discourse, seizures, torpidity or stupor. Brain hemorrhage often leads to several complications. Because of the draining nerve cells one cannot speak with different pieces of the body and in this manner stops ordinary working. Additionally, there are scarcely any basic issues that emerge after a brain discharge which incorporates development, discourse, or memory issues. A few difficulties might be lasting relying upon the area of drain and the harm that happens. These intricacies may incorporate—loss of motion, vision misfortune, and decreased capacity to talk or get words, disarray, or memory misfortune. These complications made brain hemorrhage an emergency condition that requires immediate treatment. Diagnosing a brain drain could be troublesome as certain individuals do not give any physical indications. Specialists need to do take the assistance of a CT scan or MRI scan so as to locate the specific area of the seeping in the mind. CT pictures are known to claim numerous points of interest over MRI. Along these lines, the standard of CT pictures is sufficiently high to precisely analyse Intracranial Brain Hemorrhage. PC supported determination frameworks (CAD), as their name proposes, use PCs to assist specialists with arriving at a quick and exact conclusion. They have been the focal point of numerous scientists since they depend on preparing and examining pictures of various pieces of the human body for brisk and exact outcomes. Computer aided design frameworks are normally area explicit as they are advanced for certain particular sorts of infections, portions of the body, analysis techniques, and so on. They investigate various assortments of information, for example, manifestations, research facility test results, clinical pictures, and so on depending on their space. One of the most generally perceived sorts of determination is the one that depends on clinical pictures. Such frameworks are helpful on the grounds that they can be incorporated with the product of the clinical imaging machine so as to deliver a brisk and precise finding. Then again, they can be trying since they consolidate the components of man-made reasoning and advanced picture preparing (Fig. 1). The rest of the paper is organized as follows: In Session 2 Literature survey is discussed, in Session 3 proposed system is described, Session 4 describes the implementation, Session 5 explains the experimentation and results and finally in Session 6 conclusion is given of our main proceedings series.
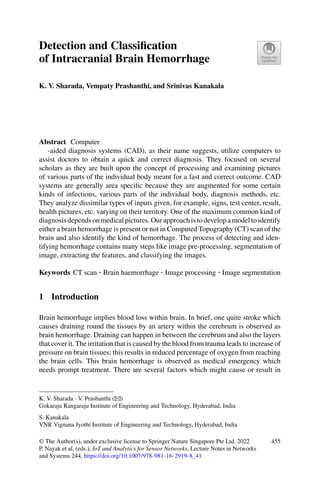
  • 3. Detection and Classification of Intracranial Brain Hemorrhage 457 Fig. 1 CT scan images of five types of brain hemorrhages 2 Literature Survey Thepaper[1]mainlydiscussedthepre-segmentationprocess.Inthisthetechniquesof dividingtheinputimageintofourquadrantsusingthemethodofsplittingandmerging are used. This is called as pre-segmentation of imaging. The pre-segmentation can be done with the following methods: (1) Thresholding: in thresholding the pixels of the input image is given certain threshold values and those pixels are mapped to related areas. (2) Region growing technique. (3) Supervised segmentation methods and unsupervised segmentation methods. Process of segmentation is as follows: as a first step the image is split into quadrants. Then histogram and pixel values are computed for each quadrant separately. The succeeding process for the above step is comparing each histogram value and pixel value with the predefined threshold criteria (or) histogram, pixel values. The final step is taking only the region of abnormality that is detected and feeding this as input to the segmentation process. In [2] the method includes a combination of the machine with knowledge discovery techniques. During a CT scan the Intracranial pixel depth is noted. Based on the depth the pixel intensities are normalized using depth-dependent gray level normalization and the dense area of the intracranial region is segmented with the process of region growing and multi-resolution thresholding. The succeeding step is the construction of the decision tree by applying the algorithm. The first step in the method is pre-processing, and it involves the separation of pixels containing the extracranial part and the skull (intracranial pixels). This is used for recognition, measurement, and classification of a hematoma. In the next step the optimal threshold is chosen for hematoma segmentation by human experts and this differs from case to case which leads to instability. In the succeeding step the identification of the largest area containing Intracranial hematoma is done by considering the largest connected hyperdense region and excluding other smaller hyperdense regions. The final step is the construction of a decision tree using algorithm. Limitations: there is difficulty in recognizing subdural and epidural hematomas. In [3] there is much focus on Cerebral Ischemia and had been said that if cerebral ischemia developed once there might not be a successful or complete cure for the abnormality. The method involved is based on the average thickness of the blood layer and based on thickness, and it is divided into grades such as good, recovery,
  • 4. 458 K. V. Sharada et al. dead scaling them as 1, 2, and 3. Computed Tomography (CT) scanned images are given as input to the process. It is described in this process that a thick localized subarachnoid layer of blood or diffusion of blood might lead to delayed cerebral ischemia. This method only focuses on Cerebral Ischemia. In [4] there is an automatic classification of images into two classes based on features. The two classes are abnormal and normal. This classification involves four phases. Pre-process includes the separation of pixels containing the extracranial part and intracranial part. In feature extraction the original dataset is restricted, and these extracted features serve as training data and saved into feature library. Next, they applied the SVM classifier and KNN classifier. While performing this method it was observed that the K-Nearest Neighbors classifier yielded better results in comparison withtheSVMclassifier.Thepostprocessingstepisperformedafterimageisclassified as abnormal. In the post-processing step the image of the skull is removed and then the abnormal region is extracted. Generally, for removing skull we use brightest pixel cells as the brain matter appears in grey color. This approach categorizes only two classes (abnormal and normal) and gives generic results without any specific label. In [5, 6] the cerebral microbleed is visualized by using susceptibility-weighted imaging (SWI). Here depending on susceptibility-weighted imaging they constructed rank based average pooling to identify cerebral microbleed. For detection of cerebral microbleed, Convolutional Neural Network is used which contains multiple layers. ReLU layer is used to map the convolution layer with SoftMax activation, tangent activation and Rectified linear unit activation. It is more effective than the convolu- tion layer. So, it is more popular. The convolutional layer may have a greater number of elements in the feature set which will lead to dimension disaster termed as overfit- ting. In this situation pooling plays a major role that replaces the clusters of related elements in the feature set with statistic summary value. This is done using a pooling function. The last advance is rank-based normal pooling which incorporates a normal of non-zero negative actuations. Rank-based normal pooling can beat the issue of loss of helpful data which is brought about by normal pooling and most extreme pooling. This is a very complex method and has a computational burden. In [7] the method proposed is a densely connected neural network which is called densenet. To detect cerebral microbleeds the algorithm used is densenet. A sliding window is utilized to cover the arrangement of unique pictures from left to right and throughandthrough.Theobjectiveworthischosendependentonthefocalpixelofthe sub models. Later the cost matrix will be employed, based on the comparison between the entries in the cost matrix and target value final abnormality region is detected. Following are the steps included in this algorithm: (1) Traditional Convolutional Neural Network: the layer age of straight enactment, the capacity is done by means of convolutions [8]. The following layer, for example, ReLU layer, is utilized to outline convolution layer with SoftMax enactment, digression actuation, Rectified straight unit initiation, and so on. It is more effective than the convolution layer. So, it is more popular. (2) Densenet: It is used to establish connections between layers. These connections are used for feature maps. The layers that are between the blocks are called transition layers. Each layer receives information from its previous layer. (3) Transfer learning: it is based on fully convolutional multiscale residual
  • 5. Detection and Classification of Intracranial Brain Hemorrhage 459 densenets. It considers the labeled samples to get high classification accuracy. It is meant to retrain the later layers of densenet. The usage of this transfer learning leads to an increase in accuracy rate. In [9, 10] a complete CNN is trained with computed tomography (CT) scans. The algorithm resulted in high accuracy for the detection of acute Intracranial Hemor- rhage. This algorithm has shown more accurate results than the measurements that are calculated by 2–4 radiologists. The method used in [11, 12] is 3D quantitative analysis which performs 3D measurements of the parameters of the Intracerebral Brain Hemorrhage region based on computed tomography (CT) images. This resultant data is correlated with patient mortality. The image segmentation in this is done using a clustering algorithm whose strategy is based on fuzzy c-means which minimizes the objective function that repre- sents the distance of feature vectors from the cluster centers. Based on the features of the clusters rule-based labelling is done whose components include fact-list, knowl- edgebase (or) rule-base, and inference engine. The labelling is done on the area, the color of the region. This is taken as input for the final step. This method not always perform correct segmentation. In [13–15] the first step is pre-processing which includes division of the image into four quadrants called segmentation. Pre-processing is done using a tracking algorithm to separate skull images from the Gray dura matter in the CT scan image. Among these four regions the most vulnerable region which has the possibility of abnormality is considered and remaining regions are excluded. The next step is a grouping of all the identical homogenous regions to point out the abnormality. Following are the segmentation methods that are used: (1) Thresholding: it compares the pixel values with the threshold values. (2) Region growing techniques: it extracts useful or connected regions. (3) Supervised and unsupervised method: in this method there is the segmentation of the image in the training stage. Compared to supervised, unsupervised is efficient and less error sensitive. This method is not fully automatic. It requires a lot of human intervention. 3 Proposed Method The proposed method includes CT scan images as the input datasets. Initially CT Scan images are converted into the format that a network/model can take as input. Images are converted into jpeg format. Later the images are processed so as to analyze the images accurately. Otsu’s strategy is utilized with the end goal of segmentation. In general, it is a method to segment an advanced picture into numerous regions bolstered a few rules like arrangements of pixels, and so forth. Noise and unwanted pixels from the image are removed such as the skull part of the image which is of high intensity. The objective of the segment is to disentangle a picture to be increasingly significant and simpler to examine. Numerous methodologies for division exist, for example, thresholding and grouping. This stage sections the cerebrum picture into a few locales with the goal that we can segregate the ROI (the drain district). The result
  • 6. 460 K. V. Sharada et al. of this stage is regularly used to distinguish the presence of hemorrhages with most extreme exactness. Later classification of images is done using the Weka tool. Otsu’s method of segmentation also minimizes the within-class variance of the system by finding a threshold value automatically based upon the pixel values, probability values of a segment. Morphological operations and region growing techniques can be used to obtain further improvements on the segmented image and finally most filtered part of ROI is obtained and features like the area of ROI, the axis of ROI, the circumference of ROI, distance between skull and ROI are extracted, and they are fed into a neural network through a feature vector pattern. For the extraction of features accurately Region props tool of MATLAB is used. For the purpose of classification between various types of hemorrhages the shape of ROI plays a major role generally for Epidural and Intraparenchymal hemorrhages, there is a convex hull that is present in the region of Interest whereas for subdural hemorrhage it is concave in shape. The Region surrounding the ROI is called Bounding Box, which also plays an important role to extract features of region of interest (ROI). The extracted features from ROI will be stored as input to train the model. The kind of hemorrhage is then recognized based on the neural network which is trained. Once the set of input and output images are saved at that instance then there will be a saved network which is called a Network file. Later working of a network file is determined using a training percentage method. 3.1 Preprocessing Preprocessing is the beginning step of the method that involves removal of high intensity pixel part of the image such as the skull part and removal of noise. Later the image is segmented into parts so that it becomes easy for the purpose of analyzing and it is done by the OTSU’S method which has 100% of accuracy and clustering of segments with similar properties is made so that identification abnormalities become easy. 3.2 Segmentation Segmentation step is continued by the feature extraction step which is main step to group segments with similar properties together and then later feed into a neural network. The pixel intensity of the brightest part of the skull is about 250 pixels, and it must be removed in order to identify the part that has abnormality. It is done through MATLAB. Image based cad system is used for the purpose of image segmentation. Later based on the properties of segmented part the type of hemorrhage is detected using a classifier algorithm (Type detection algorithm). Type Detection Algorithm (Segmentation)
  • 7. Detection and Classification of Intracranial Brain Hemorrhage 461 1: BTD (Ss, p, q, Cc, W) Ss CT scan Data set. n count of feature. C classifier W is vector. 2: Dd ← BUILDDATASET1 (Ss, p, q) 3: for c ∈ Cc do 4: Acu ← TESTINCLASSIFIER (Dd, c, wc) 5: end for 6: return c Acu 7: end 8: BUILDDATASET1 (Ss, p, q) Ss Scan Dataset. n count of feature 9: Assign Dd to empty 10: for j ← 0,9 do 11: tt ← EXTRACINTFEATURE (j, n) 12: add tt to the end of Dd 13: end for 14: return Dd 15: end 16: EXTRACTINFEATURE (j, n) i brains CT scan 17: j is ≥ 251, j = 0; Apply steps 18 to 23 18: perform Otsu j 19: morphological j 20: regions growing j 21: region props 22: classifier 23: return vi 24: end 25: TESTINCLASSIFIER (Dd, c, wc) 26: partition Dd into 10 subset: Dd0..Dd9 27: for k ← 0,9 do 28: Ta ← Dk 29: Tb ← Sk = 0,…,9 30: calculate accuracy 31: return avg of Aj’s for j = 0 to 9 32: end for 33: end procedure. 3.3 Morphological Techniques The followings are the morphological techniques used Opening-by-remaking, shut- ting by-remaking, Supplement picture, Compute territorial maxima, Superimpose the picture, Process Background Markers, Watershed Transformation and the Segmen- tation, Imagine the Result, Evacuate Background Noise. Morphological operations basically remove the background and then dilates the inner segment region. An image
  • 8. 462 K. V. Sharada et al. Fig. 2 Haemorrhagic region after applying segmentation and pre-processing techniques containing potential regions with suspicious mass is the result of morphological operations. 3.4 Obtaining Region of Interest Figure 2 highlighted images that indicate the hemorrhagic region after applying segmentation and pre-processing techniques. Region growing starts from a single point and then expand from that point by finding the region that is similar to that of the seed region. At the end of this step ‘Region of Interest’ is obtained which is utilized as contribution for ‘Neural Network’ and furthermore as training set. ROI is very crucial for the success of the proposed system. Resultant image after applying region growing techniques will be blank for normal brain image, whereas there will be some portion of image existing for brain image in abnormal condition after application of region growing technique. 4 Experimentation and Results Experiments were done by changing the parameters given to the model: changing the way the data was split was tried by toggling the value of the shuffle argument—True or False as shown in Fig. 3. The change has not got any specific modifications to the output of the model. This has happened as little number of samples was utilized for performing segmentation. Next by changing the image size to 256X256 and the batch size to 64, the training process a lot more slower compared to when the values were set to 128 × 128 and 32 which trained the model approximately in 25 min. The training loss for the 256 × 256 images started learning later because the batch
  • 9. Detection and Classification of Intracranial Brain Hemorrhage 463 Fig. 3 (a) Loss vs Epoch: for 256X256 image size (b) Loss vs Epoch: for 128X128 image size size was doubled and further we think it did not reach it. The model trained on 50 epochs but could have been appropriately trained for less number of epochs. This experiment mainly focused on segmentation of the data and localizing the affected area. 5 Conclusion Automated frameworks for grouping medical images have increased a phenomenal degree of consideration recently. It has considerable impact in recognizing the exis- tence of cerebral hemorrhage (the paired characterization issue) and in the event that it exists classification of hemorrhage is done and also problem of multiclass is also resolved. Although there are some algorithms which detect the hemorrhage efficiently and produce reasonable results, they are having few limitations like few algorithms find it difficult in recognizing subdural and epidural hematomas, few of them cannot detect subarachnoid hemorrhage, few consume more power and some are not suitable for large datasets, having longer computation time. Main cause for these limitations is existence of standardized procedures in less numbers. Since the diagnosis of Brain Hemorrhage is the very complicative and sensitive task, accuracy and reliability are given much priority. The investigations indicate that later pre- handling CT Scans, the double arrangement issue untraveled with 100% exactness. Additionally, the actualized framework accomplished over 92% exactness for the order issue of deciding the discharge type utilizing convolutional neural systems as a classifier. The outcomes are truly promising and more elevated levels of exactness for the characterization issue will be accomplished by getting a vastly improved dataset with high-level goals pictures held legitimately from the CT scanner. Also, unique element extraction and highlight choice procedures could be utilized to improve the presentation of the framework.
  • 10. 464 K. V. Sharada et al. References 1. Li, Y., Hu, Q., Wu, J., Chen, Z. (2009). A hybrid approach to detection of brain hemorrhage candidates from clinical head ct scans. In 2009 Sixth International Conference on Fuzzy Systems and Knowledge Discovery. vol. 1. IEEE. 2. Liao, CC., Xiao, F., Wong, J. M., Chiang, I. J. (2008). A knowledge discovery approach to diagnosing intracranial hematomas on brain CT: recognition, measurement and classification. In International conference on medical biometrics. Berlin, Heidelberg, Springer. 3. Bhadauria, H. S., Dewal, M. L. (2014). Intracranial hemorrhage detection using spatial fuzzy c-mean and region-based active contour on brain CT imaging. Signal, Image and Video Processing, 8(2), 357–364. 4. Mohsen, F., Pomonis, S., Illingworth, R. (1984). Prediction of delayed cerebral ischaemia aftersubarachnoidhaemorrhagebycomputedtomography.JournalofNeurology,Neurosurgery Psychiatry, 47(11), 1197–1202. 5. Kyaw, M. M. (2013). Pre-segmentation for the computer aided diagnosis system. International Journal of Computer Science Information Technology, 5(1), 79. 6. Dou, Q., Chen, H., Yu, L., Zhao, L., Qin, J., Wang, D., Heng, P. A. (2016). Automatic detection of cerebral microbleeds from MR images via 3D convolutional neural networks. IEEE transactions on medical imaging, 35(5), 1182–1195. 7. Ramteke, R. J., Monali, K. Y. (2012). Automatic medical image classification and abnor- mality detection k-nearest neighbour. International Journal of Advanced Computer Research 2(4), 190–196. 8. Wang, S., Jiang, Y., Hou, X., Cheng, H., Du, S. (2017). Cerebral micro-bleed detection based on the convolution neural network with rank based average pooling. IEEE Access, 5, 16576–16583. 9. Kuo, W., Häne, C., Mukherjee, P., Malik, J., Yuh, E. L. (2019). Expert-level detection of acute intracranial hemorrhage on head computed tomography using deep learning. Proceedings of the National Academy of Sciences, 116(45), 22737–22745 10. Loncaric, S., Dhawan, A. P., Cosic, D., Kovacevic, D., Broderick, J., Brott, T. (1999). Quan- titative intracerebral brain hemorrhage analysis. In Medical Imaging 1999: Image Processing (Vol. 3661). International Society for Optics and Photonics. 11. Kyaw, M. M. (2013). Computer-Aided Detection system for Hemorrhage contained region. International Journal of Computational Science and Information Technology, 11–16. 12. Magoulas, G. D., Prentza, A. (1999). Machine learning in medical applications. In Advanced course on artificial intelligence. Berlin, Heidelberg, Springer. 13. Prashanthi, V., Srinivas, K. (2020). Plant disease detection using convolutional neural networks. International Journal of Advanced Trends in Computer Science and Engineering, 9(3), 2632–2637. 14. Hayward, R. D. (1977). Subarachnoid haemorrhage of unknown aetiology: A clinical and radiological study of 51 cases. Journal of Neurology, Neurosurgery Psychiatry, 40(9), 926– 931. 15. Prashanthi, V., Srinivas, K., Generating analytics from web log. International Journal of Engineering and Advanced Technology, 9(4), 161–165.