This document summarizes a research paper that proposes a new method for automatically segmenting brain tumors in CT images. The method uses a combination of wavelet-based texture features extracted from discrete wavelet transformed sub-bands. These features are optimized using genetic algorithms and used to train probabilistic neural network and feedforward neural network classifiers to segment tumors. The proposed method is evaluated on brain CT images and shown to outperform existing segmentation methods.
![A.Padma & Dr.R.Sukanesh
International Journal of Image Processing (IJIP), Volume (5) : Issue (5) : 2011 552
A Wavelet Based Automatic Segmentation of Brain Tumor in
CT Images Using Optimal Statistical Texture Features
A.Padma
Research scholar, giri_padma2000@yahoo.com
Thiyagarajar College of Engineering
Madurai – 625 015, India
Dr.R.Sukanesh
Prof of Electronics and Communication Engineering, rshece@tce.edu
Thiagarajar College of Engineering,
Madurai – 625 015, India.
Abstract
This paper presents an automated segmentation of brain tumors in computed tomography
images (CT) using combination of Wavelet Statistical Texture features (WST) obtained from 2-
level Discrete Wavelet Transformed (DWT) low and high frequency sub bands and Wavelet Co-
occurrence Texture features (WCT) obtained from two level Discrete Wavelet Transformed
(DWT) high frequency sub bands. In the proposed method, the wavelet based optimal texture
features that distinguish between the brain tissue, benign tumor and malignant tumor tissue is
found. Comparative studies of texture analysis is performed for the proposed combined wavelet
based texture analysis method and Spatial Gray Level Dependence Method (SGLDM). Our
proposed system consists of four phases i) Discrete Wavelet Decomposition (ii) Feature
extraction (iii) Feature selection (iv) Classification and evaluation. The combined Wavelet
Statistical Texture feature set (WST) and Wavelet Co-occurrence Texture feature (WCT) sets
are derived from normal and tumor regions. Feature selection is performed by Genetic Algorithm
(GA). These optimal features are given as input to the PNN classifier to segment the tumor. An
Probabilistic Neural Network (PNN) classifier is employed to evaluate the performance of these
features and by comparing the classification results of the PNN classifier with the Feed Forward
Neural Network classifier (FFNN).The results of the Probabilistic Neural Network, FFNN
classifiers for the texture analysis methods are evaluated using Receiver Operating
Characteristic (ROC) analysis. The performance of the algorithm is evaluated on a series of brain
tumor images. The results illustrate that the proposed method outperforms the existing methods.
Keywords: Discrete Wavelet Transform(DWT), Genetic Algorithm(GA), Receiver Operating
Characteristic(ROC)analysis, Spatial Gray Level Dependence Method (SGLDM), Probabilistic
Neural Network (PNN).
1. INTRODUCTION
In recent years, medical CT Images have been applied in clinical diagnosis widely. That can
assist physicians to detect and locate Pathological changes with more accuracy. Computed
Tomography images can be distinguished for different tissues according to their different gray
levels. The images, if processed appropriately can offer a wealth of information which is
significant to assist doctors in medical diagnosis. A lot of research efforts have been directed
towards the field of medical image analysis with the aim to assist in diagnosis and clinical studies
[1]. Pathologies are clearly identified using automated CAD system [2]. It also helps the
radiologist in analyzing the digital images to bring out the possible outcomes of the diseases. The
medical images are obtained from different imaging systems such as MRI scan, CT scan, Ultra
sound B scan. The computerized tomography has been found to be the most reliable method for](https://image.slidesharecdn.com/ijip461-160213100356/85/A-Wavelet-Based-Automatic-Segmentation-of-Brain-Tumor-in-CT-Images-Using-Optimal-Statistical-Texture-Features-1-320.jpg)
![A.Padma & Dr.R.Sukanesh
International Journal of Image Processing (IJIP), Volume (5) : Issue (5) : 2011 552
A Wavelet Based Automatic Segmentation of Brain Tumor in
CT Images Using Optimal Statistical Texture Features
A.Padma
Research scholar, giri_padma2000@yahoo.com
Thiyagarajar College of Engineering
Madurai – 625 015, India
Dr.R.Sukanesh
Prof of Electronics and Communication Engineering, rshece@tce.edu
Thiagarajar College of Engineering,
Madurai – 625 015, India.
Abstract
This paper presents an automated segmentation of brain tumors in computed tomography
images (CT) using combination of Wavelet Statistical Texture features (WST) obtained from 2-
level Discrete Wavelet Transformed (DWT) low and high frequency sub bands and Wavelet Co-
occurrence Texture features (WCT) obtained from two level Discrete Wavelet Transformed
(DWT) high frequency sub bands. In the proposed method, the wavelet based optimal texture
features that distinguish between the brain tissue, benign tumor and malignant tumor tissue is
found. Comparative studies of texture analysis is performed for the proposed combined wavelet
based texture analysis method and Spatial Gray Level Dependence Method (SGLDM). Our
proposed system consists of four phases i) Discrete Wavelet Decomposition (ii) Feature
extraction (iii) Feature selection (iv) Classification and evaluation. The combined Wavelet
Statistical Texture feature set (WST) and Wavelet Co-occurrence Texture feature (WCT) sets
are derived from normal and tumor regions. Feature selection is performed by Genetic Algorithm
(GA). These optimal features are given as input to the PNN classifier to segment the tumor. An
Probabilistic Neural Network (PNN) classifier is employed to evaluate the performance of these
features and by comparing the classification results of the PNN classifier with the Feed Forward
Neural Network classifier (FFNN).The results of the Probabilistic Neural Network, FFNN
classifiers for the texture analysis methods are evaluated using Receiver Operating
Characteristic (ROC) analysis. The performance of the algorithm is evaluated on a series of brain
tumor images. The results illustrate that the proposed method outperforms the existing methods.
Keywords: Discrete Wavelet Transform(DWT), Genetic Algorithm(GA), Receiver Operating
Characteristic(ROC)analysis, Spatial Gray Level Dependence Method (SGLDM), Probabilistic
Neural Network (PNN).
1. INTRODUCTION
In recent years, medical CT Images have been applied in clinical diagnosis widely. That can
assist physicians to detect and locate Pathological changes with more accuracy. Computed
Tomography images can be distinguished for different tissues according to their different gray
levels. The images, if processed appropriately can offer a wealth of information which is
significant to assist doctors in medical diagnosis. A lot of research efforts have been directed
towards the field of medical image analysis with the aim to assist in diagnosis and clinical studies
[1]. Pathologies are clearly identified using automated CAD system [2]. It also helps the
radiologist in analyzing the digital images to bring out the possible outcomes of the diseases. The
medical images are obtained from different imaging systems such as MRI scan, CT scan, Ultra
sound B scan. The computerized tomography has been found to be the most reliable method for](https://image.slidesharecdn.com/ijip461-160213100356/75/A-Wavelet-Based-Automatic-Segmentation-of-Brain-Tumor-in-CT-Images-Using-Optimal-Statistical-Texture-Features-1-2048.jpg)
![A.Padma & Dr.R.Sukanesh
International Journal of Image Processing (IJIP), Volume (5) : Issue (5) : 2011 553
early detection of tumors because this modality is the mostly used in radio therapy planning for
two main reasons. The first reason is that scanner images contain anatomical information which
offers the possibility to plan the direction and the entry points of radio therapy rays which have to
target only the tumor region and to avoid other organs. The second reason is that CT scan
images are obtained using rays, which is same principle as radio therapy. This is very important
because the intensity of radio therapy rays have been computed from the scanned image.
Advantages of using CT include good detection of calcification, hemorrhage and bony detail plus
lower cost, short imaging times and widespread availability. The situations include patient who
are too large for MRI scanner, claustrophobic patients, patients with metallic or electrical implant
and patients unable to remain motionless for the duration of the examination due to age, pain or
medical condition. For these reasons, this study aims to explore methods for classifying and
segmenting brain CT images. Image segmentation is the process of partitioning a digital image
into set of pixels. Accurate, fast and reproducible image segmentation techniques are required in
various applications. The results of the segmentation are significant for classification and analysis
purposes. The limitations for CT scanning of head images are due to partial volume effects which
affect the edges produce low brain tissue contrast and yield different objects within the same
range of intensity. All these limitations have made the segmentation more difficult. Therefore, the
challenges for automatic segmentation of the CT brain images have many different approaches.
The segmentation techniques proposed by Nathali Richarda et al and Zhang et al [3][4]
include statistical pattern recognition techniques. Kaiping et al [5] introduced the effective Particle
Swarm optimization algorithm to segment the brain images into Cerebro spinal fluid (CSF) and
suspicious abnormal regions but without the annotation of the abnormal regions. Dubravko et al
and Matesin et al [6] [7] proposed the rule based approach to label the abnormal regions such as
calcification, hemorrhage and stroke lesion. Ruthmann.et al [8] proposed to segment Cerobro
spinal fluid from computed tomography images using local thresholding technique based on
maximum entropy principle. Luncaric et al proposed [9] to segment CT images into background,
skull, brain, ICH, calcifications by using a combination of K means clustering and neural
networks. Tong et al proposed[10] to segment CT images into CSF,brain matter and detection of
abnormal regions using unsupervised clustering of two stages. Clark et al [11] proposed to
segment the brain tumor automatically using knowledge based techniques. From the above
literature survey shows that intensity based statistical features are the most straight forward and
have been widely used, but due to the complexity of the pathology in human brain and the high
quality required by clinical diagnosis, only intensity features cannot achieve acceptable result. In
such applications, segmentation based on textural feature methods gives more reliable results.
Therefore texture based analysis have been presented for tumor segmentation such as SGLDM
method and wavelet based texture features are used and achieve promising results.
Based on the above literature, better classification accuracy can be achieved using wavelet
based statistical texture features. In this paper, the authors would like to propose a combination
of Wavelet Statistical Texture features (WST) obtained from 2-level Discrete Wavelet
Transformed (DWT) low and high frequency sub bands and Wavelet Co-occurrence Texture
features (WCT) obtained from two level Discrete Wavelet Transformed (DWT) high frequency
sub bands. The extracted texture features are optimized by Genetic Algorithm(GA)[12] for
improving the classification accuracy and reducing the overall complexity. The optimal texture
features are fed to the PNN[13], FFNN[14] classifiers to classify and segment the tumor
region from brain CT images.
2: MATERIALS AND METHODS
Most classification techniques offer intensity based statistical features. The proposed system is
divided into 4 phases (i) Discrete Wavelet Decomposition (ii) Feature extraction (iii) Feature
selection(iv) Classification and Evaluation. For feature extraction, we discovered two methods
which are i) the combination of Wavelet Statistical Texture features (WST) obtained from 2-
level Discrete Wavelet Transformed (DWT) low and high frequency sub bands and Wavelet Co-
occurrence Texture features (WCT) obtained from two level Discrete Wavelet Transformed
(DWT) high frequency sub bands ii) SGLDM method without wavelet transform. Once all the
features are extracted, then for feature selection, we use Genetic Algorithm (GA) to select the](https://image.slidesharecdn.com/ijip461-160213100356/85/A-Wavelet-Based-Automatic-Segmentation-of-Brain-Tumor-in-CT-Images-Using-Optimal-Statistical-Texture-Features-2-320.jpg)
![A.Padma & Dr.R.Sukanesh
International Journal of Image Processing (IJIP), Volume (5) : Issue (5) : 2011 554
optimal statistical texture features. After selecting the optimal texture features, to classify and
segment the tumor region from brain CT images using PNN ,FFNN classifiers.
2.1 Discrete Wavelet Decomposition
Daubechies wavelet filter of order two is used and found to yield good results in classification
and segmentation of tumor from the brain CT images. By applying 2D DWT[15], two level
wavelet decomposition of region of interest(ROI) is performed which results in four sub bands. In
2D wavelet decomposition the image is represented by one approximation and three detail
images ,representing the low and high frequency contents image respectively. The approximation
can be further to produce one approximation and three detail images at the next level of
decomposition, wavelet decomposition process is shown in Figure 1. LL1, LL2 represent the
wavelet approximations at 1st
and 2nd
level respectively, and are low frequency part of the
images. LH1,HL1,HH1,LH2,HL2,HH2 represent the details of horizontal, vertical and diagonal
directions at 1st
and 2nd
level respectively, and are high frequency part of the images.
LL2 HL2
HL1
LH2 HH2
LH1 HH1
FIGURE 1: Wavelet Image decomposition at 2nd
level
Among the high frequency sub bands, the one whose histogram presents the maximum variance
is the sub band that represents the most clear appearance of the changes between the different
textures. The WST features are extracted from the 2
rd
level of both low and high frequency
sub bands and WCT features are extracted from 2
nd
level of high frequency sub bands are
useful to classify and segment the tumor region from brain CT images.
2.2 Feature Extraction
Texture analysis is a quantitative method that can be used to quantify and detect structural
abnormalities in different tissues .As the tissues present in brain are difficult to classify using
shape or intensity level of information, the texture feature extraction is founded to be very
important for further classification. The purpose of feature extraction is to reduce original data set
by measuring certain features that distinguish one region of interest from another. The analysis
and characterization of textures present in the medical images can be done by using the
combination of Wavelet Statistical Texture features (WST) obtained from 2-level Discrete
Wavelet Transformed (DWT) low and high frequency sub bands and Wavelet Co-occurrence
Texture features (WCT) obtained from two level Discrete Wavelet Transformed (DWT) high
frequency sub bands .
Algorithm for Feature Extraction is as Follows
• Obtain the sub-image blocks, starting from the top left corner.
• Decompose sub-image blocks using 2-D DWT.
• Derive SGLDM or Co-occurrence matrices [16] for two level high frequency sub bands
of DWT with 1 for distance and 0,45,90 and 135 degrees for θ and averaged.
• From these co-occurrence matrices, the following nine Haralick texture features [ 17]
called wavelet Co-occurrence Texture features(WCT) are extracted .
• The Wavelet Statistical Texture features (WST) are extracted from 2 level Discrete
Wavelet Transformed (DWT) low and high frequency sub bands.
• Combination of the both the WST features and WCT features are used for classification.](https://image.slidesharecdn.com/ijip461-160213100356/85/A-Wavelet-Based-Automatic-Segmentation-of-Brain-Tumor-in-CT-Images-Using-Optimal-Statistical-Texture-Features-3-320.jpg)


![A.Padma & Dr.R.Sukanesh
International Journal of Image Processing (IJIP), Volume (5) : Issue (5) : 2011 558
brain CT images. Efficiency or accuracy of the classifiers for each texture analysis method is
analyzed based on the error rate. This error rate can be described by the terms true and false
positive and true and false negative as follows:
True Positive (TP) : The test result is positive in the presence of the clinical abnormality.
True Negative (TN): The test result is negative in the absence of the clinical abnormality.
False Positive (FP): The test result is positive in the absence of the clinical abnormality.
False Negative(FN): The test result is negative in the presence of the clinical abnormality.
Based on the above terms, to construct the table called contingency table.
Actual group Predicted group
Normal Abnormal
Normal TN FP
Abnormal FN FP
TABLE 3: Contingency table of classifier performance.
Sensitivity = TP / (TP + FN)
Specificity = TN / (FP + TN)
Accuracy = (TP+TN)/(TP + TN + FN + FP)
Sensitivity measures the ability of the method to identify abnormal cases. Specificity measures
the ability of the method to identify normal cases. Correct classification rate or accuracy is the
proportion of correct classifications to the total number of classification tests. The PNN, FFNN
classifiers were tested by using leave one out cross validation method. Leave one out cross
validation can be used as a method to estimate the classifier performance in unbiased manner.
Here each step, one data set is left out and the classifier is trained using the rest and the
classifier is applied to the left out data set. This procedure is repeated such that each data set is
left out once. In our application, to evaluate the classification accuracy of the classifiers, the 3,5,
10 fold cross validation is done on the data set collected from 100 images. Classification
accuracy is calculated by taking the average number of all the correct classifications. Other
statistical method known as Receiver Operating Characteristics (ROC) analysis [18] is also used
to analyze the experimental results of the classifiers for each texture analysis method. In this
method, the data set is divided randomly into 5 groups of 100 images with 50 benign tumor and
50 malignant tumor images. Each group consists of 10 benign and 10 malignant tumor images.
Sensitivity and specificity values are recorded for each group and the ROC curve is drawn and
analyzed. Depending on the training set, each group will have a different threshold value for
determining true positive and true negative cases. The ROC curve is a graphical representation
of sensitivity versus specificity as a threshold parameter is varied. The Area Under ROC Curve
(AUC) has been calculated and that AUC value is used to determine the overall classification
accuracy of a specific classifier. The larger the area (the higher AUC value) means higher the
classification performance. In this research, the ROC analysis and classification accuracy are
used to measure the performance of the classifiers based on the different texture analysis
methods.
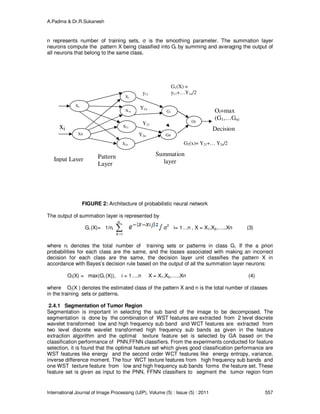
3. RESULTS
Our proposed method is implemented on real human brain CT dataset with the two different
types of tumor images of 30 patients .We have tested our system on segmentation for two
types of benign, malignant tumor images. The output of the image is compared with the ground
truth (target). Ground truth was obtained from the boundary drawings of the radiologist. The
segmentation results of 2 different slices from two different patients with benign and malignant
tumor images are as shown in Figure 3. From the obtained results, this segmentation algorithm](https://image.slidesharecdn.com/ijip461-160213100356/85/A-Wavelet-Based-Automatic-Segmentation-of-Brain-Tumor-in-CT-Images-Using-Optimal-Statistical-Texture-Features-7-320.jpg)


![A.Padma & Dr.R.Sukanesh
International Journal of Image Processing (IJIP), Volume (5) : Issue (5) : 2011 562
compared with the SGLDM method. The proposed system which may be valuable especially in
cases of small region of benign, malignant brain tumor images.
SI-NO Technique Classification accuracy
1 WT+SGLDM+GA+ PNN 97%
2 SGLDM+GA+PNN 94%
3 WT+SGLDM+GA+FFNN 95%
4 SGLDM+GA+FFNN 93%
TABLE 7: Classification accuracy of the proposed technique
4. DISCUSSION AND CONCLUSION
As a conclusion, we have presented a method for combined WST and WCT based texture
feature extraction method and selecting the optimal texture features using GA , and evaluated
the PNN, FFNN classifiers to segment the tumor region. The algorithm have been designed
based on the concept of different types of brain soft tissues have different textural features. This
method effectively works well for segmentation of tumor region with high sensitivity, specificity
and accuracy. The results show that the segmentation by the combined feature extraction
method yields better results compared to the SGLDM method without using wavelet transform
based on the PNN, FFNN classifiers. It is found that this method gives favorable result with
accuracy percentage of above 97% for the images that are being considered. This would be
highly useful as a diagnostic tool for radiologists in the automated segmentation of tumor region
from brain CT images.
The goal of this work is to compare the classification performance of the PNN classifier using
combined wavelet feature extraction method and SGLDM method. Hence it is concluded that the
neural network supported by conventional image processing operations can be effectively used
for segmentation of tumor region from CT images. Use of large data bases is expected to
improve the system robustness and ensure the repeatability of the resulted performance. The
automation procedure proposed in this work using a PNN enables proper abnormal tumor region
detection and segmentation there by saving time and reducing the complexity involved. The
proposed system may be particularly useful in small tumor regions, where segmentation of tumor
in these two types of brain tumor images is radio logically difficult. The work can be extended to
get 100% segmentation accuracy by using other classifiers such as Radial basis function
neural network with Particle Swarm Optimization as a future work. The developed segmentation
system is expected to provide valuable diagnosis for the physicians.
5. REFERENCES
[1] Duncan J.S.,Ayache N, “Medical Image Analysis Progress Over two decade and
challenges ahead”, IEEE Trans on PAMI ,Vol 22,pp. 85 – 106,2000.
[2] Tourassi G D, “Journey towards computer aided Diagnosis – Role of Image Texture
Analysis”, Radiology , Vol 213,pp.317 – 320,1999.
[3] Nathalii Richards, Michael Dujata, Catherine Garbay, ”Distributed Markovian
segmentation : Application to MR brain scans”, Journal of Pattern Recognition , Vol
40,pp. 3467 – 3478,2007.
[4] Zhang Y, Brady M, Smith S, “Segmentation of Brain MR images through Hidden Markov
Random field Model and the expectation maximization algorithm”, IEEE Transactions on
Medical Imaging , Vol 20,pp. 45-57,2001.](https://image.slidesharecdn.com/ijip461-160213100356/85/A-Wavelet-Based-Automatic-Segmentation-of-Brain-Tumor-in-CT-Images-Using-Optimal-Statistical-Texture-Features-11-320.jpg)
![A.Padma & Dr.R.Sukanesh
International Journal of Image Processing (IJIP), Volume (5) : Issue (5) : 2011 563
[5] Kaiping Wei, Bin He, Tao Zhang, Xianjun Zhen, “A Novel Method for Segmentation of
CT Head Images”, 1st
International conference on Bioinformatics and Biomedical
Engineering; Wuhan: IEEE Explore; p 717 – 720, 2007 July 6-8.
[6] Dubravko Cosic ,Sven Loncaric, “Rule based labeling of CT head image”; 6
th
conference
on Artificial Intelligence in Medicine, Europe: Springer ; p.453 – 456, 1997 March 23-26.
[7] Matesn Milan, Loncaric Sven, Petravic Damir, “ Rule based approach to stroke lesion
analysis from CT brain Images”, 2nd
International Symposium on Image and Signal
Processing and Analysis; Pula, Crotia : IEEE Explore ; p.219 – 2231, , 2001 June 19-21.
[8] Ruthmann,V.E, Jayce E.M, Reo D.E, Eckardit M.J, “Fully Automated segmentation of
cerebrospinal fluid in computed tomography “, Psychiatry Research : Neuro Imaging , Vol
50 ,pp. 101 – 119,1993.
[9] Loncaric S and Kova Cevic D, “A Method for segmentation of CT head images”, Lecture
Notes on Computer Science ,Vol 1311,pp.1388 – 305,1997.
[10] Tong Hau Lee, Mohammad Faizal, Ahmad Fauzi and Ryoichi Komiya, “ Segmentation of
CT brain images using unsupervised clusterings”, Journal of Visualization, Vol
12,pp.131-138,2009.
[11] Clark M C., Hall L O., Goldgof D B., Velthuzien R., Murtagh F R., and Silbiger M S.,
“Automatic tumor segmentation using knowledge based techniques”, IEEE Transactions
on Medical Imaging, Vol 17,pp.187-192,1998.
[12] Frank Z. Brill., Donald E. Brown., and Worthy N. Martin, “Fast Genetic Selection of
features for Neural Network Classifiers”, IEEE Trans. Neural Networks, Vol 3,pp. 324-
328,1993.
[13] Xiukun Yang., Finger print Smear Detection based on sub band Feature representation.
Eurasip Journal on Advances in Signal processing , Vol 5,pp. 325-339,2011.
[14] Fausett L, “Fundamentals of Neural Networks: Architectures Algorithms and
Applications”, Englewood cliffs, NJ: Prentice Hall International, p. 289-293,1994.
[15] Van G., Wouver P.,Scheunders and D.Van Dyck, “Statistical texture characterization from
discrete wavelet representation”, IEEE Trans. Image processing,Vol 8,pp.592-598,1999.
[16] Haddon J F, Boyce J F, “Co-occurrence Matrices for Image analysis”, IEE Electronic and
Communications Engineering Journal , Vol 5,pp. 71 – 83,1993.
[17] Haralick R M, Shanmugam K and Dinstein I, “Texture features for Image classification”,
IEEE Transaction on System, Man, Cybernetics ,Vol 3,pp. 610 – 621,1973.
[18] Tom Fawcett ,”An introduction to ROC analysis”, Pattern Recognition Letters , Vol 27,pp.
861-874,2006.](https://image.slidesharecdn.com/ijip461-160213100356/85/A-Wavelet-Based-Automatic-Segmentation-of-Brain-Tumor-in-CT-Images-Using-Optimal-Statistical-Texture-Features-12-320.jpg)