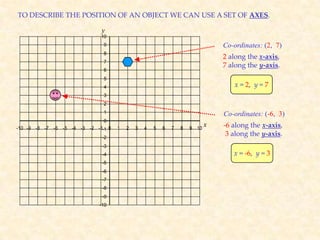
1. y x TO DESCRIBE THE POSITION OF AN OBJECT WE CAN USE A SET OF AXES. Co-ordinates: (2, 7) 2 along the x-axis, 7 along the y-axis. x = 2, y = 7 Co-ordinates: (-6, 3) -6 along the x-axis, 3 along the y-axis. x = -6, y = 3
2. y x Every point has an x co-ordinate and a y co-ordinate. x + y = 8 When plotting a graph, we are interested in ALL those points whose co-ordinates satisfy some rule or other. For example, consider ALL those points whose co-ordinates add up to 8. ALWAYS label the graph! x y 0 8 1 7 2 6 3 5 etc. There are billions of such points!
3. y x We will plot 4 graphs on a single set of axes. Example 1. y = x y = 3x x y x y 0 0 0 0 3 3 6 2 -4 -4 -9 -3 y = 2x y = ½x x y x y 0 0 0 0 4 8 6 3 2 4 -8 -4
4. y x Example 2. y = x + 2 y = 2x - 3 x y x y 2 0 -3 0 3 1 -1 1 4 2 1 2 y = x - 4 y = 3x - 5 x y x y -5 0 -4 0 -2 1 -3 1 1 2 -2 2
5. Lines parallel to the x axis y 10 9 8 7 6 5 4 3 2 1 x 0 1 2 3 4 5 6 7 9 10 -10 8 -9 -8 -6 -4 -3 -2 -7 -5 -1 -1 -2 -3 -4 -5 -6 -7 -8 -9 -10 Lines parallel to the y axis Y = 8 Y = 4 Y = 2 Y = 0 Y = -3 Y = -8 x = 5 x = 9 x = - 4 x = - 7 x = 0
6. y x Plot the following 4 graphs on a single set of axes. Question 1. a) y = x b) y = x + 3 c) y = x + 6 d) y = x 4
7. y x Plot the following 4 graphs on a single set of axes. Question 2. a) y = 2x b) y = 2x + 3 c) y = 2x 1 d) y = 2x 3
8. y x Plot the following 3 graphs on a single set of axes. Question 3. a) y = 10 x b) y = 8 x c) y = 4 x
9. y x Plot the following 3 graphs on a single set of axes. Question 4. a) y = 3x b) y = 3x 3 c) y = 3x + 4
10. y x Plot the following 4 graphs on a single set of axes. Question 5. a) x + y = 9 b) x + y = 6 c) x + y = 3 d) x + y = 0
11. y x Plot the following 3 graphs on a single set of axes. Question 6. a) y = 10 2x b) y = 6 2x c) y = 9 3x
12. y x Plot the following 3 graphs on a single set of axes. Question 7. a) y = 8 x b) y = 8 2x c) y = 8 4x
13. Home work Plot the following 3 graphs on a single set of axes. y = x+8 y = 4x+5 y = 10-2x x = y – 3 x = 3y + 5 Love you T.SO