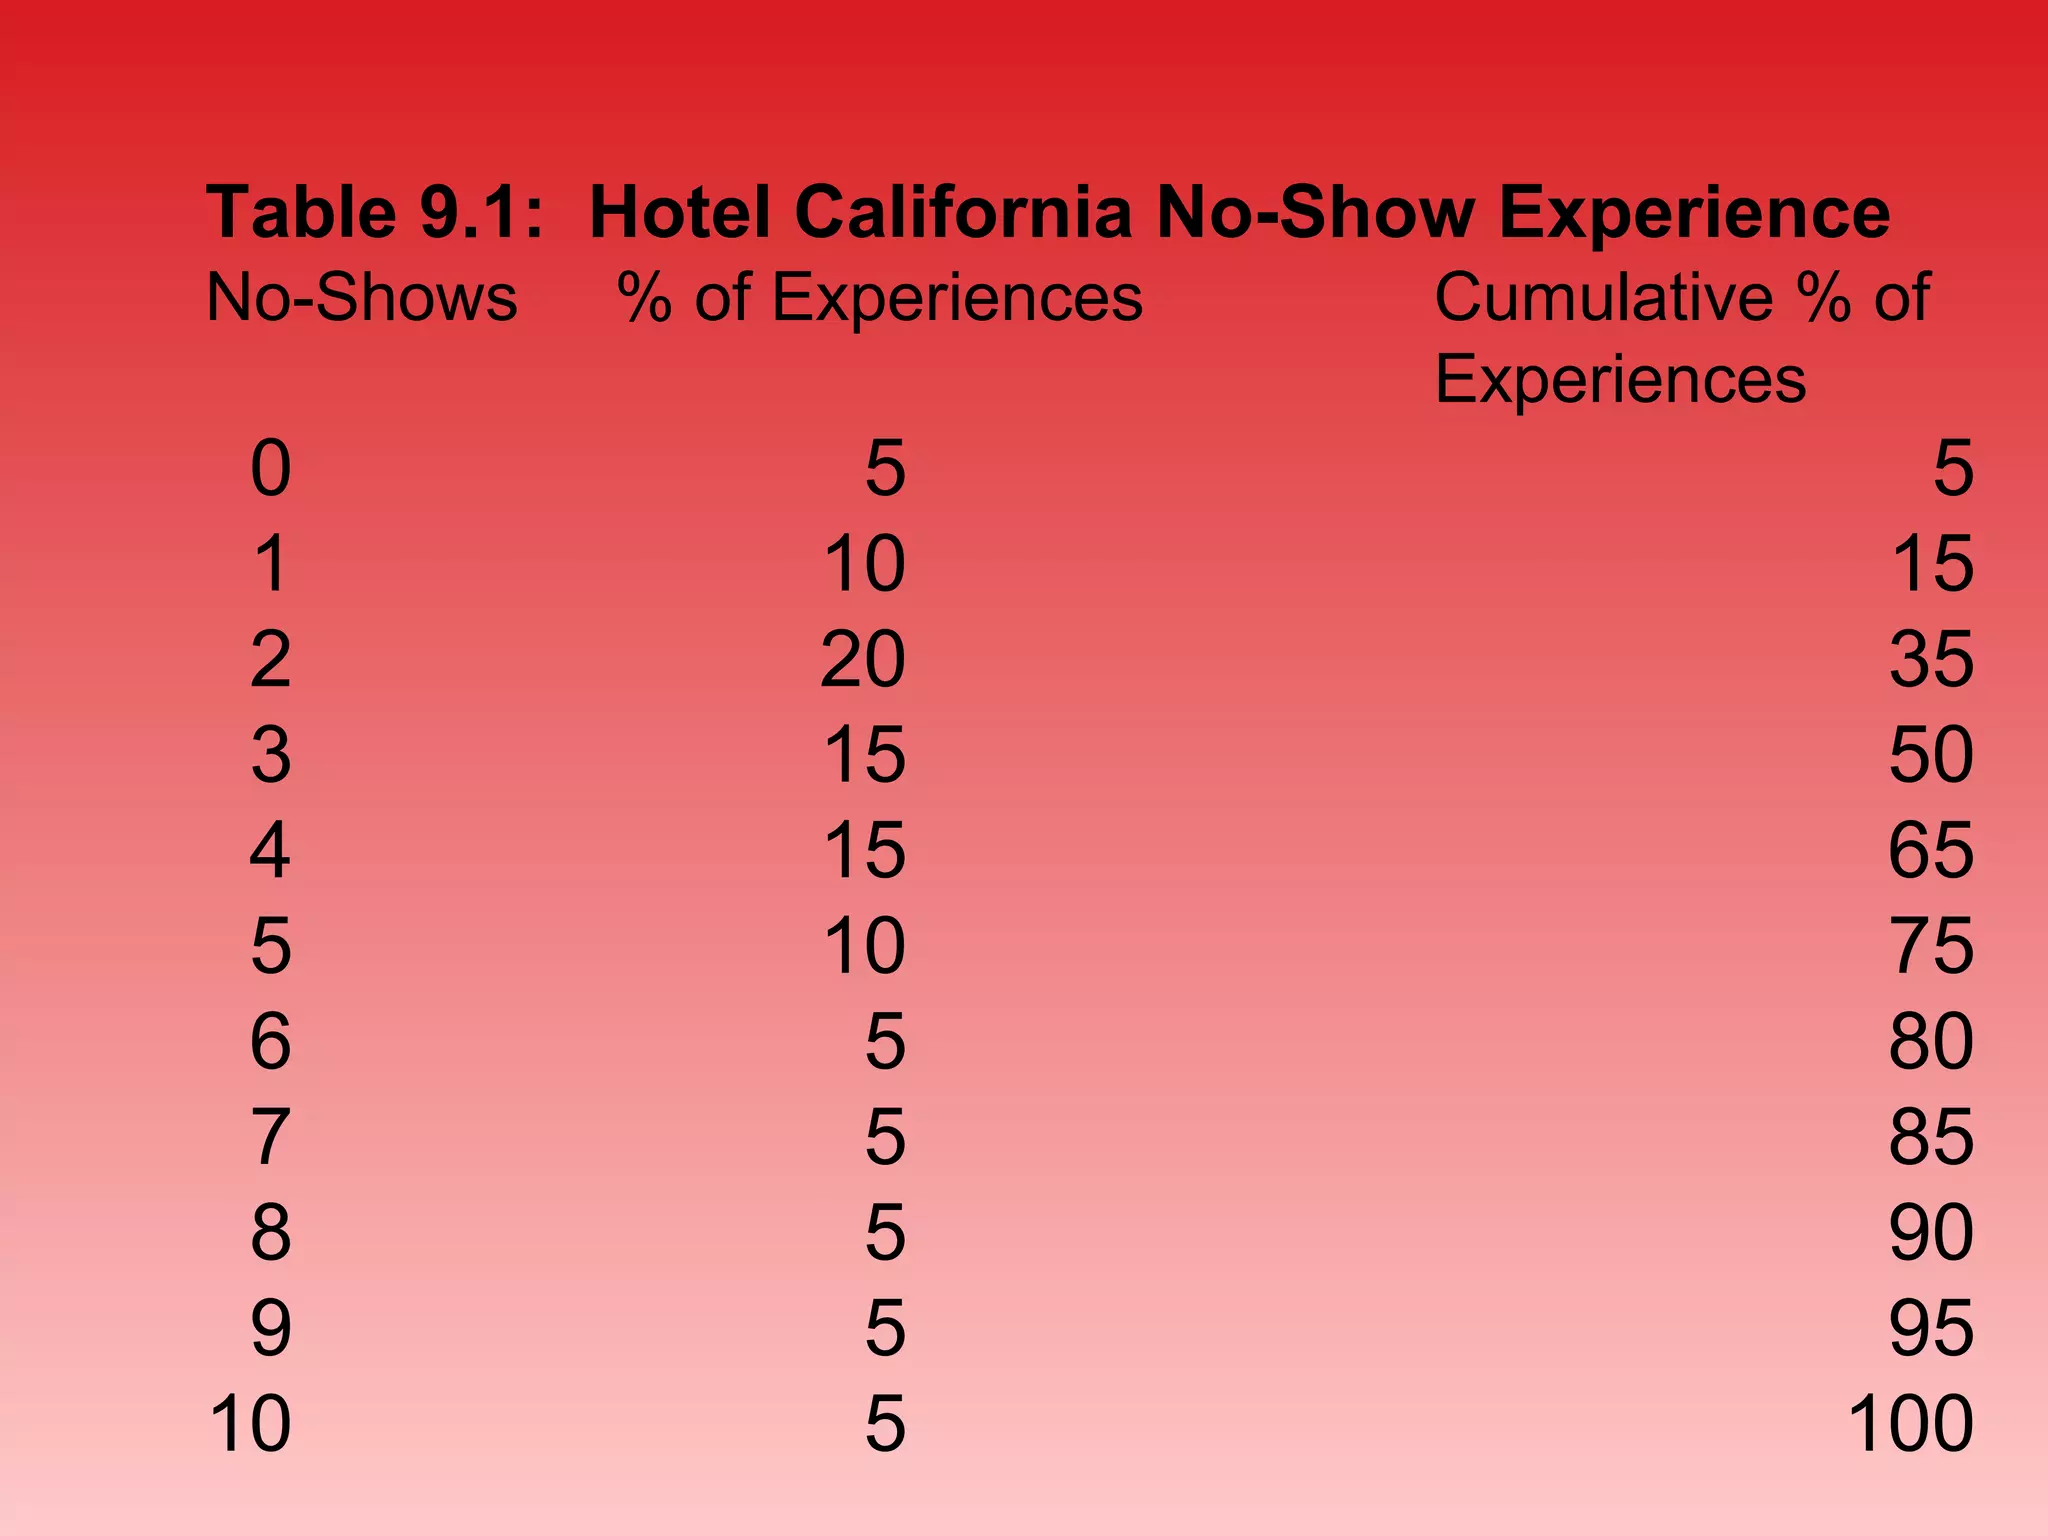
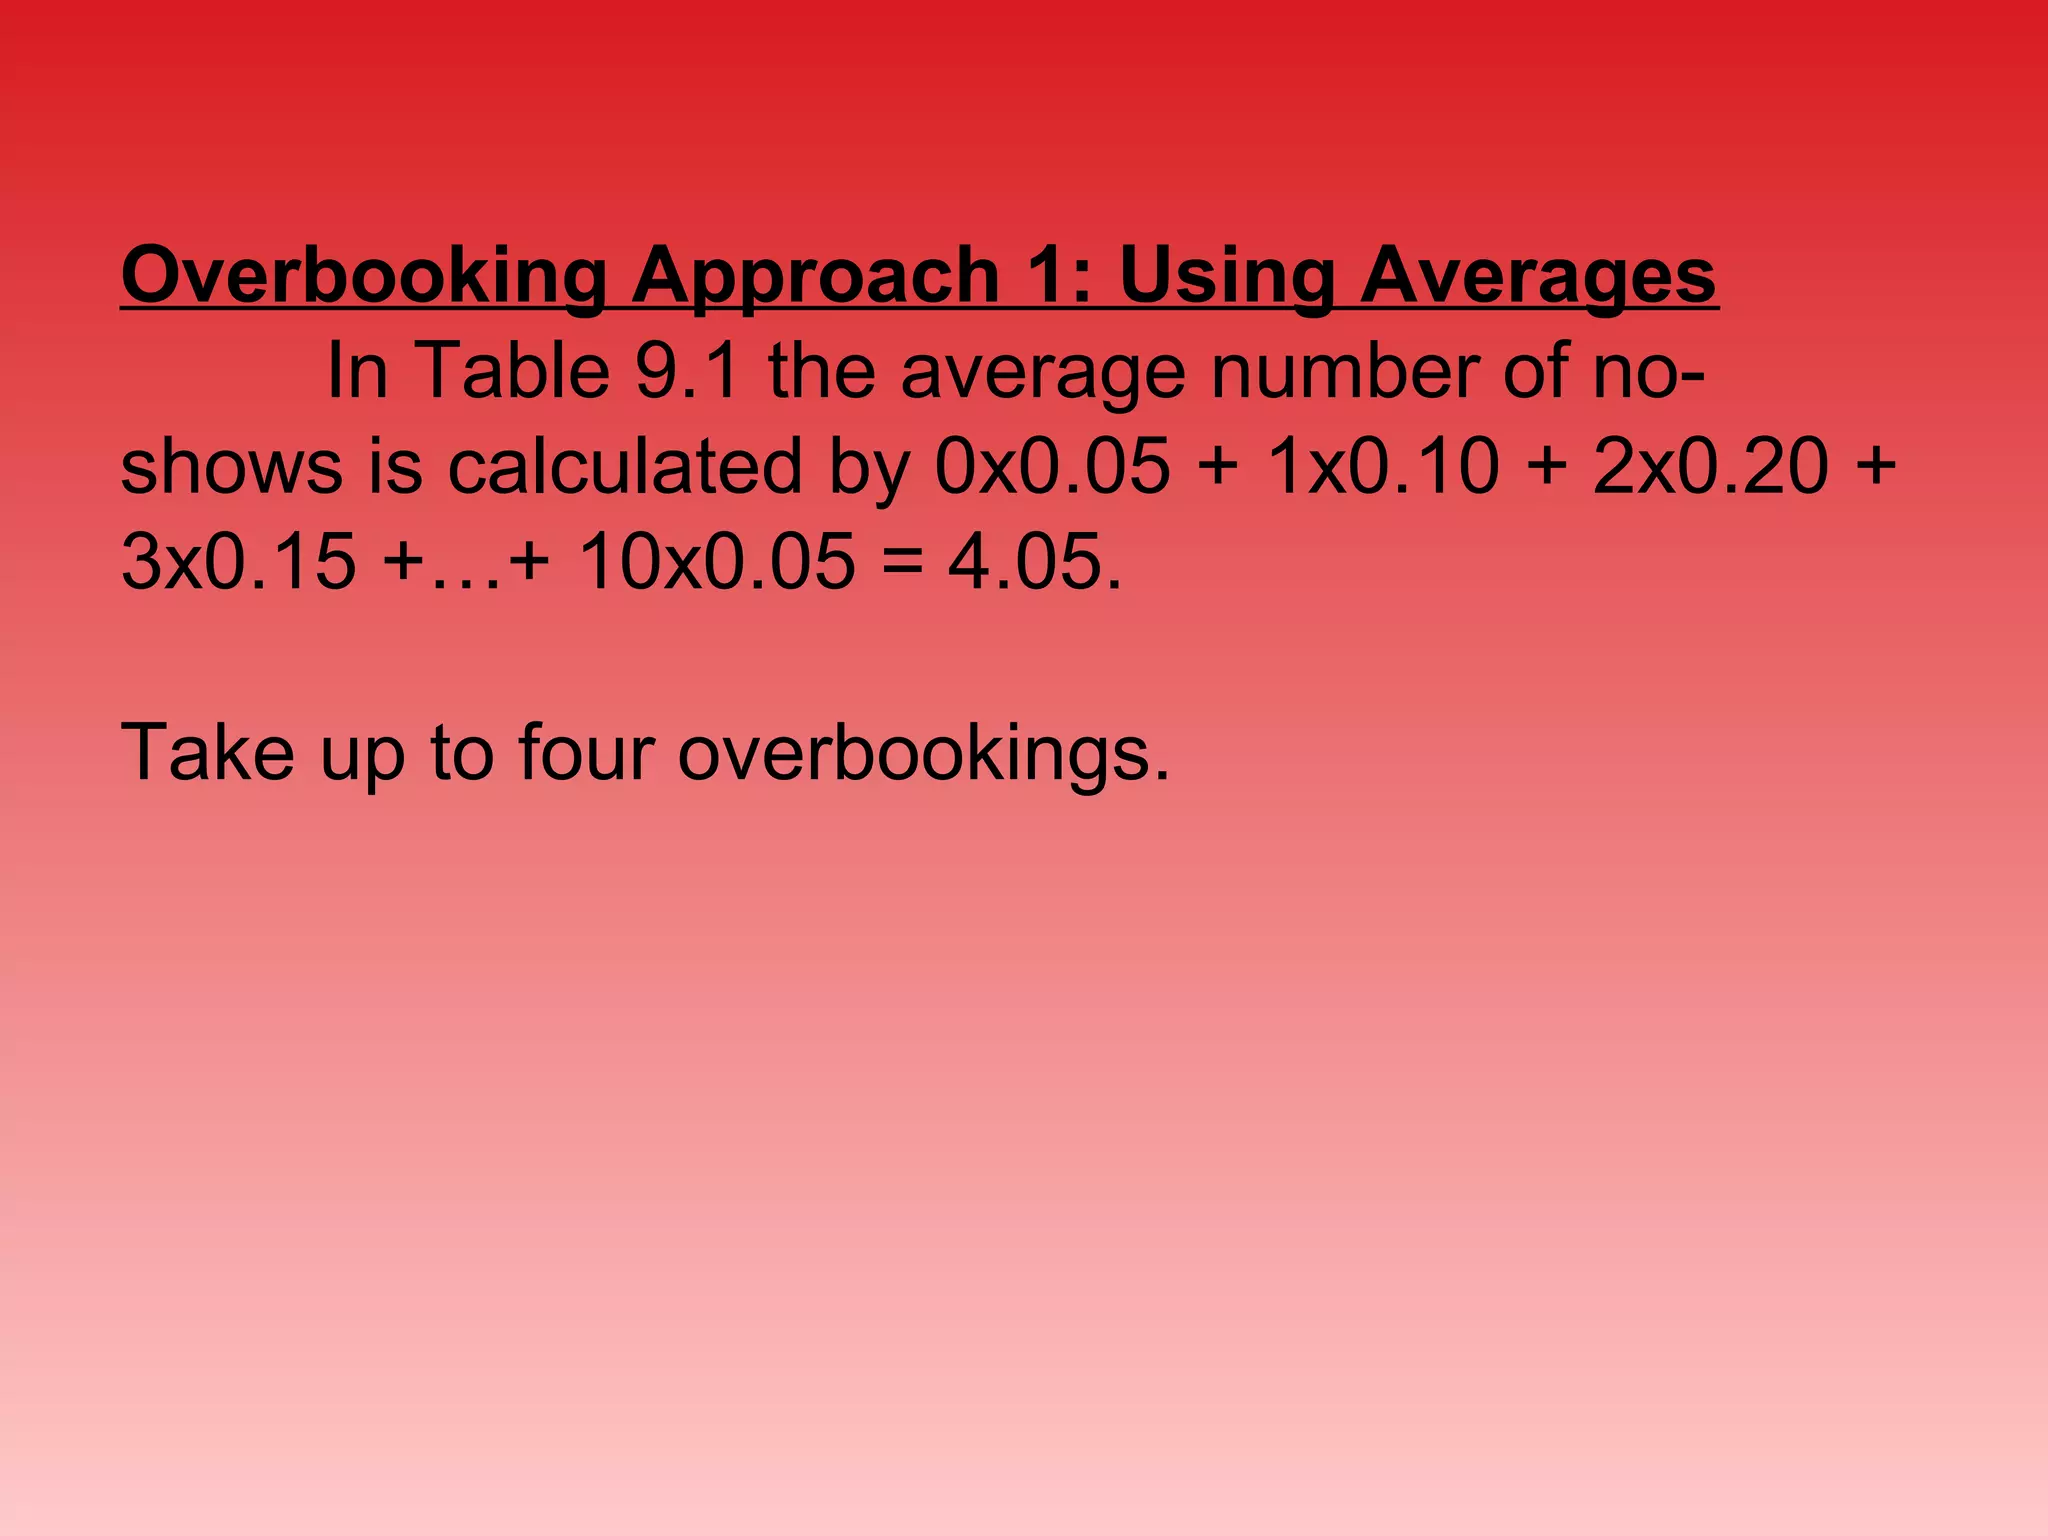
Downloaded 53 times


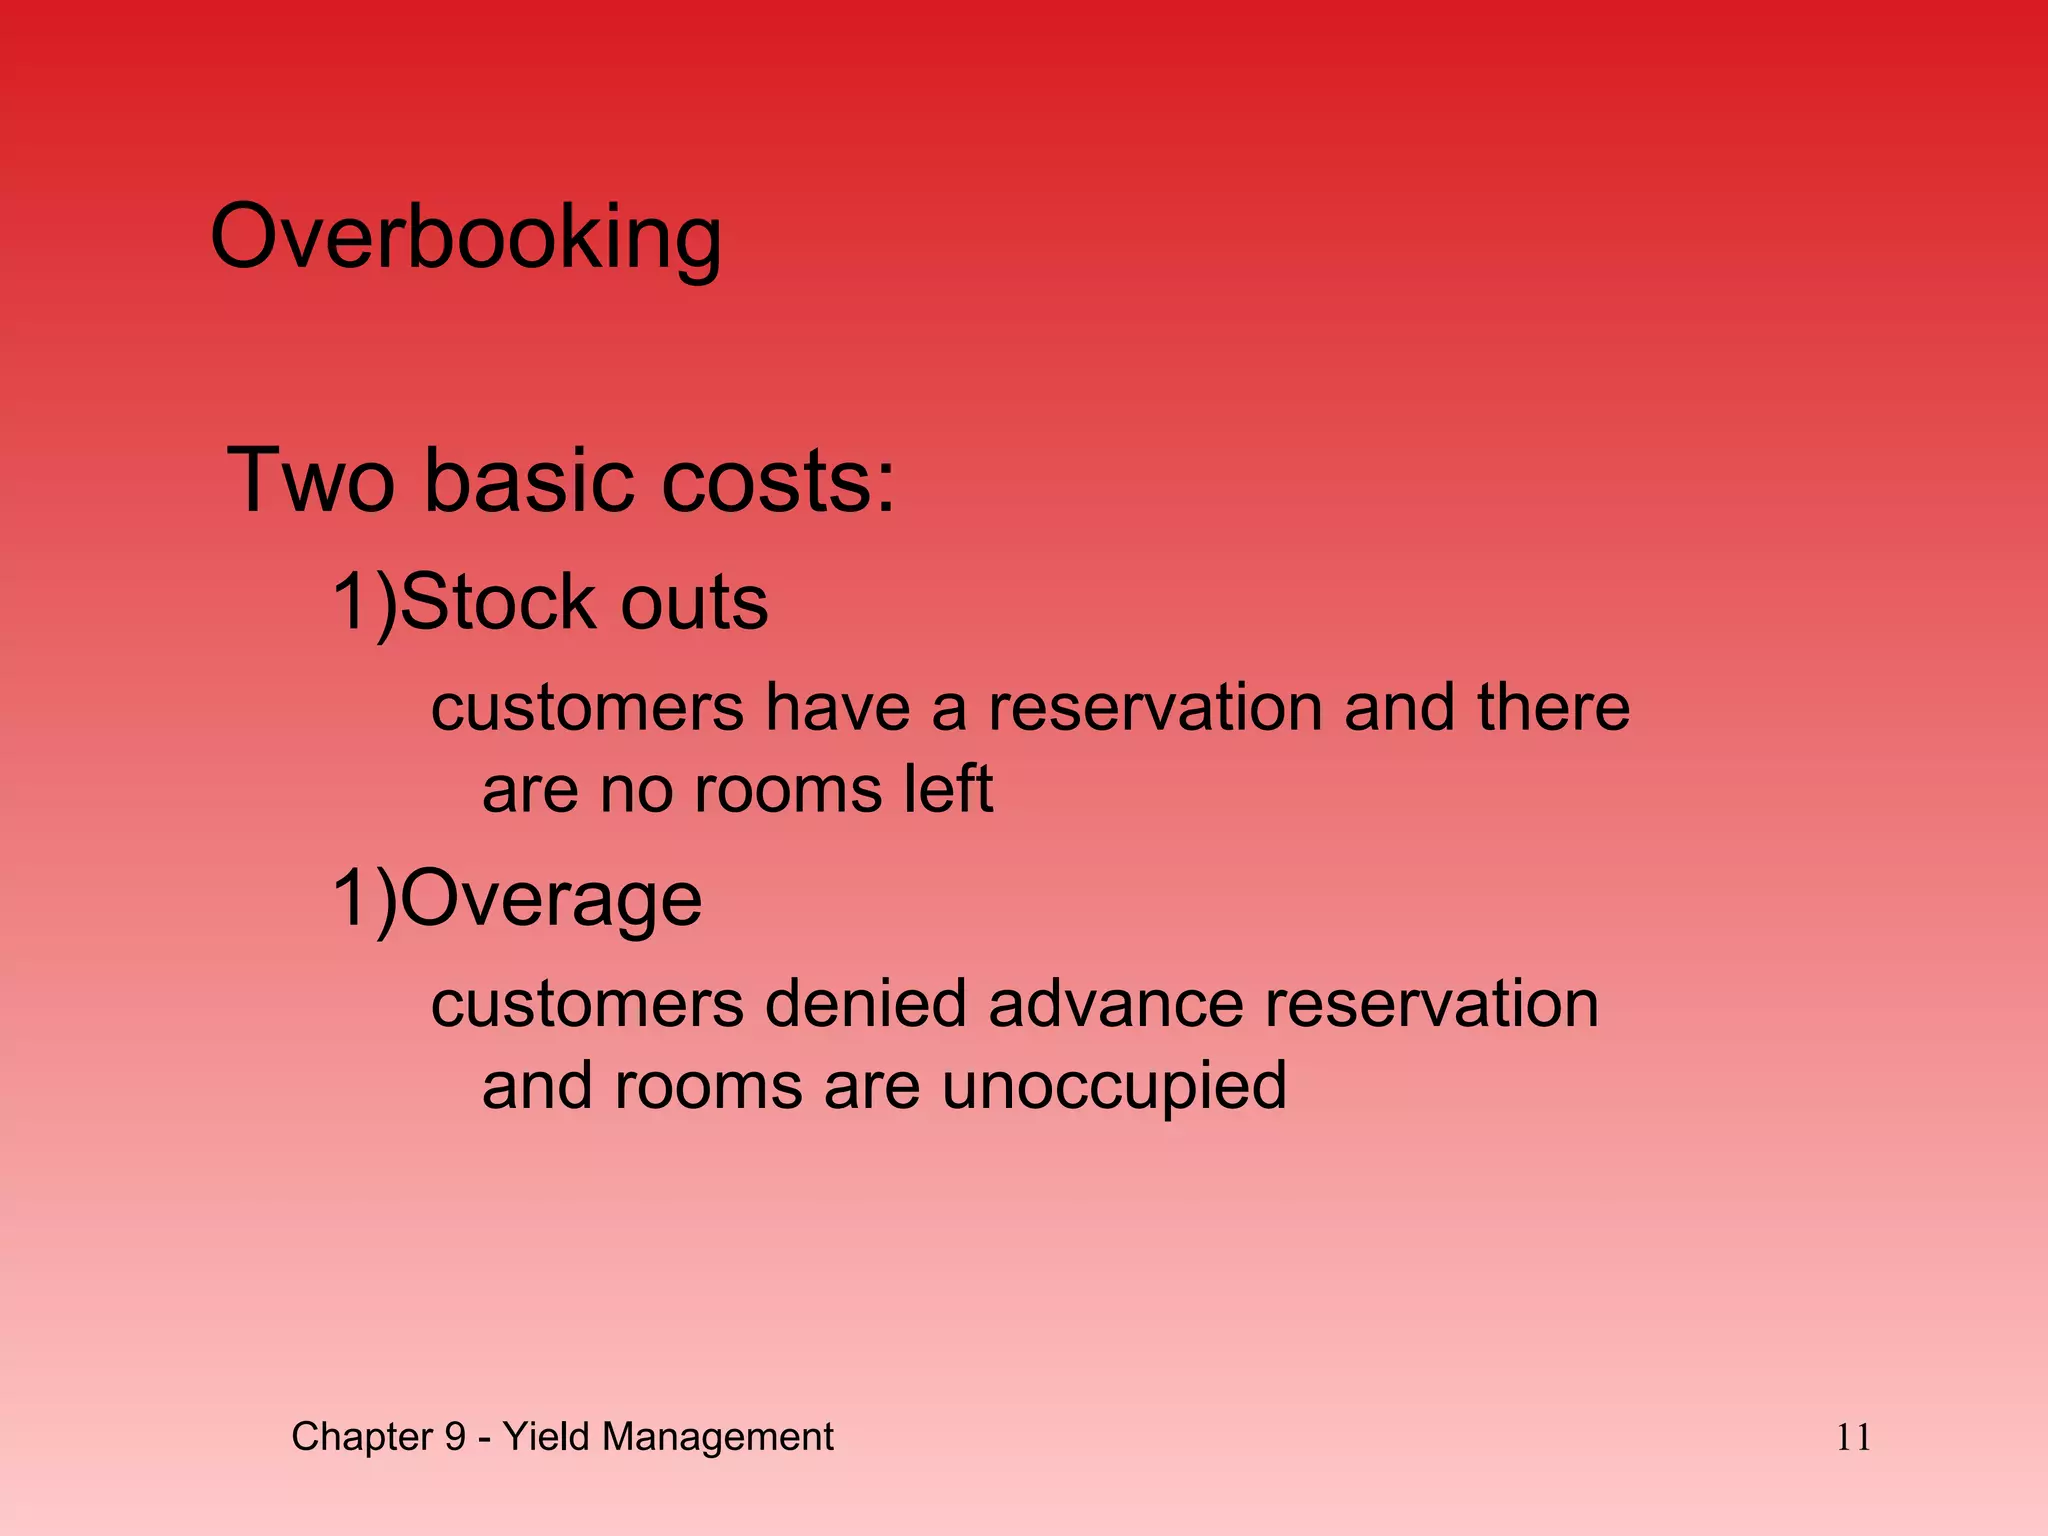


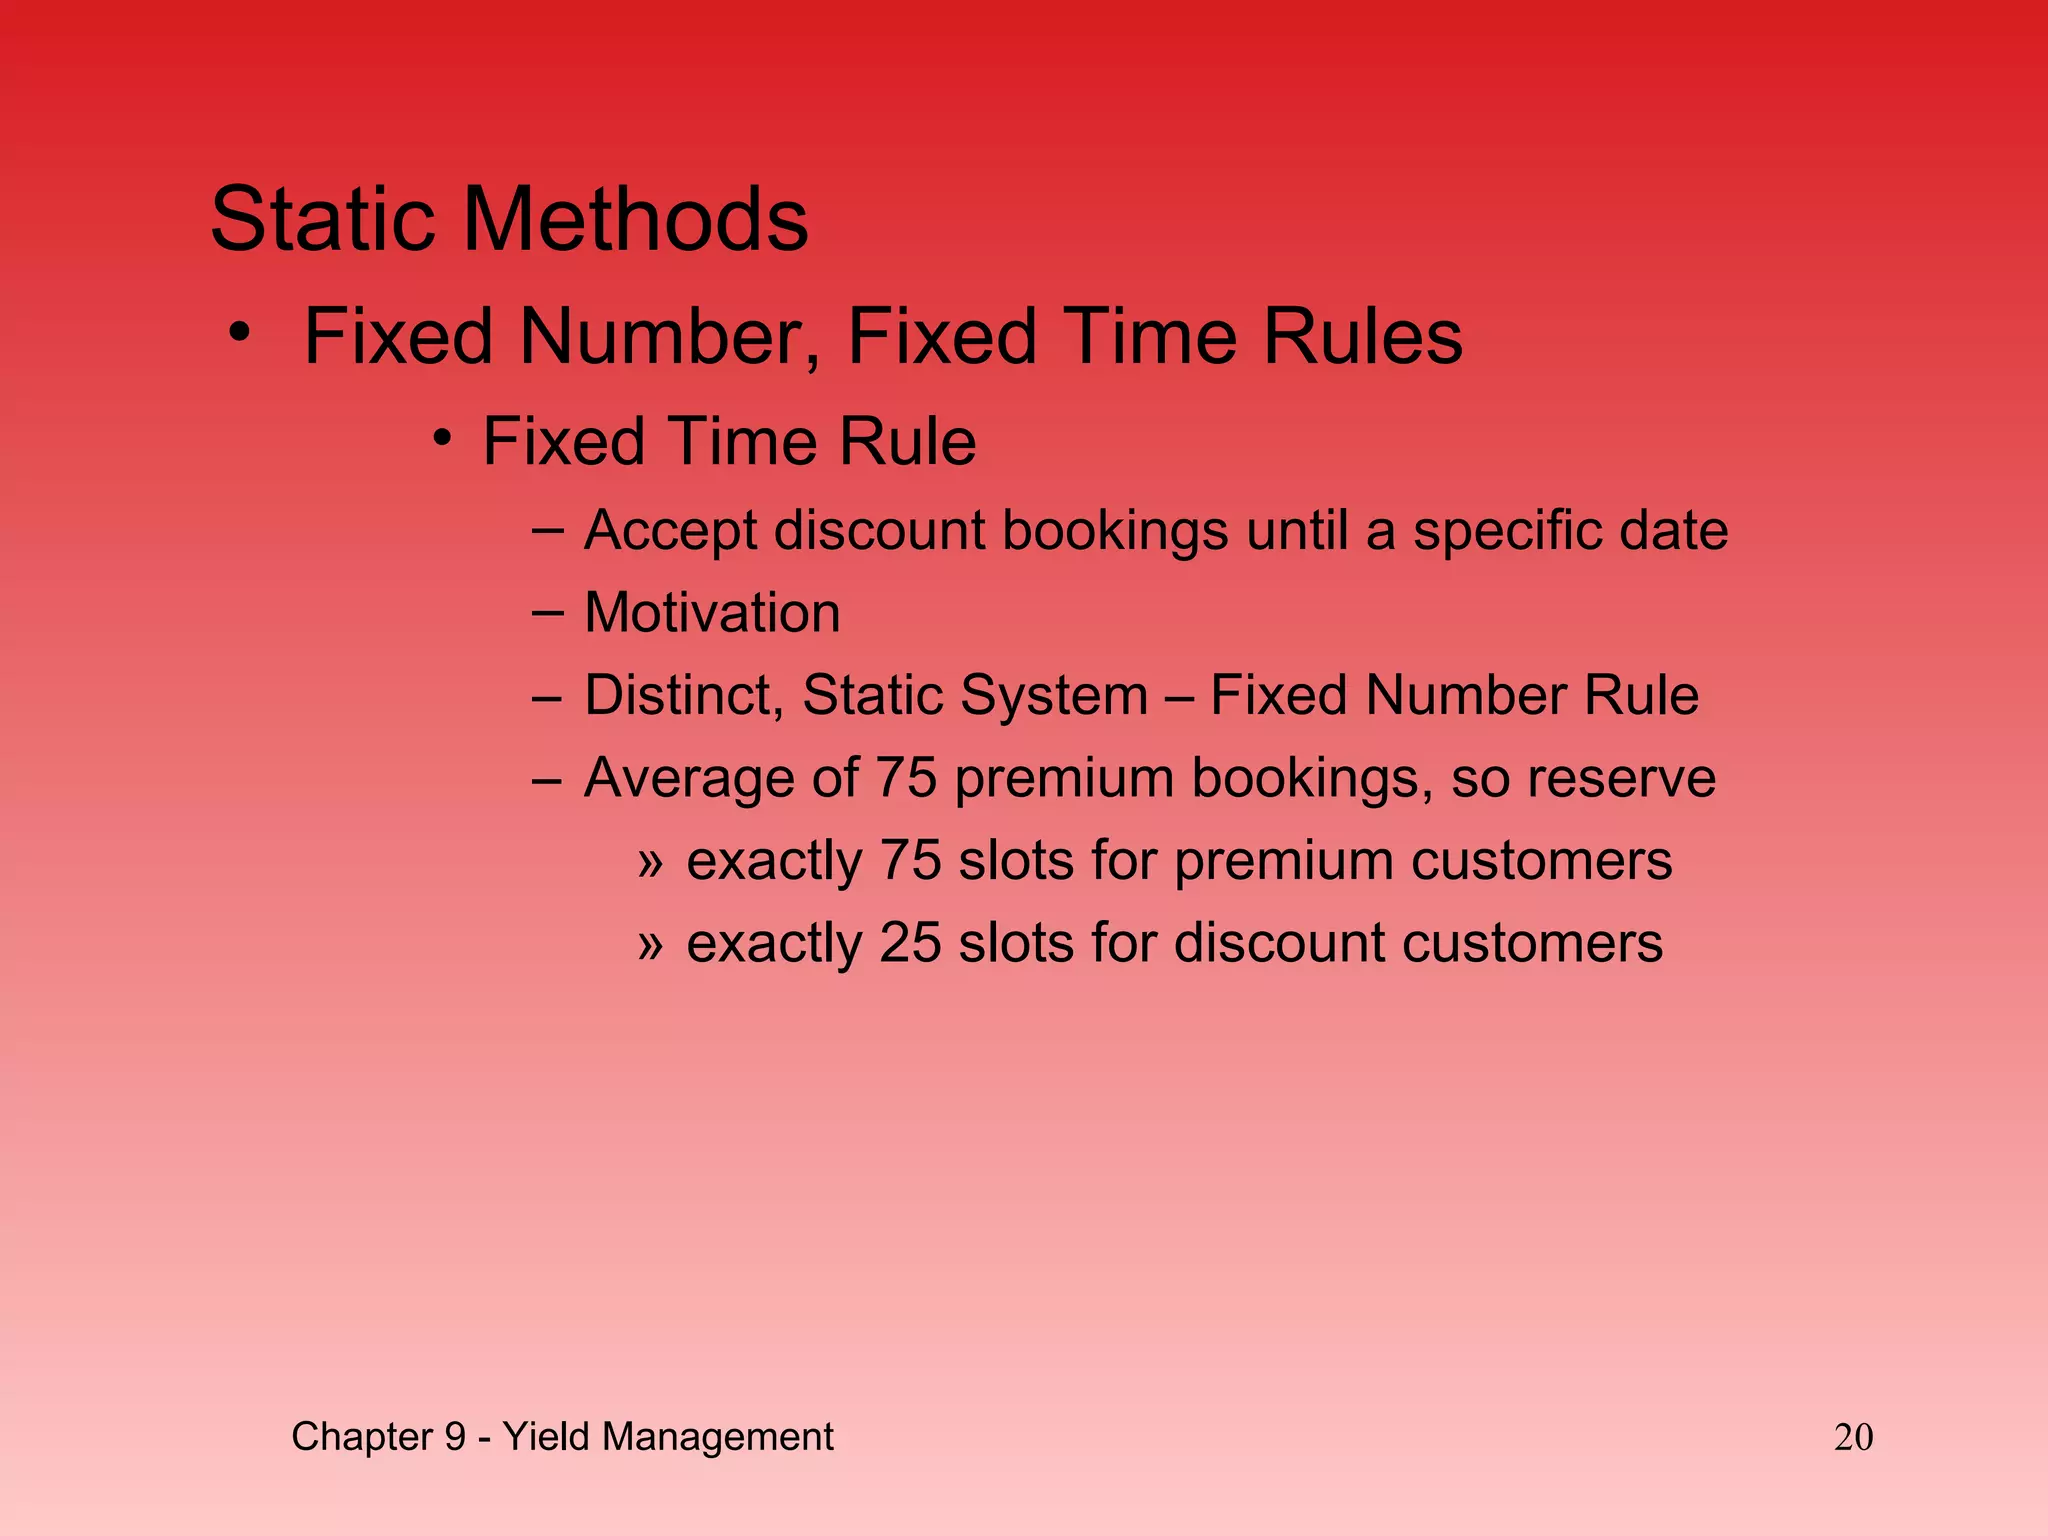
![Capacity Allocation with Exogenous Prices
Example (Chancey Travel)
Business capacity = 100
Demand forecast: premium profit ($10,000/seat)
demand: uniformly distributed (51, 100)
[meaning: 2% chance demand = 51, 2% chance
demand = 52,…, 2% chance demand = 100,
average demand = 75]
Discount price ($2,500/seat) demand:
unlimited demand at this price – infinite
discounters book earlier than premium
Chapter 9 - Yield Management 19](https://image.slidesharecdn.com/yieldmanagementppp-150528151941-lva1-app6892/75/Yield-management-23-2048.jpg)
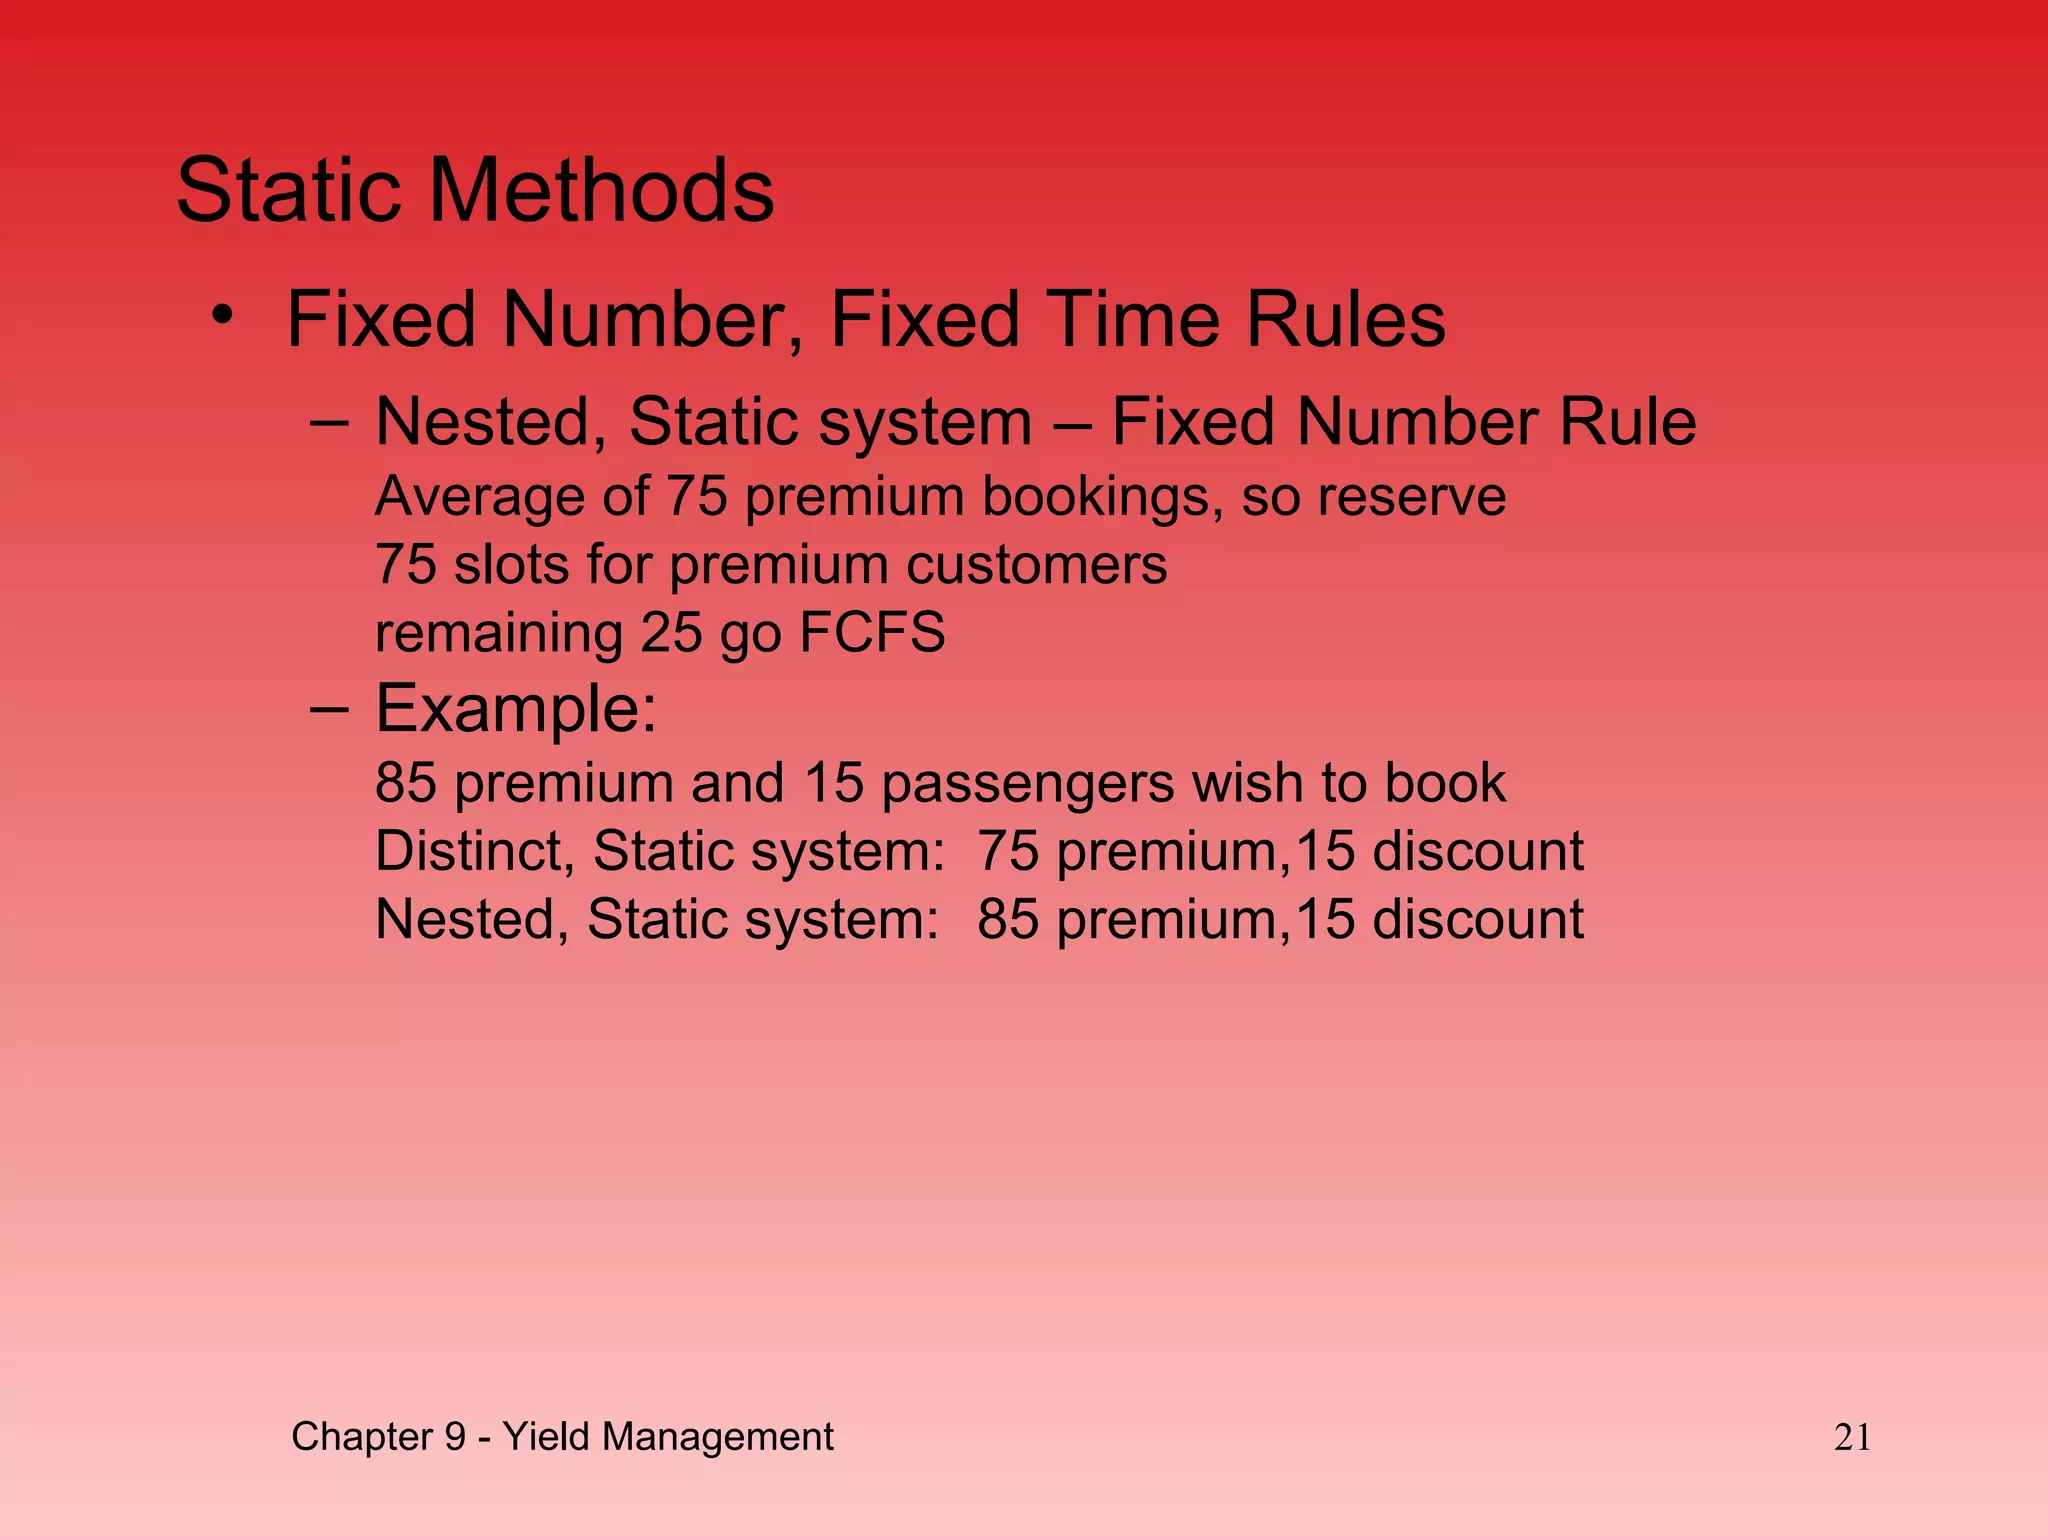
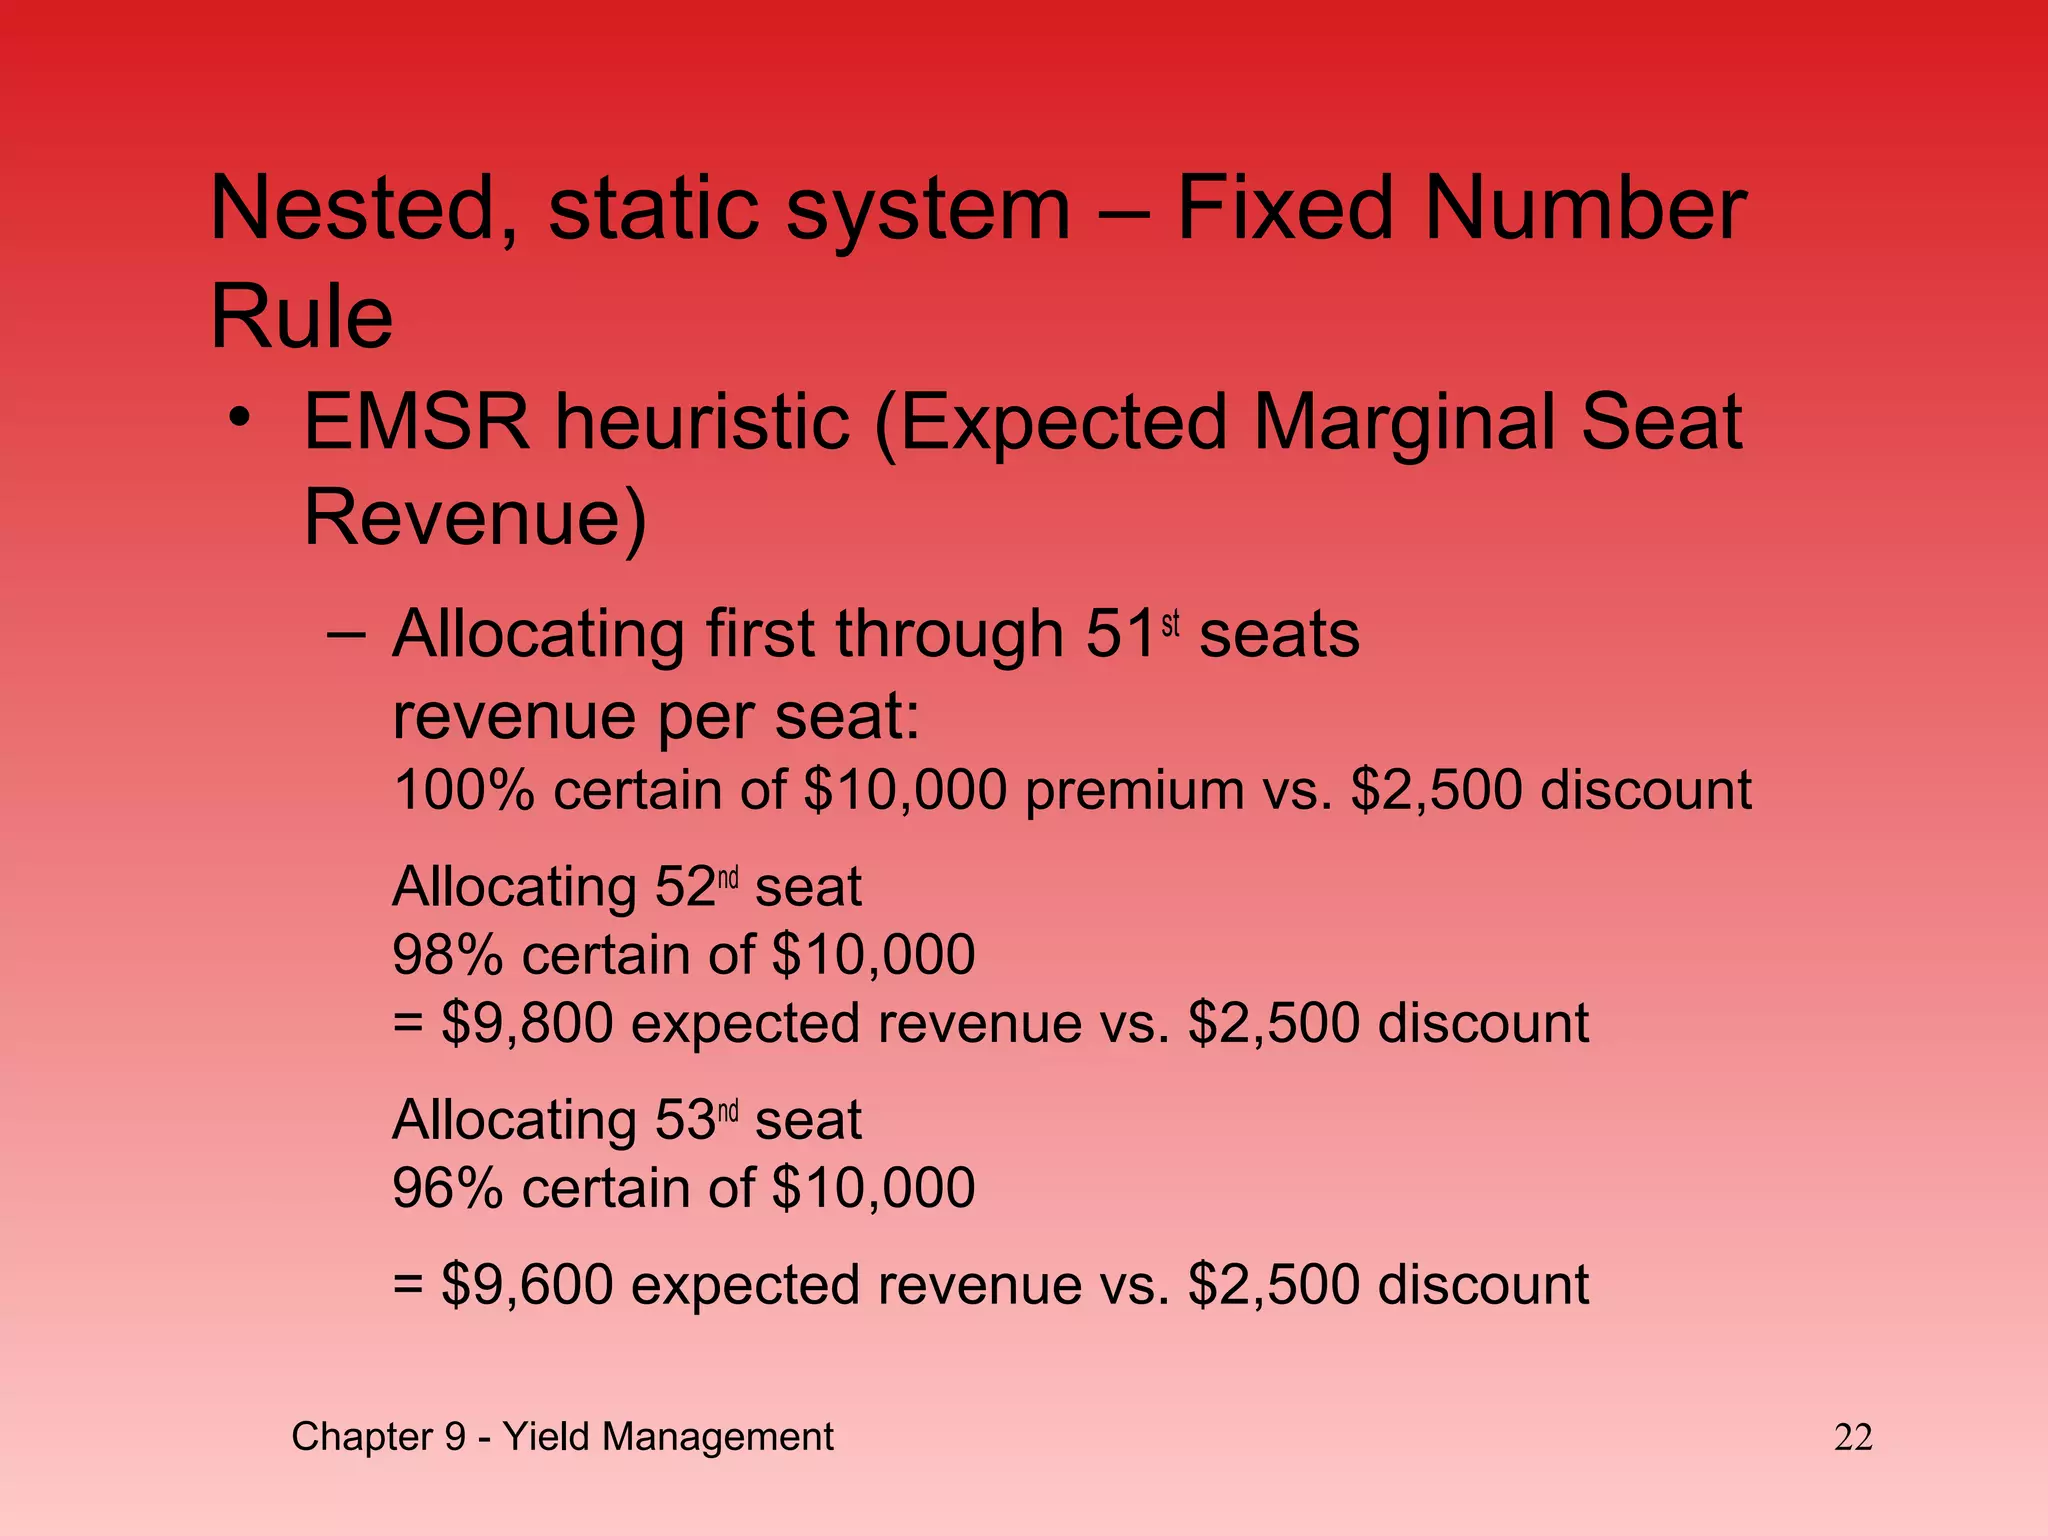
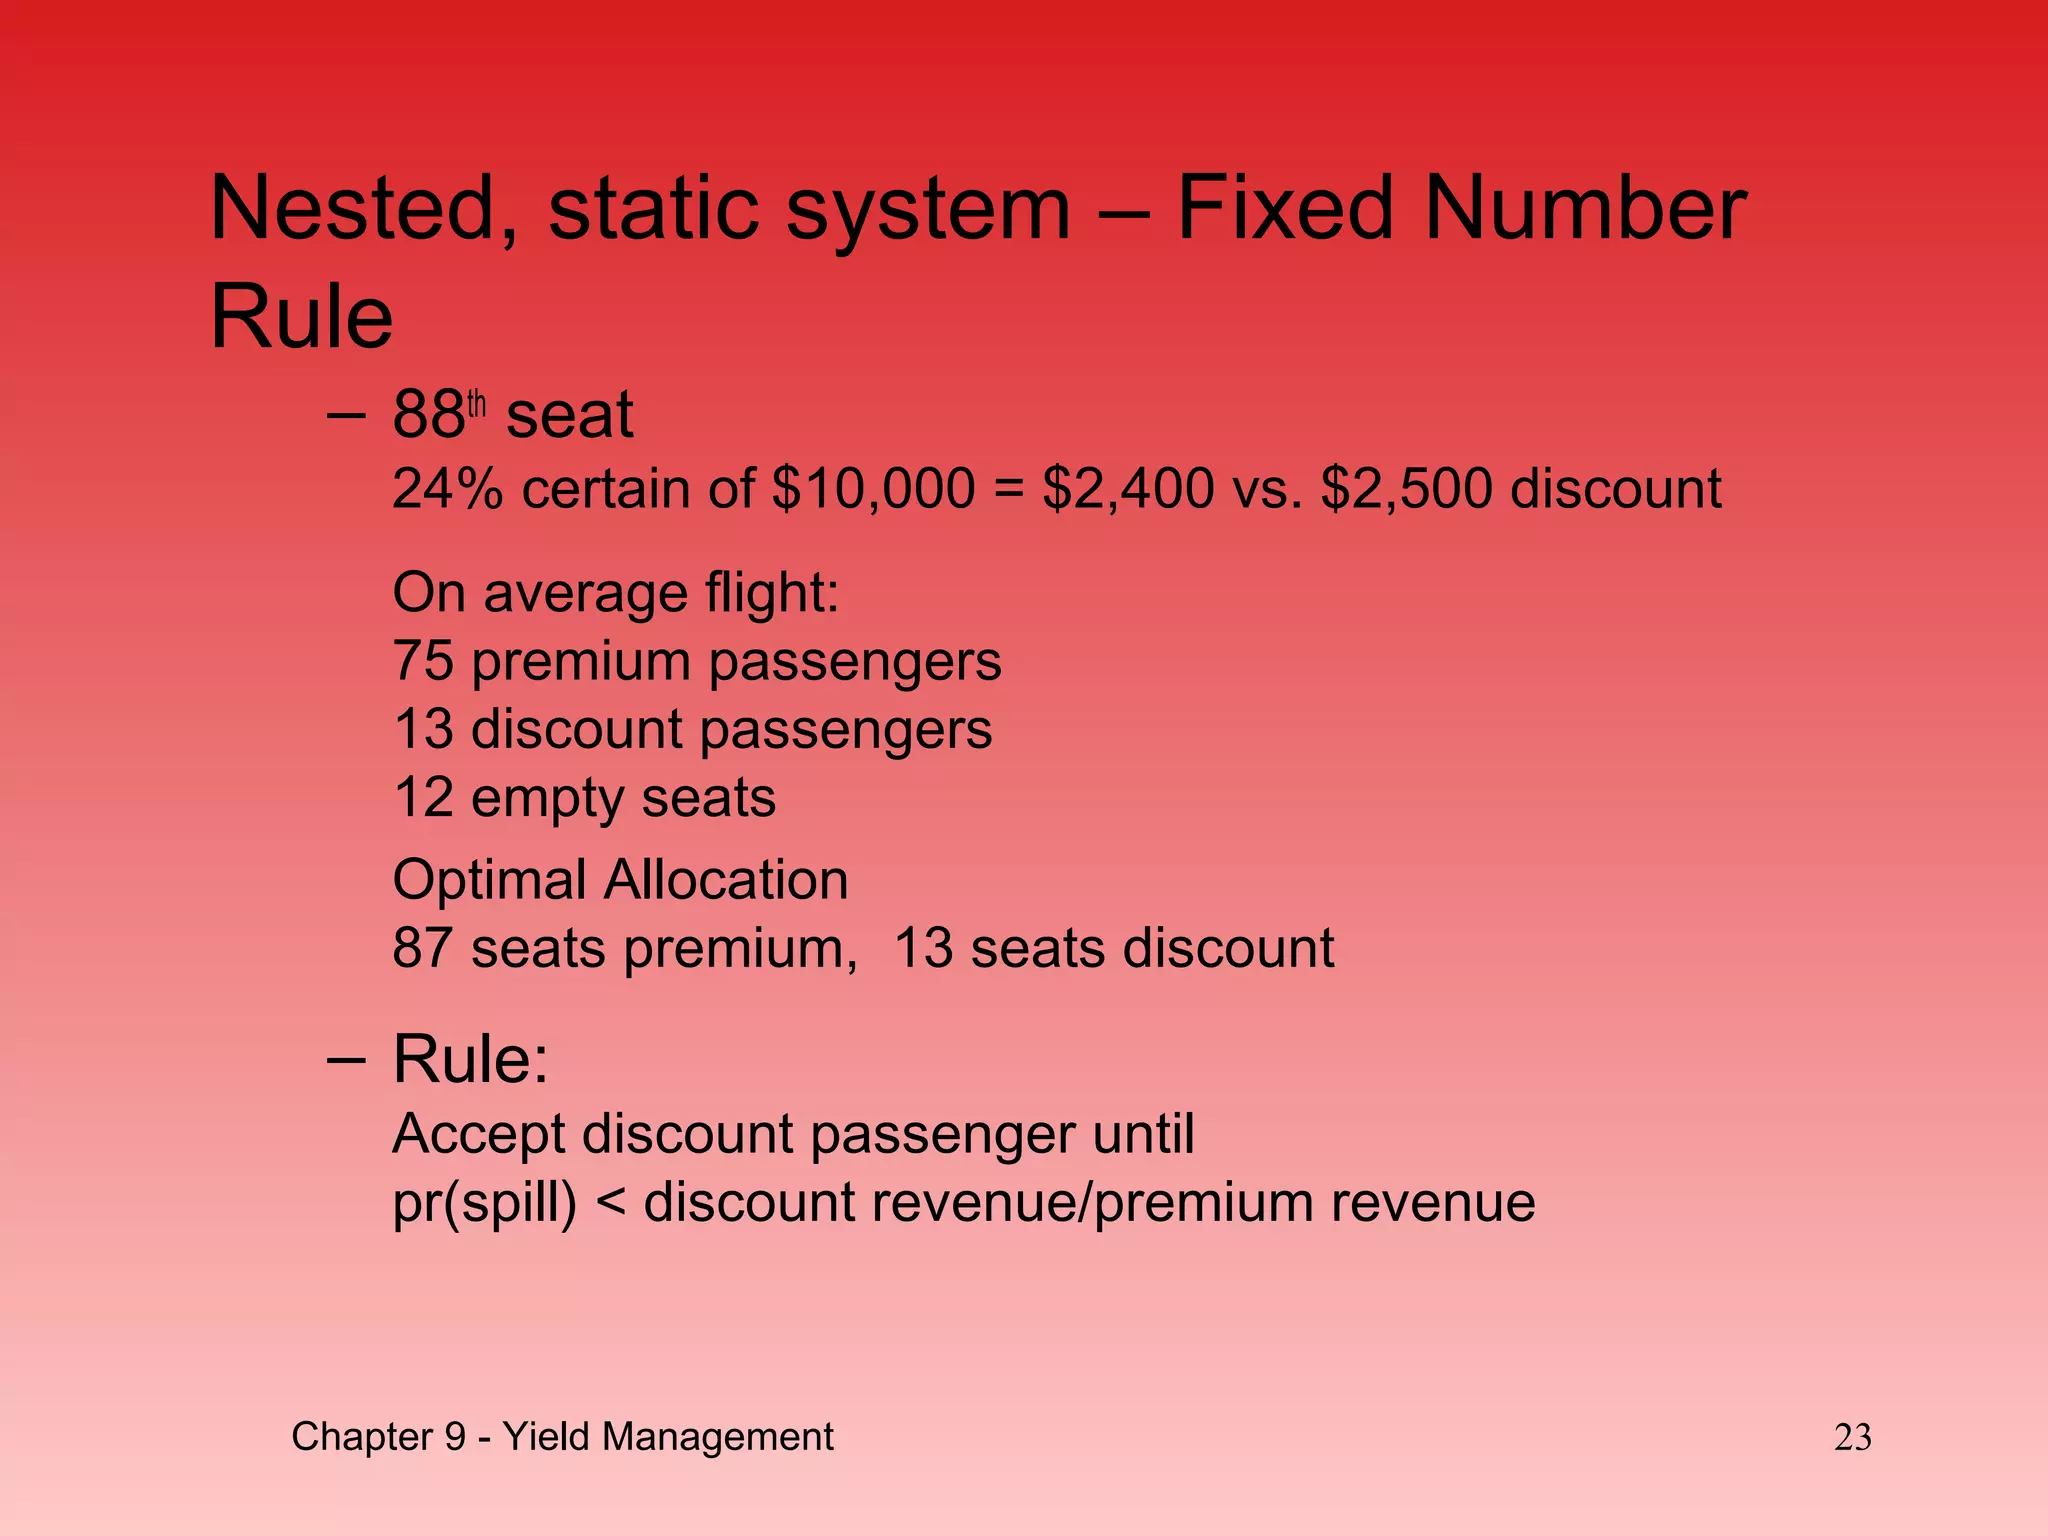


This document discusses yield management techniques used by industries with limited fixed capacity to maximize revenue. It covers key aspects of yield management including overbooking, pricing strategies, and capacity allocation. Static and dynamic methods for allocating capacity between customer segments are presented, along with examples showing how adjusting prices and allocating capacity can increase total revenue compared to unsegmented approaches. Implementation challenges of yield management techniques are also outlined.