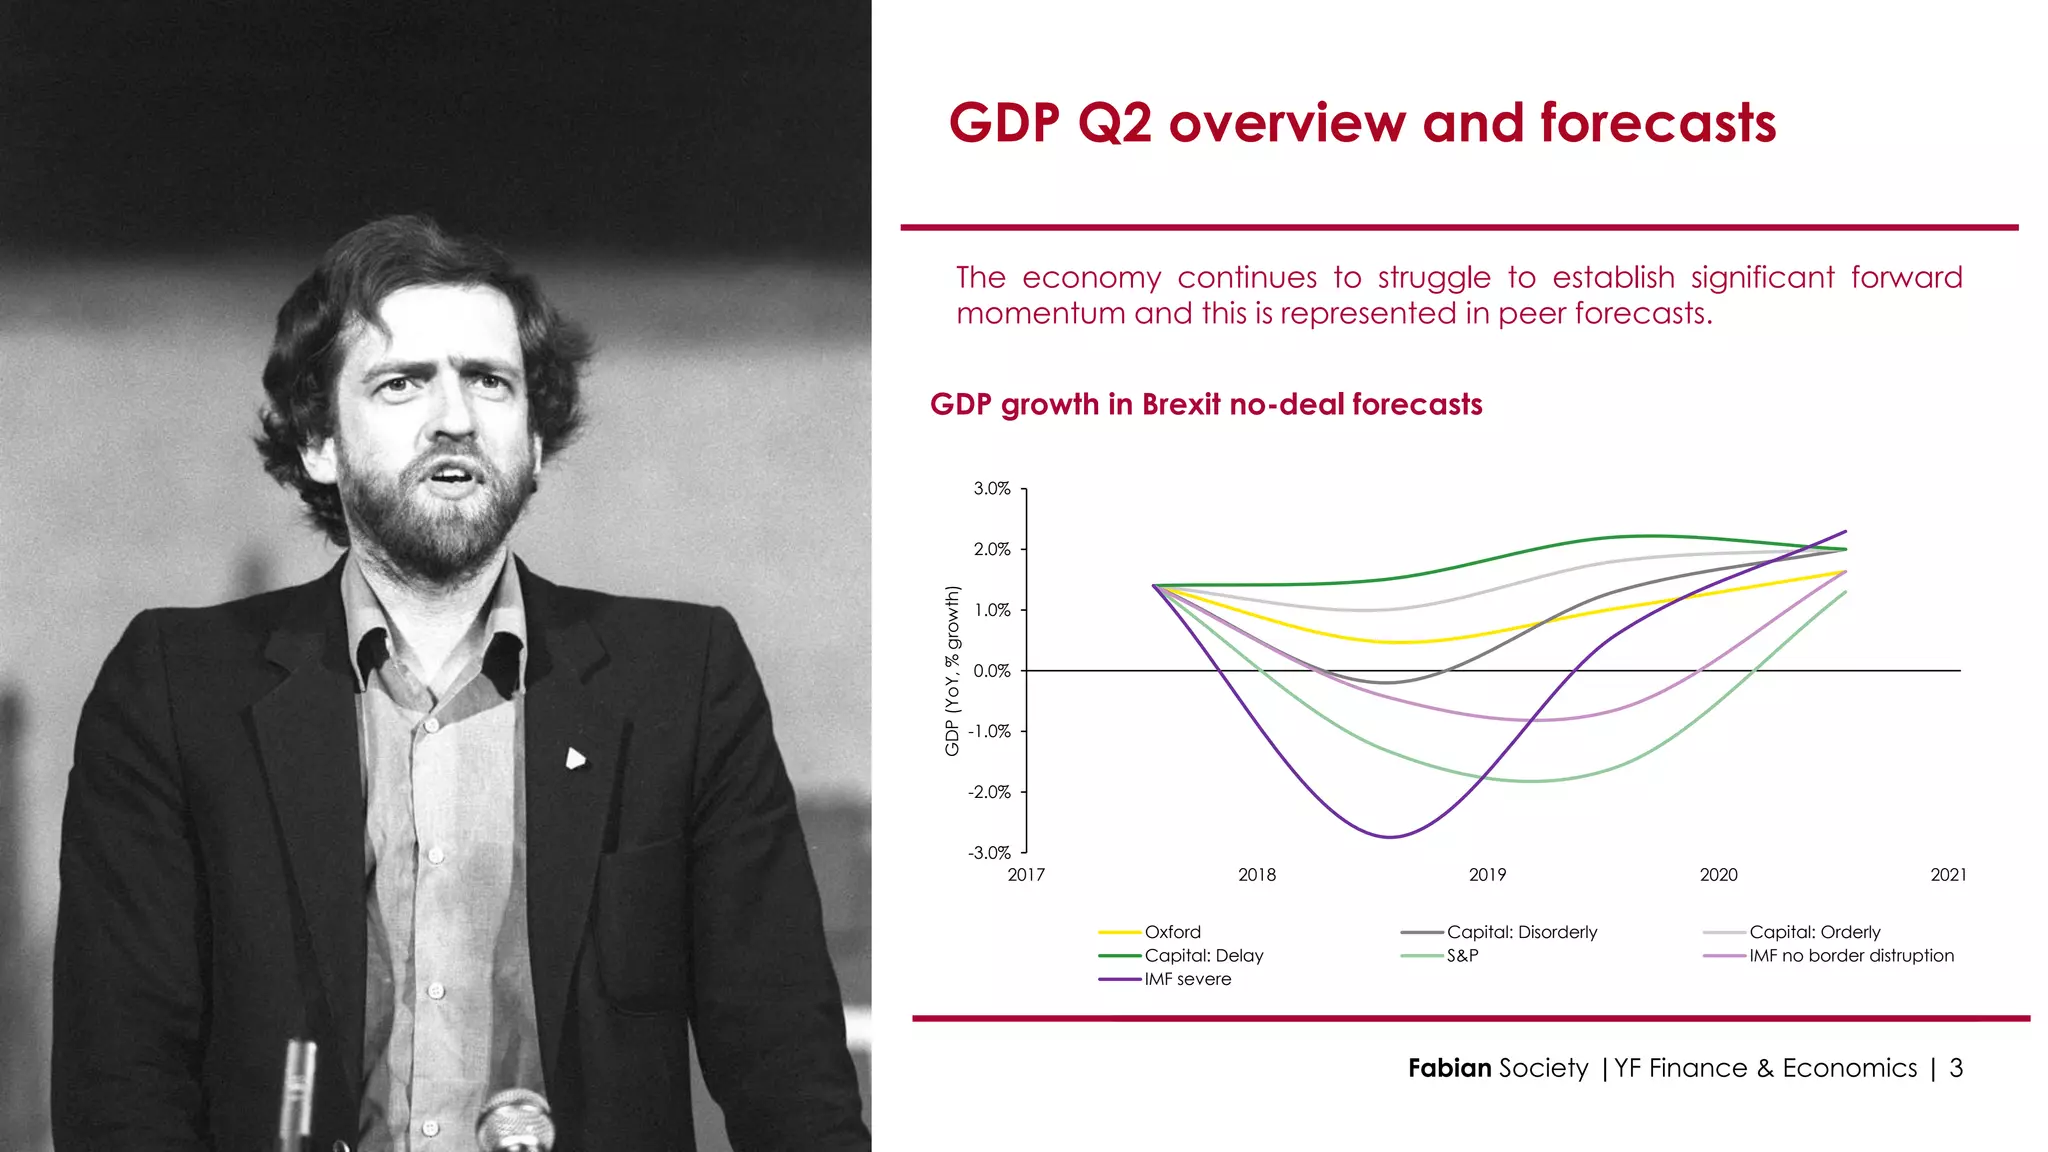
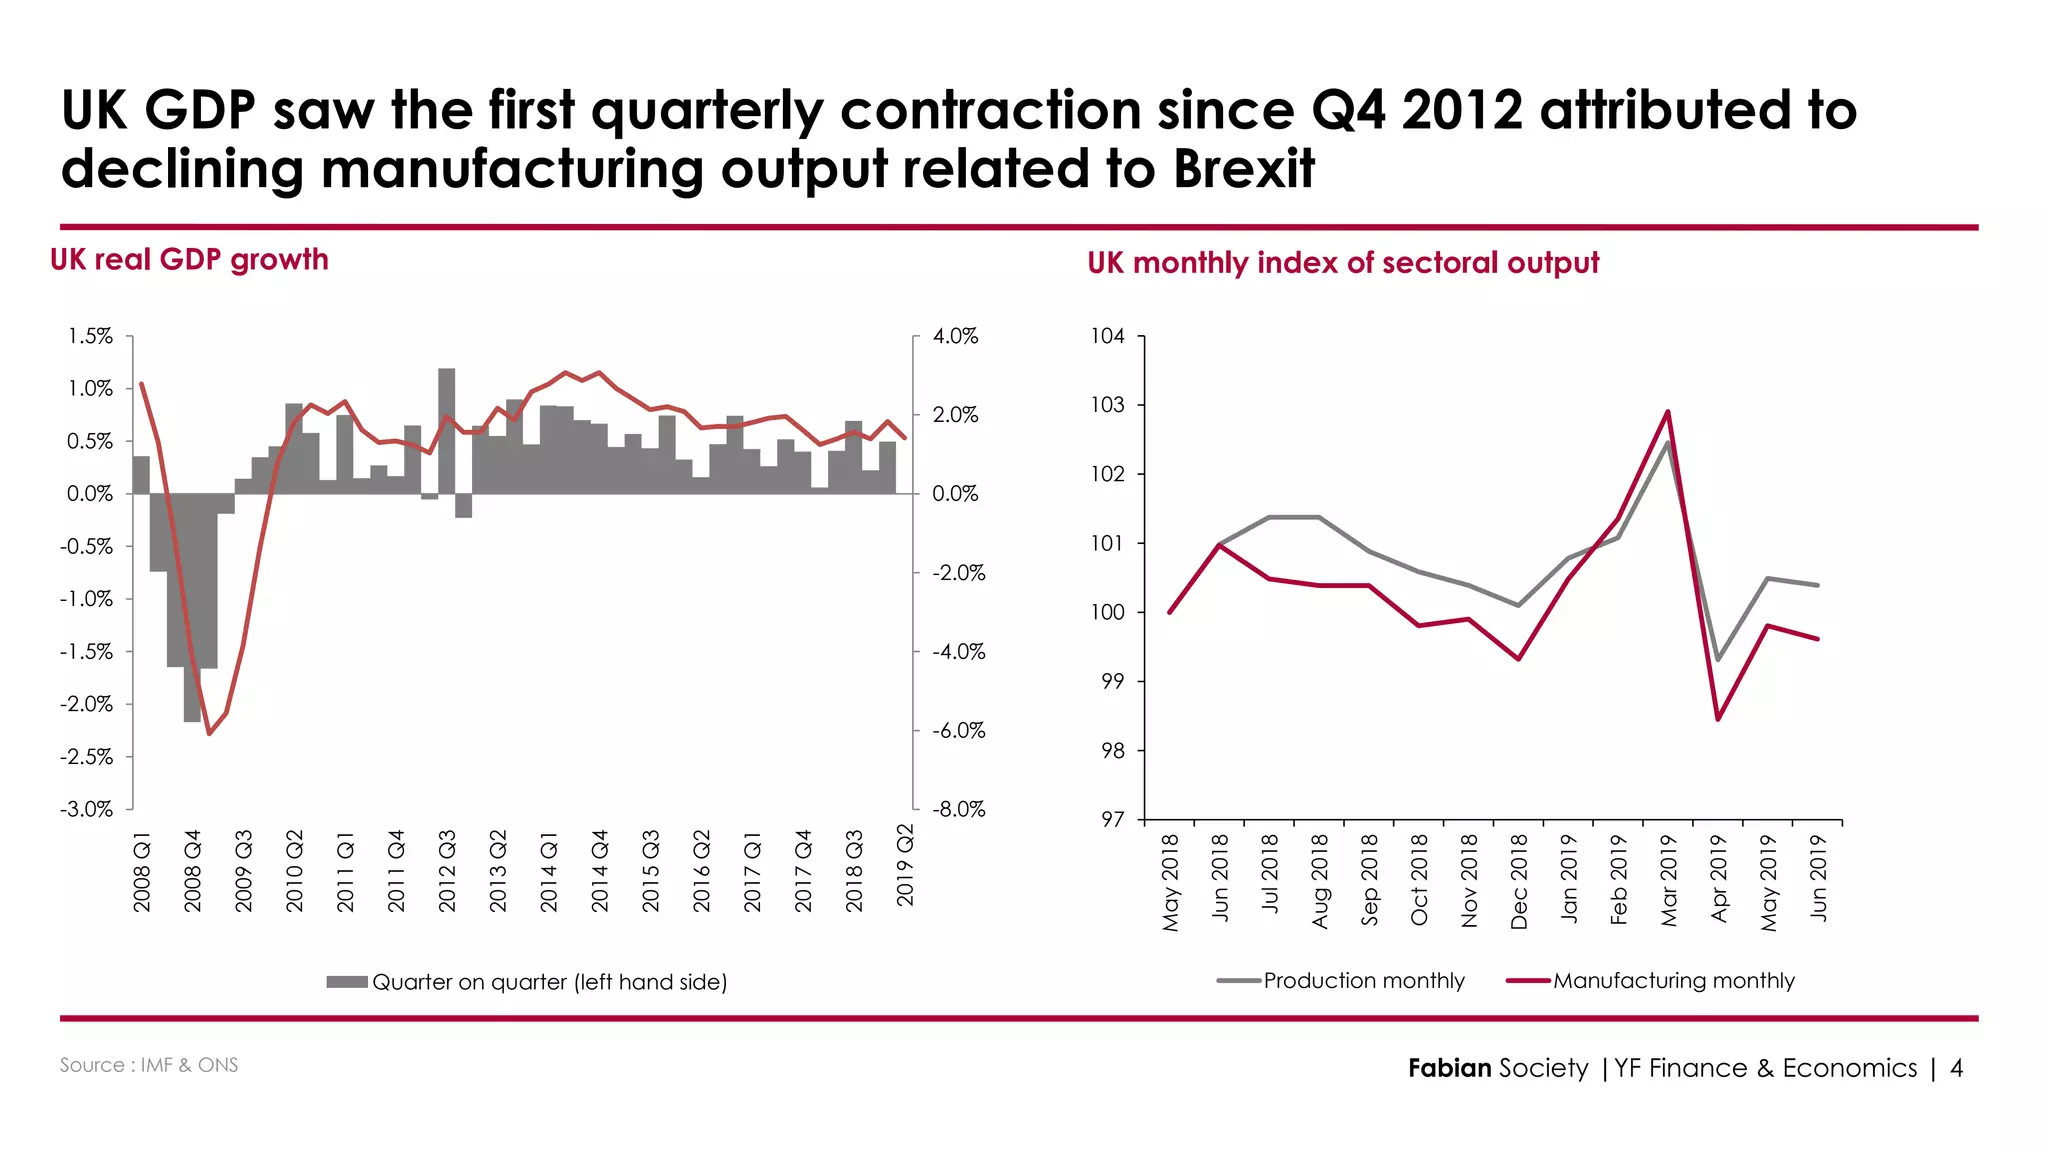
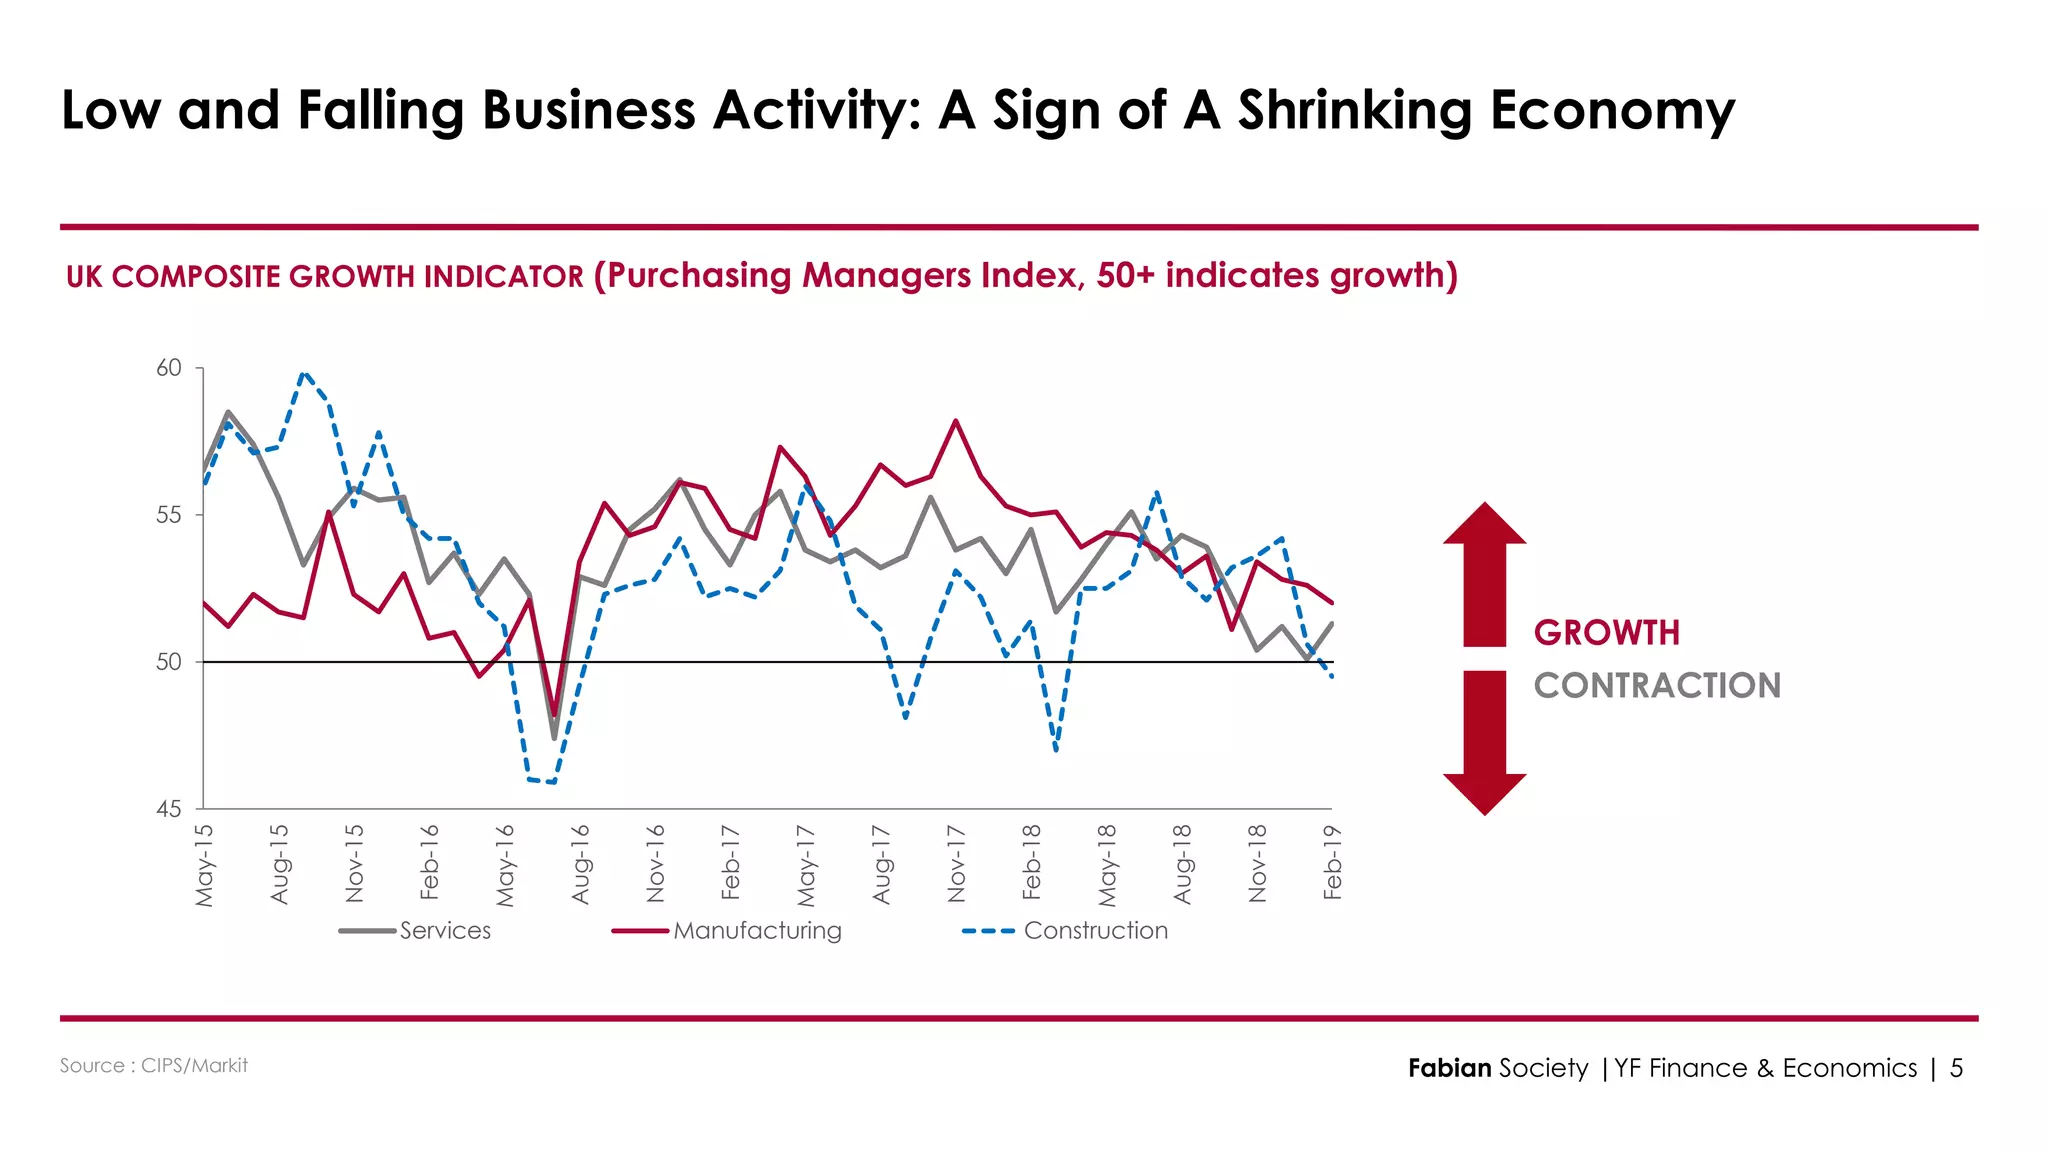
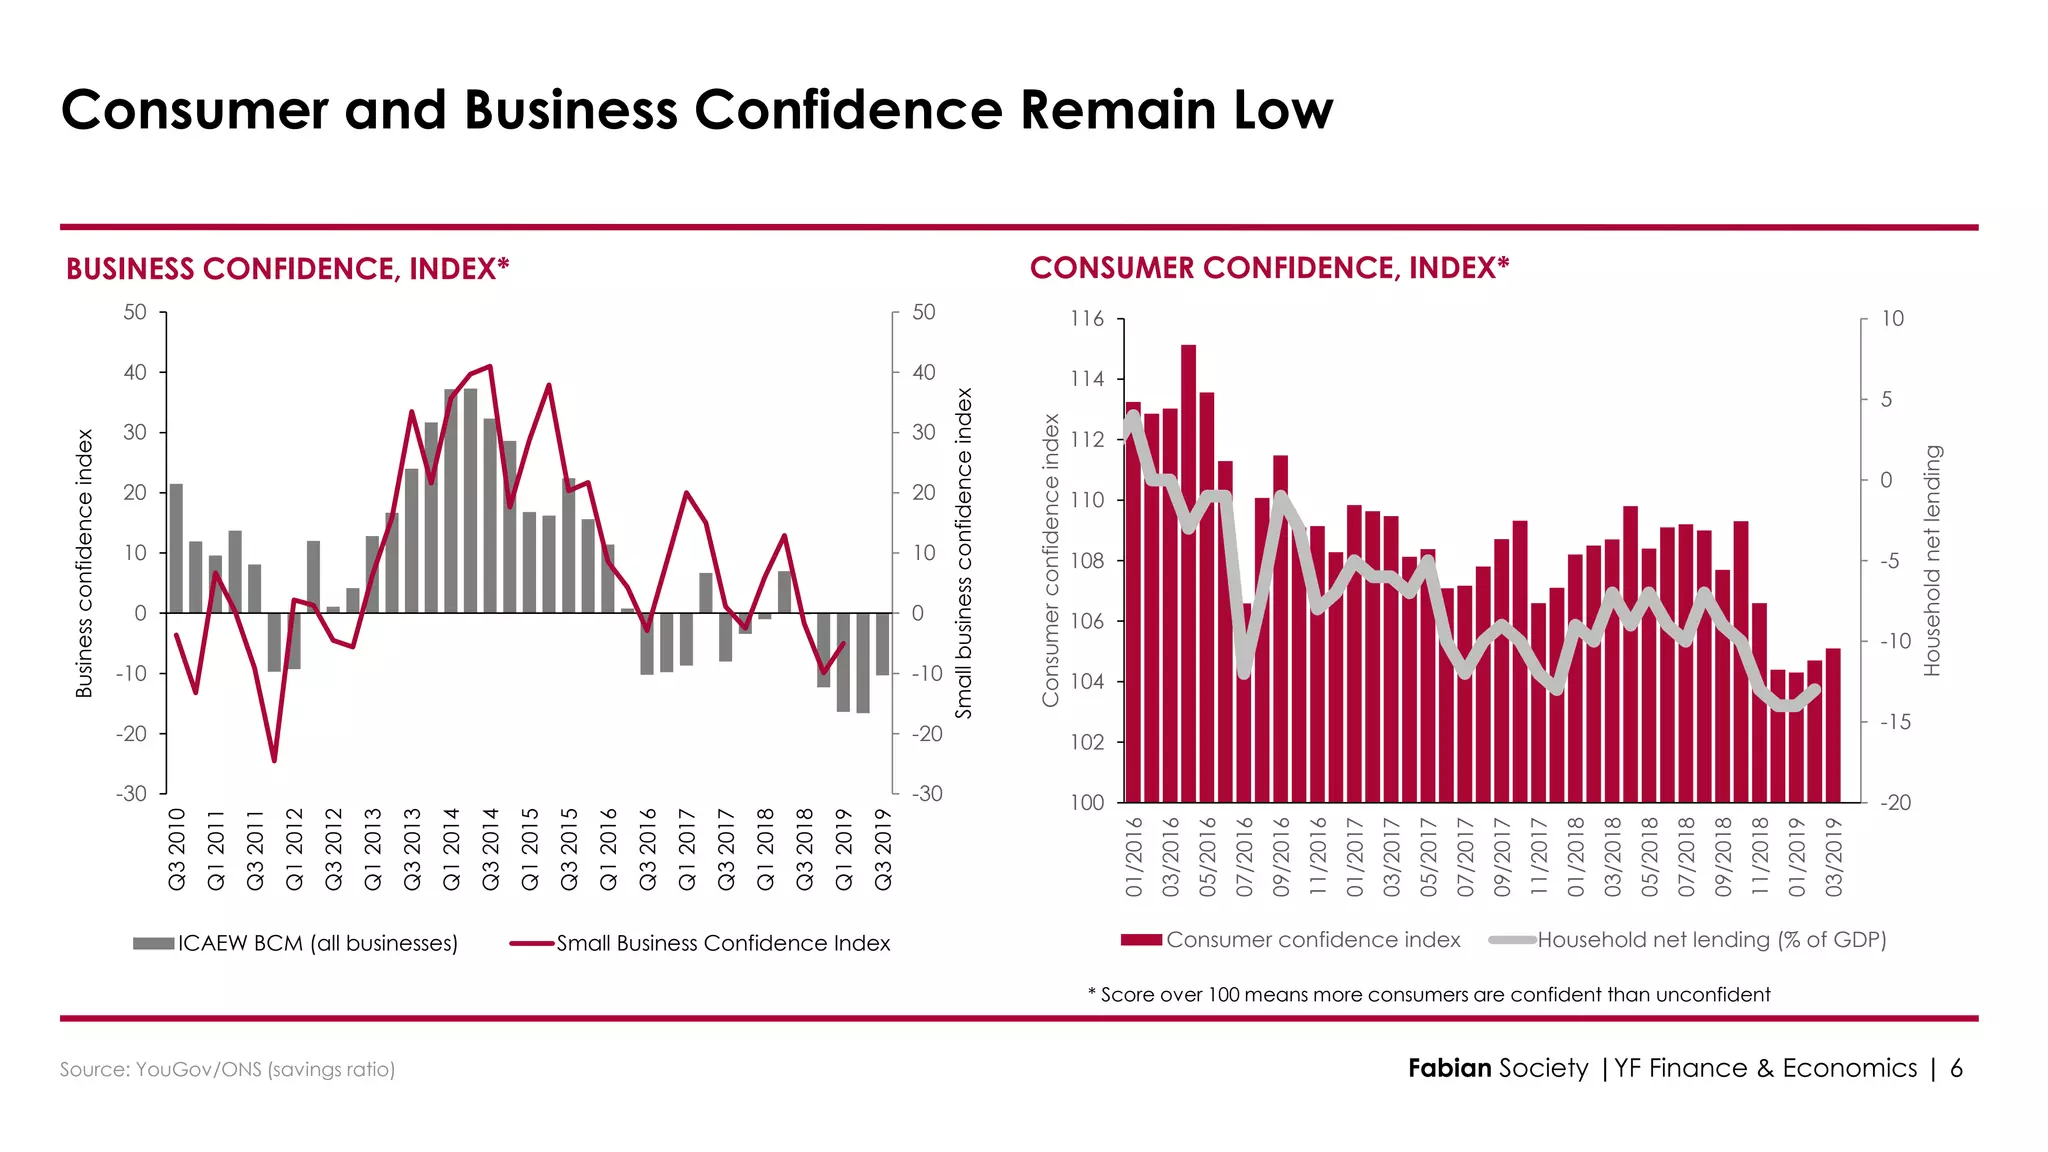
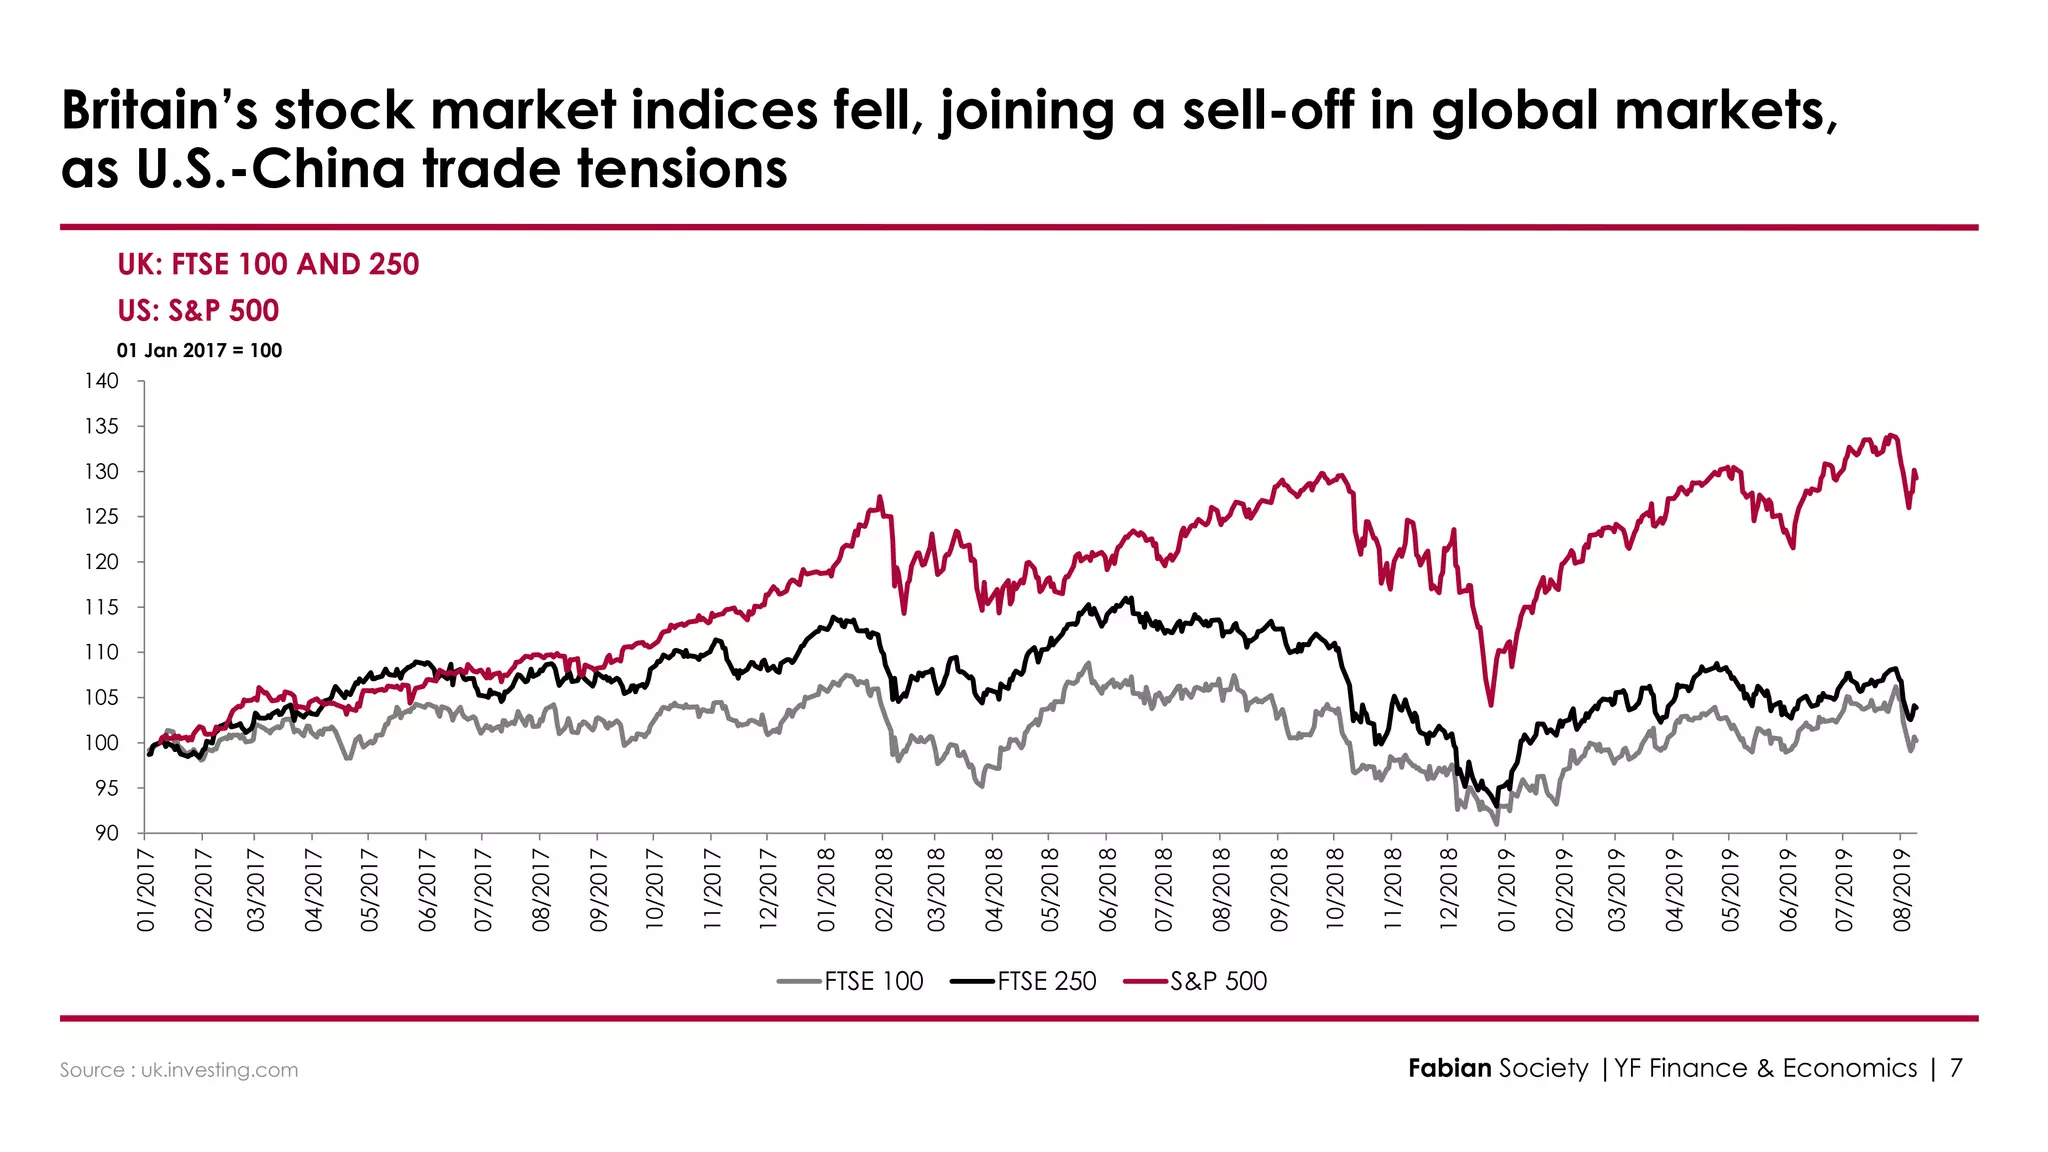
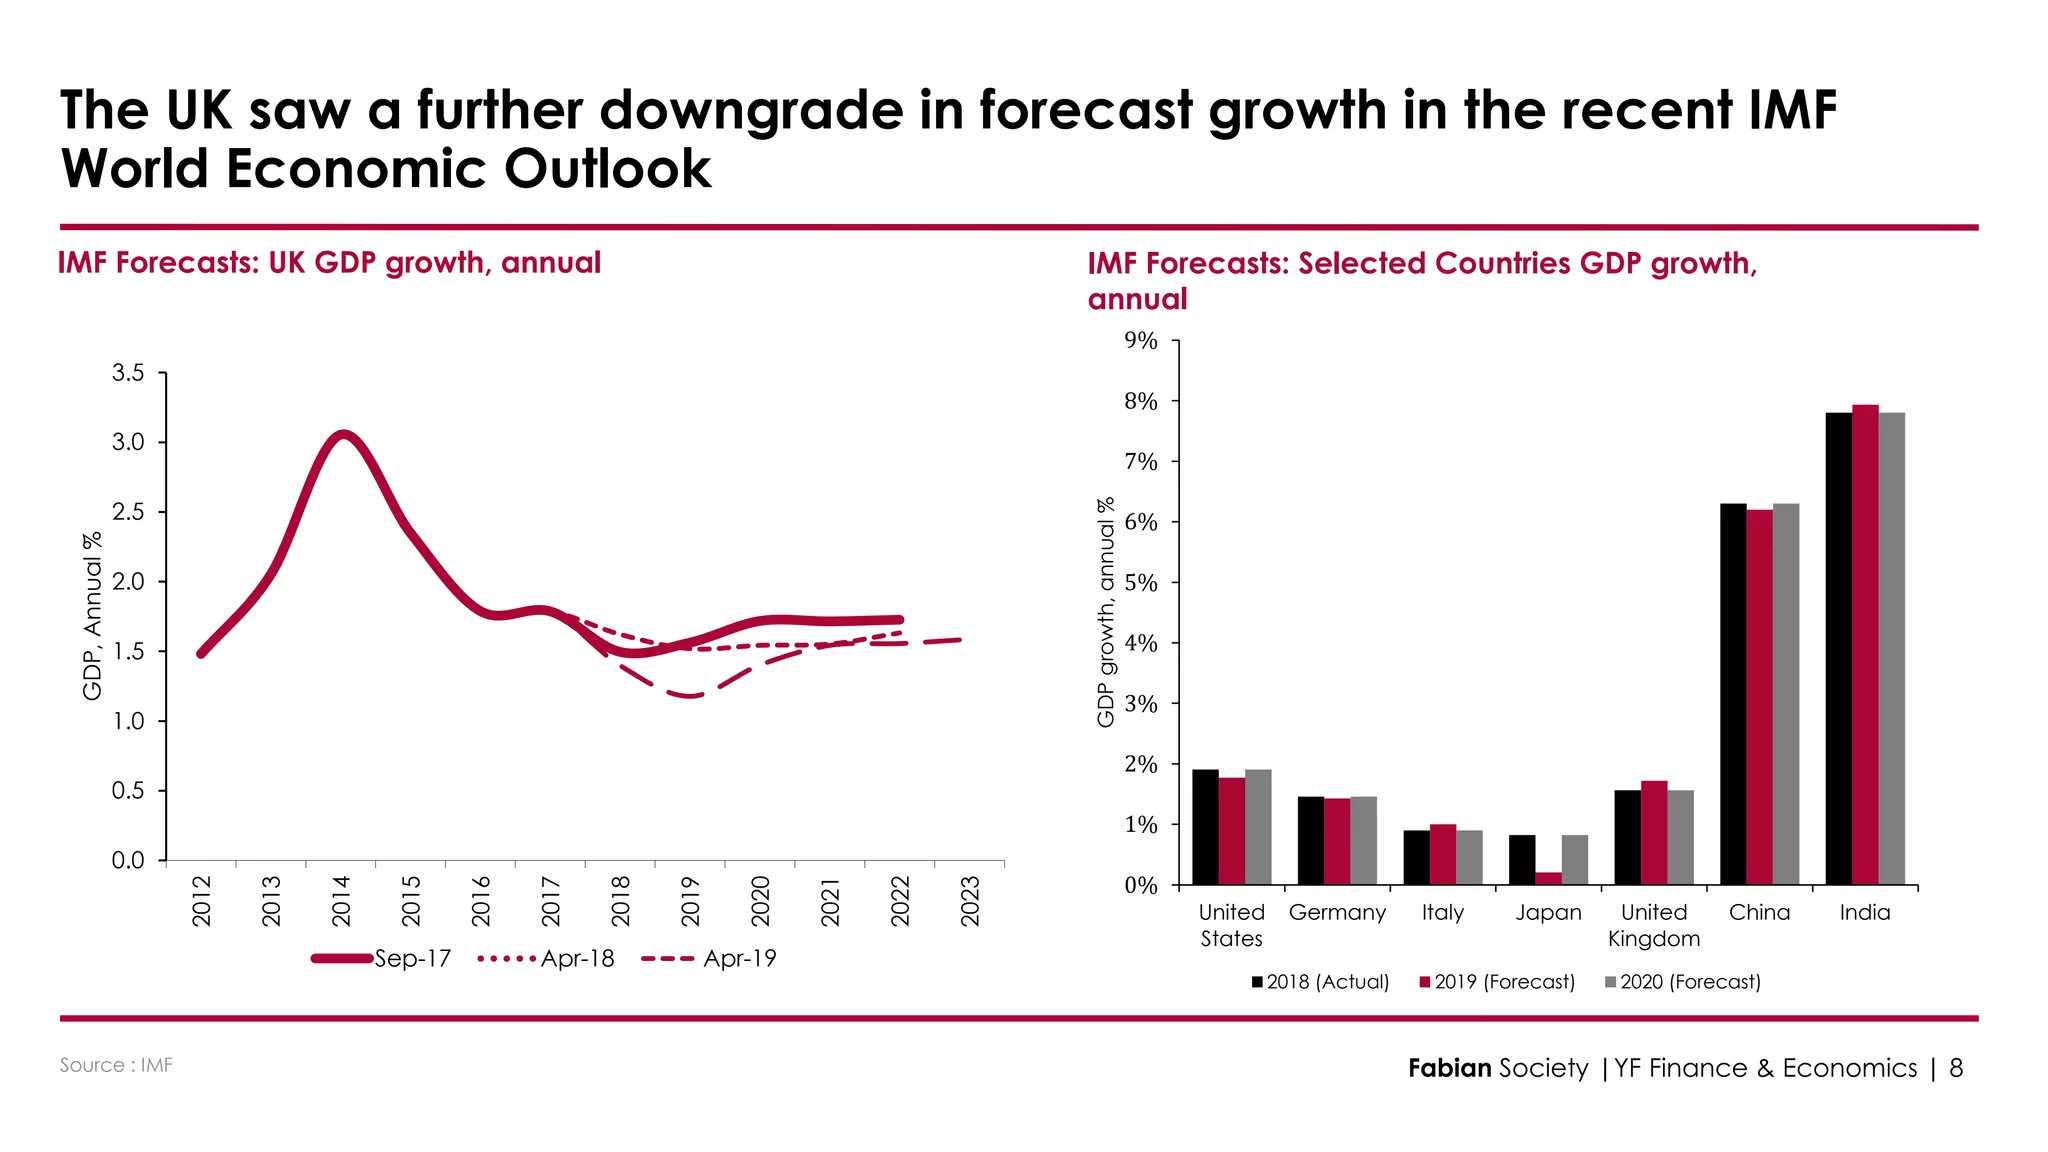
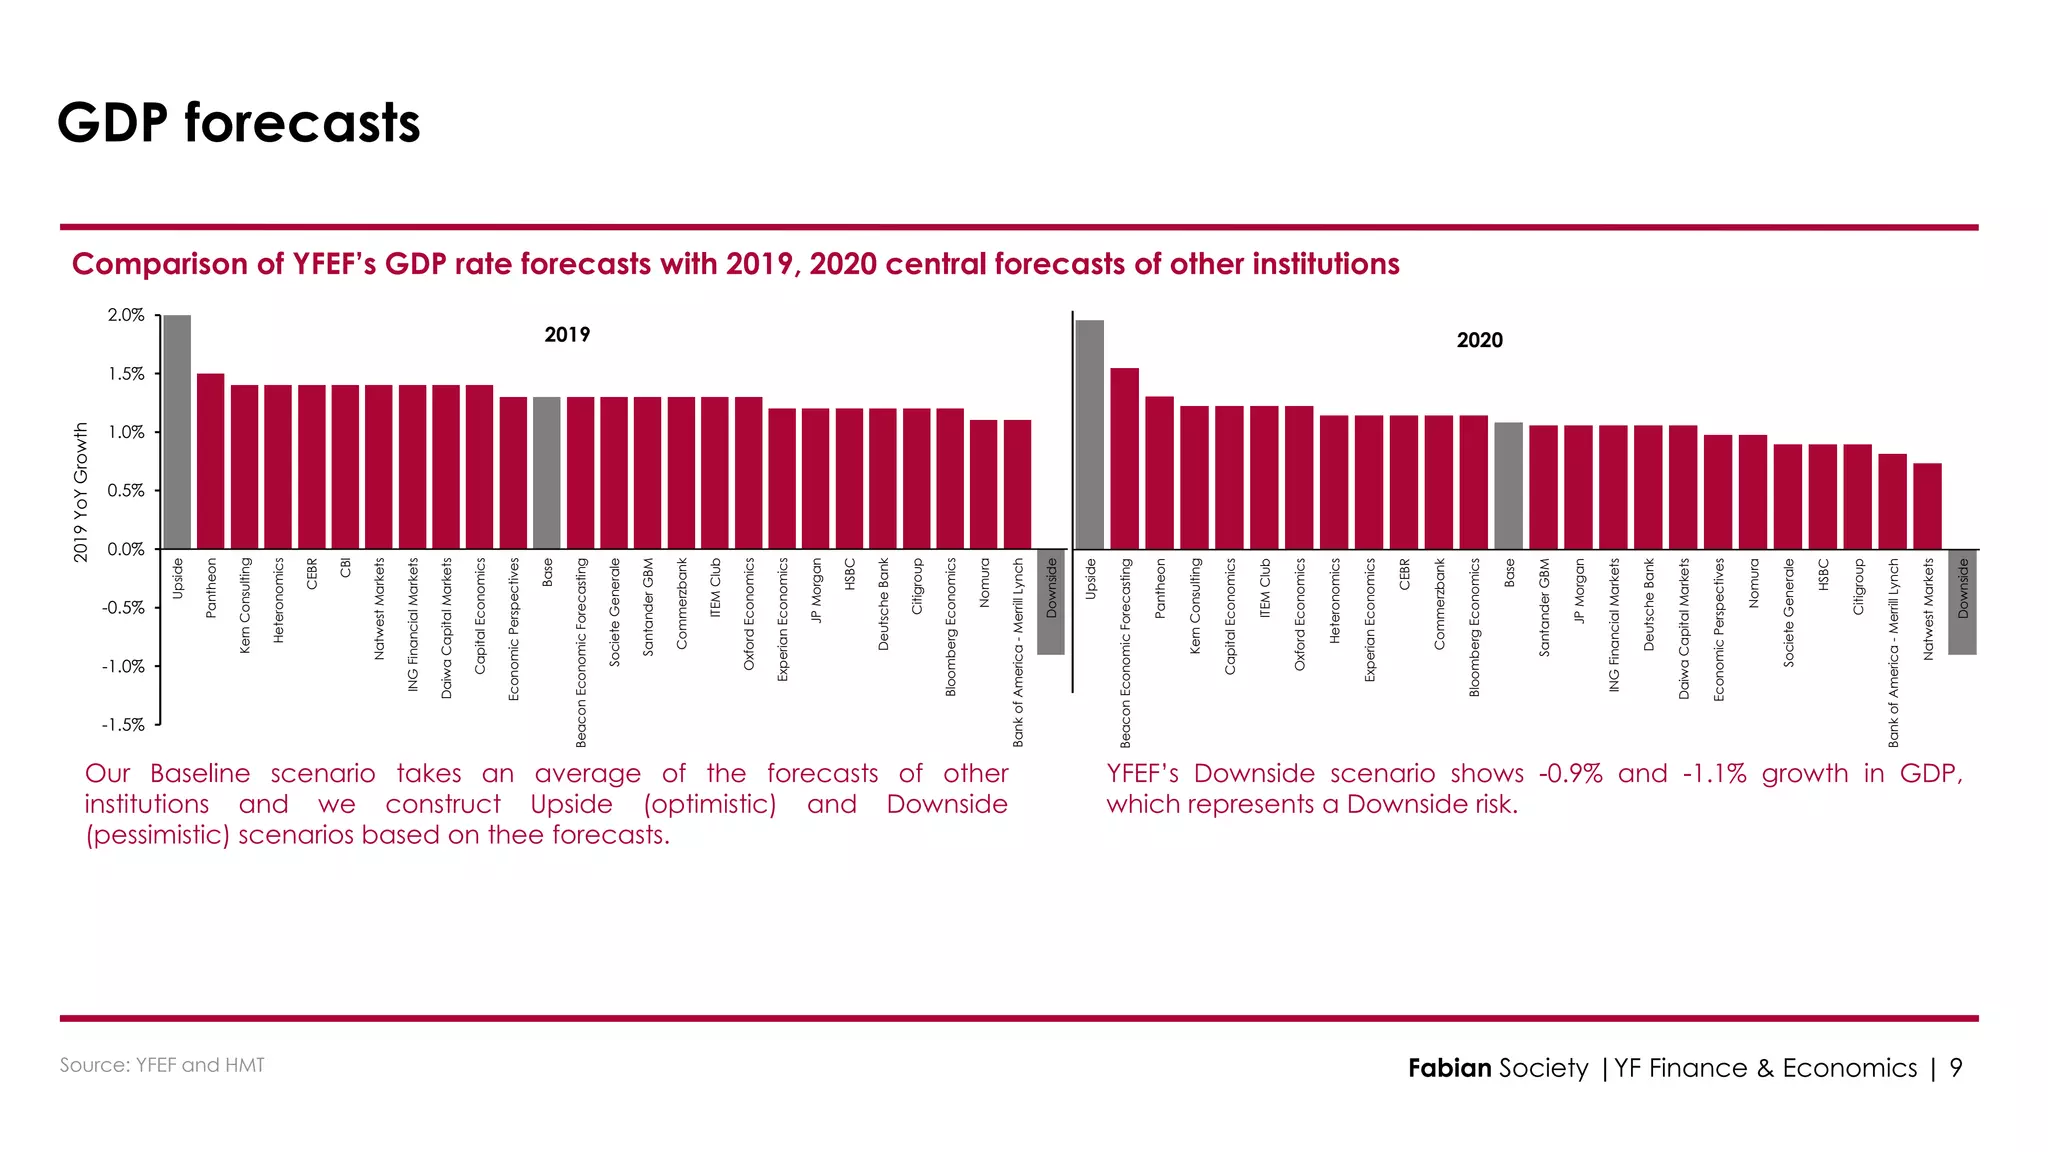
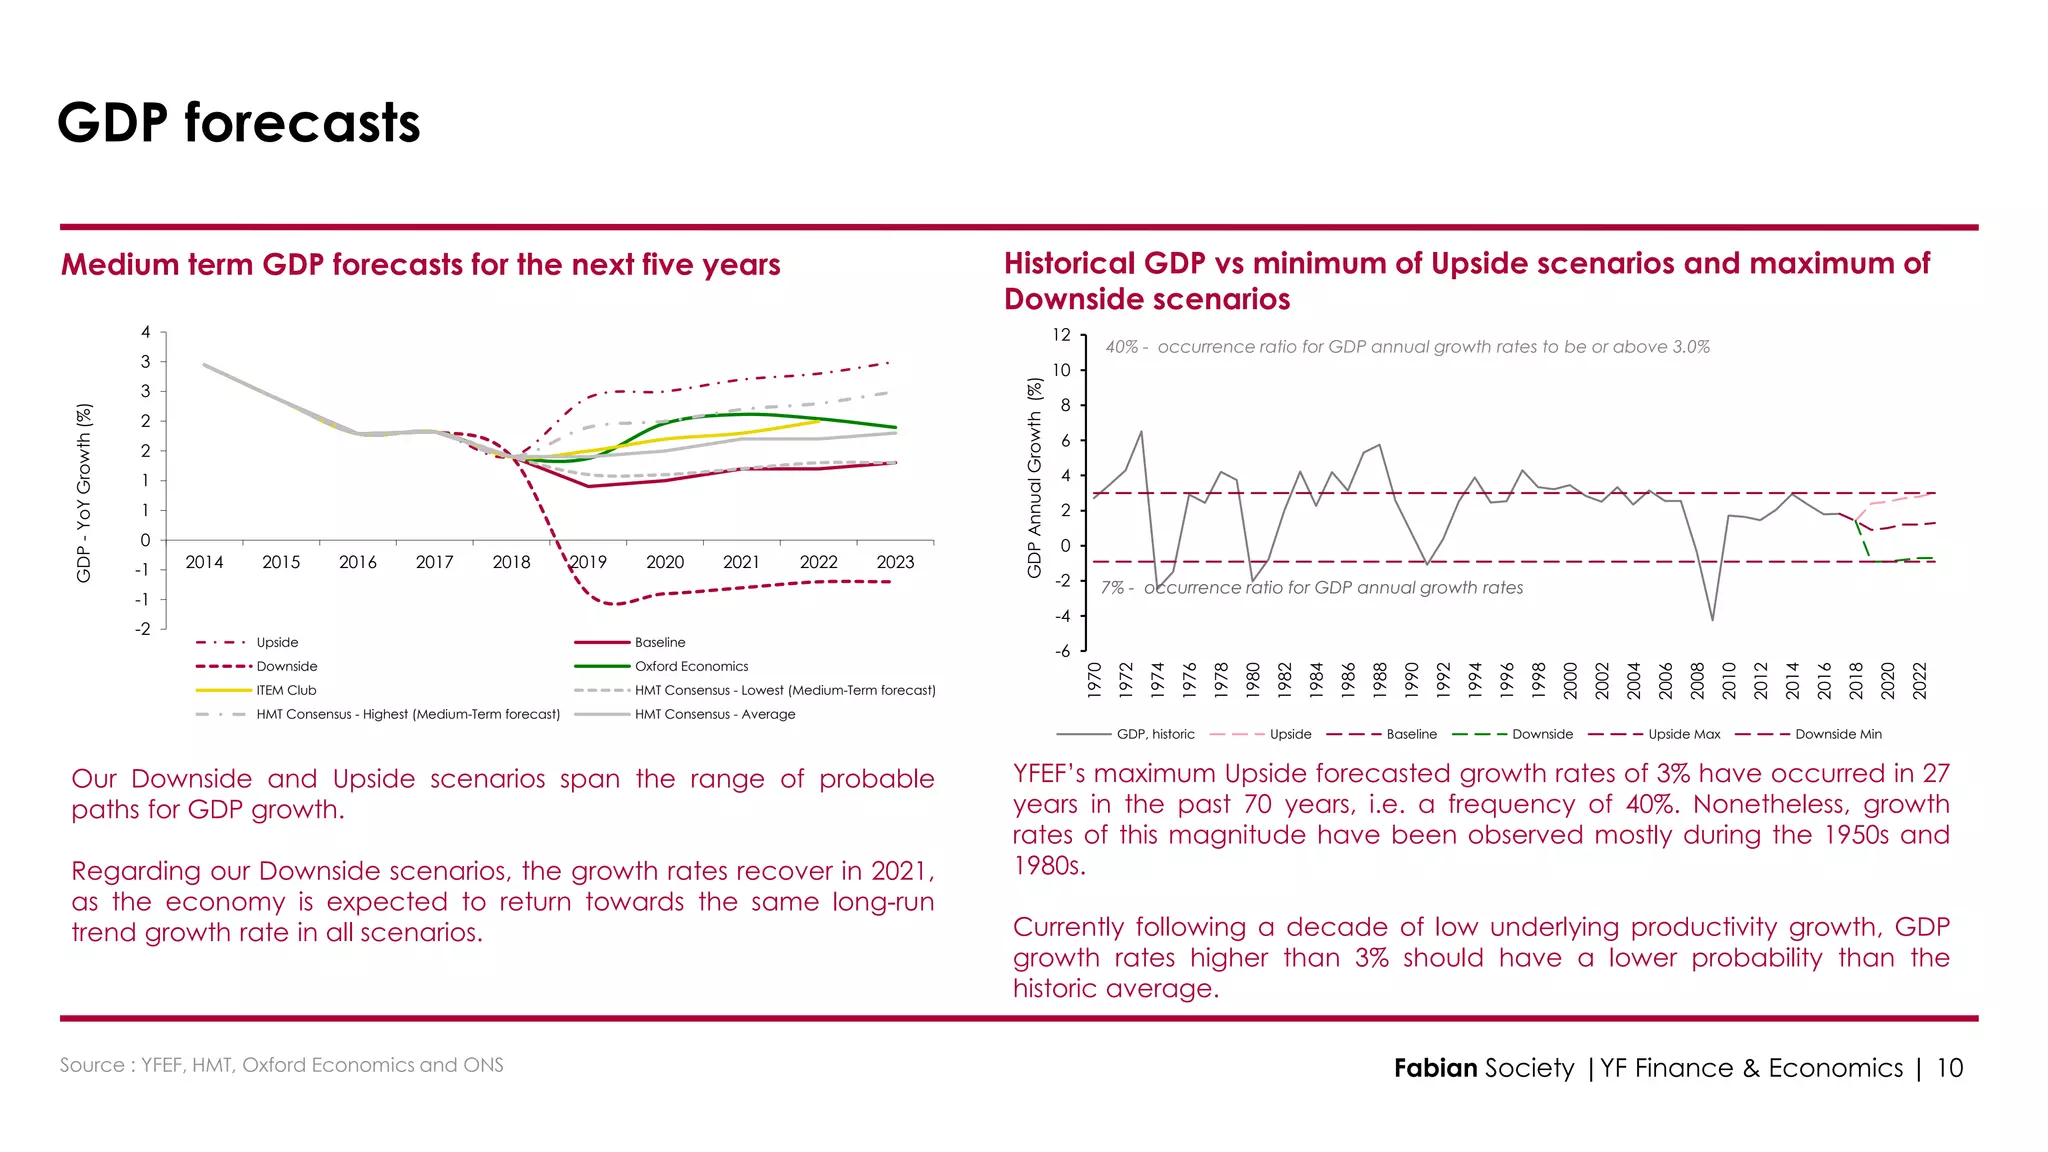
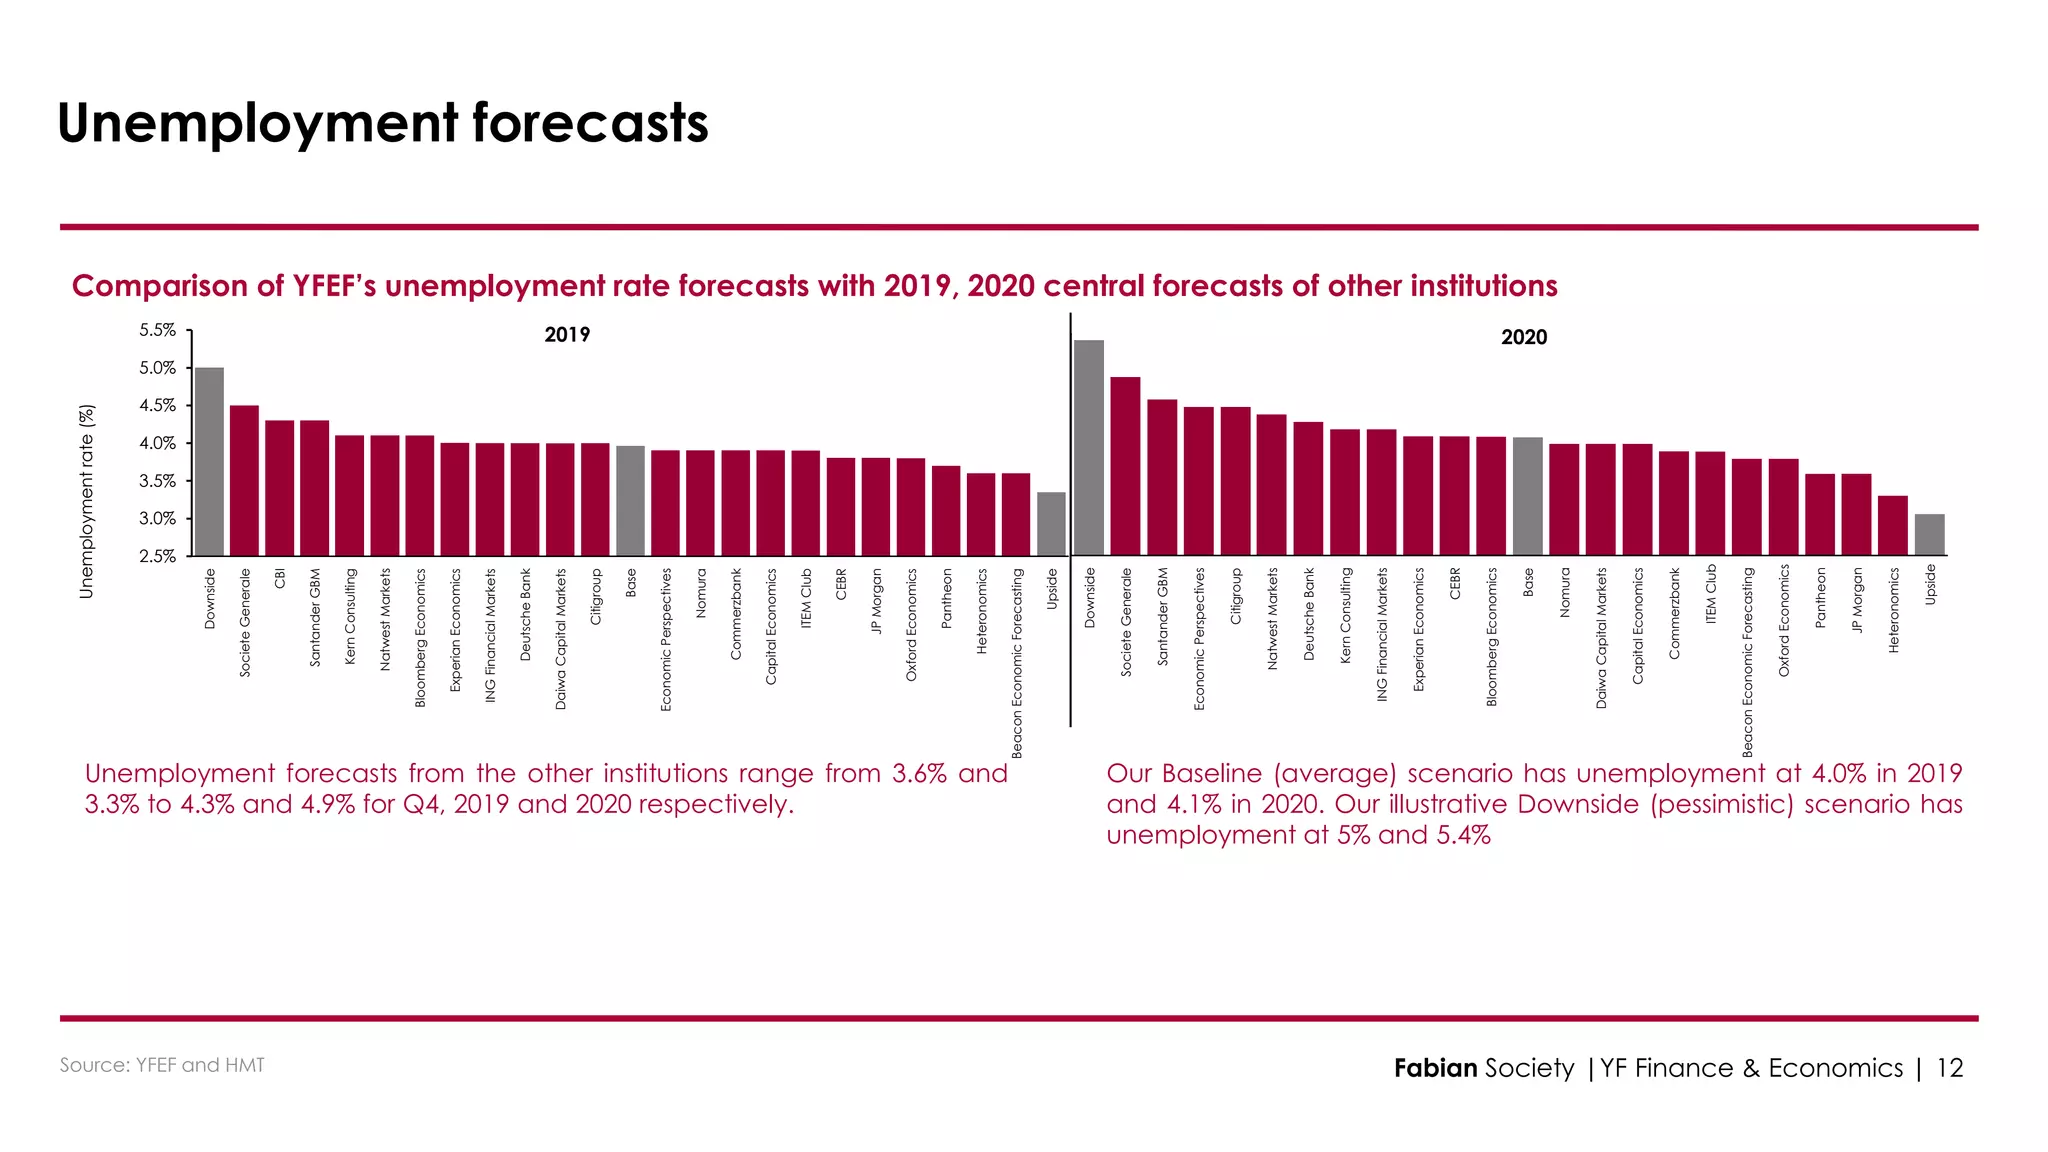
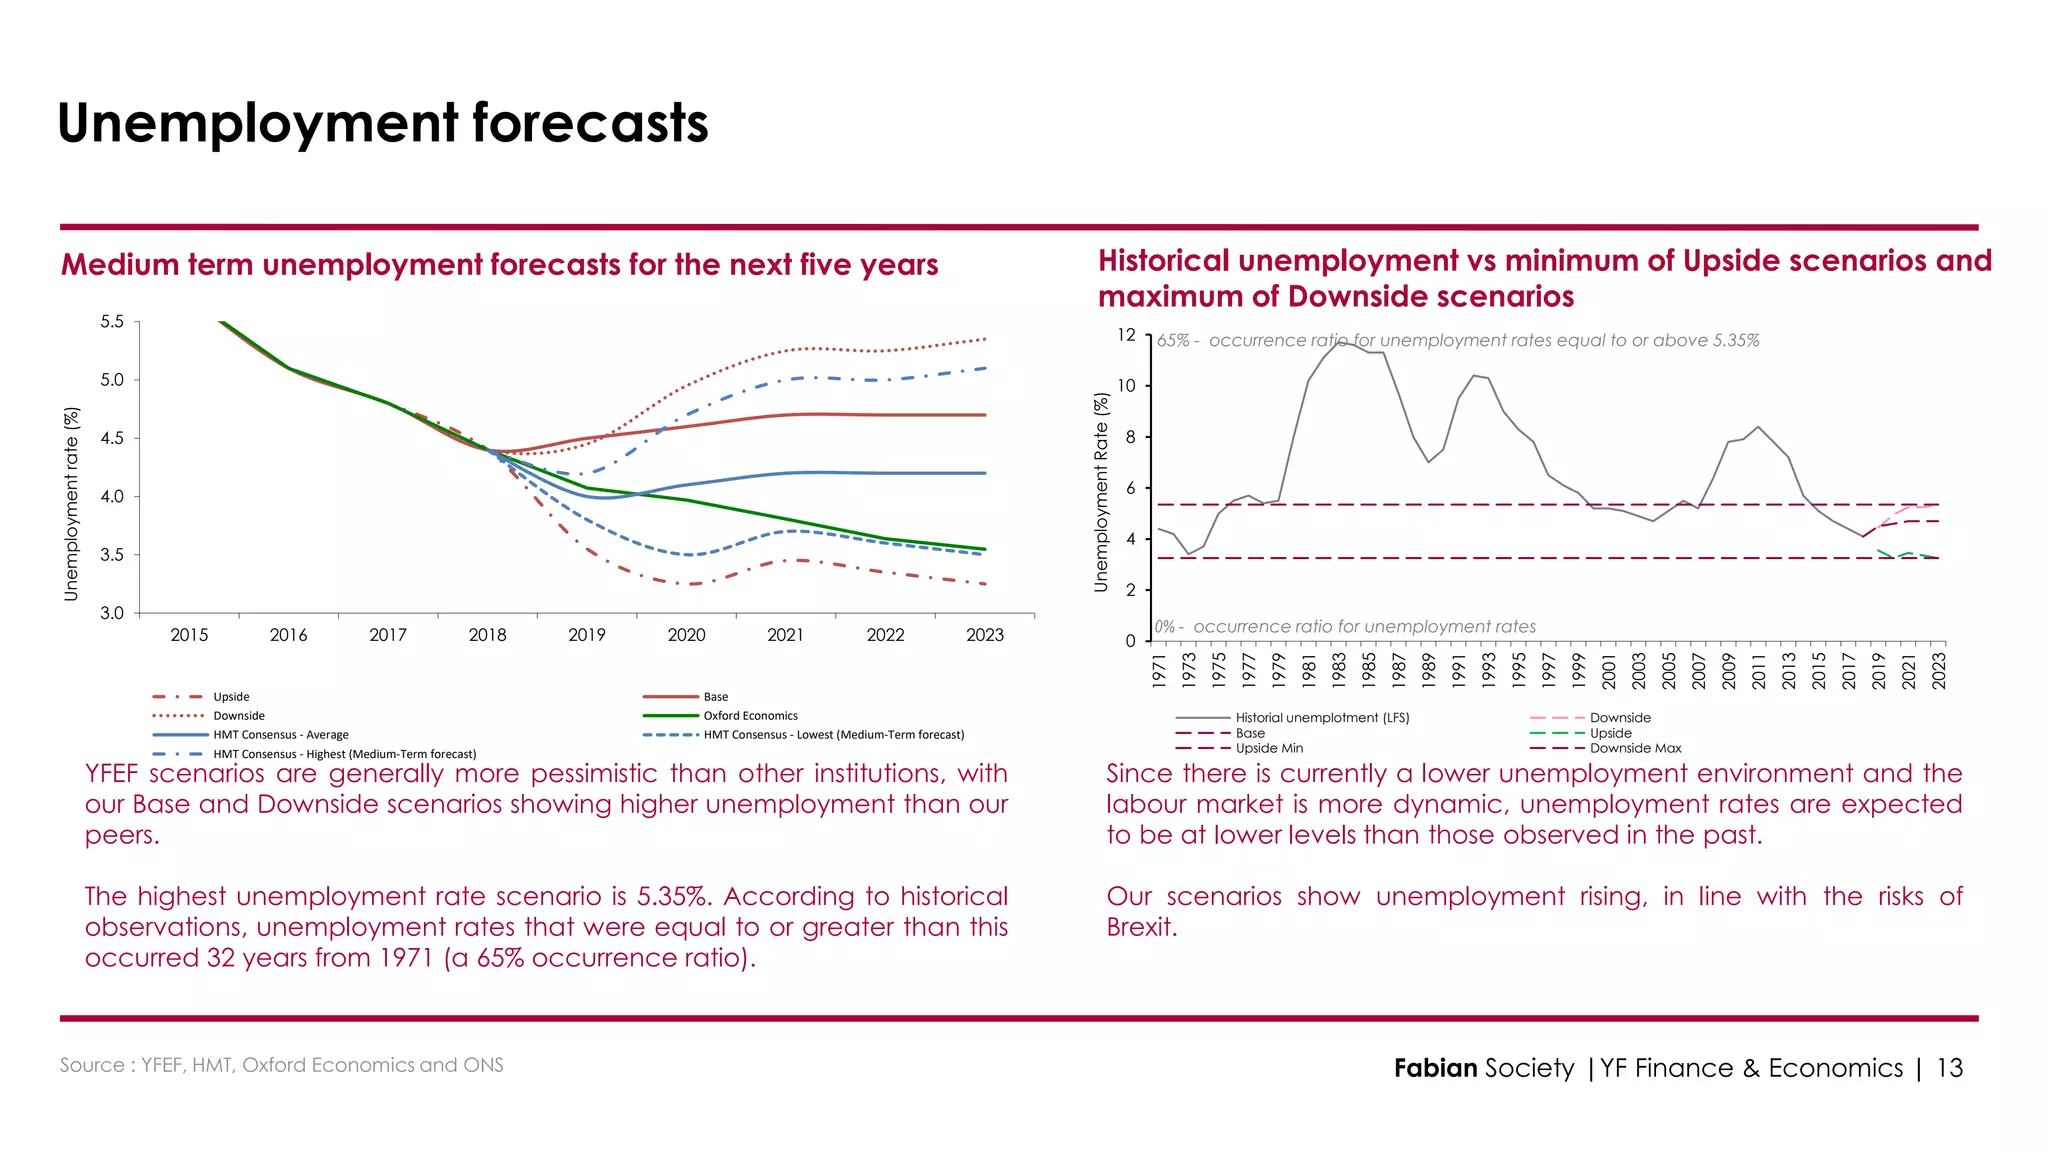
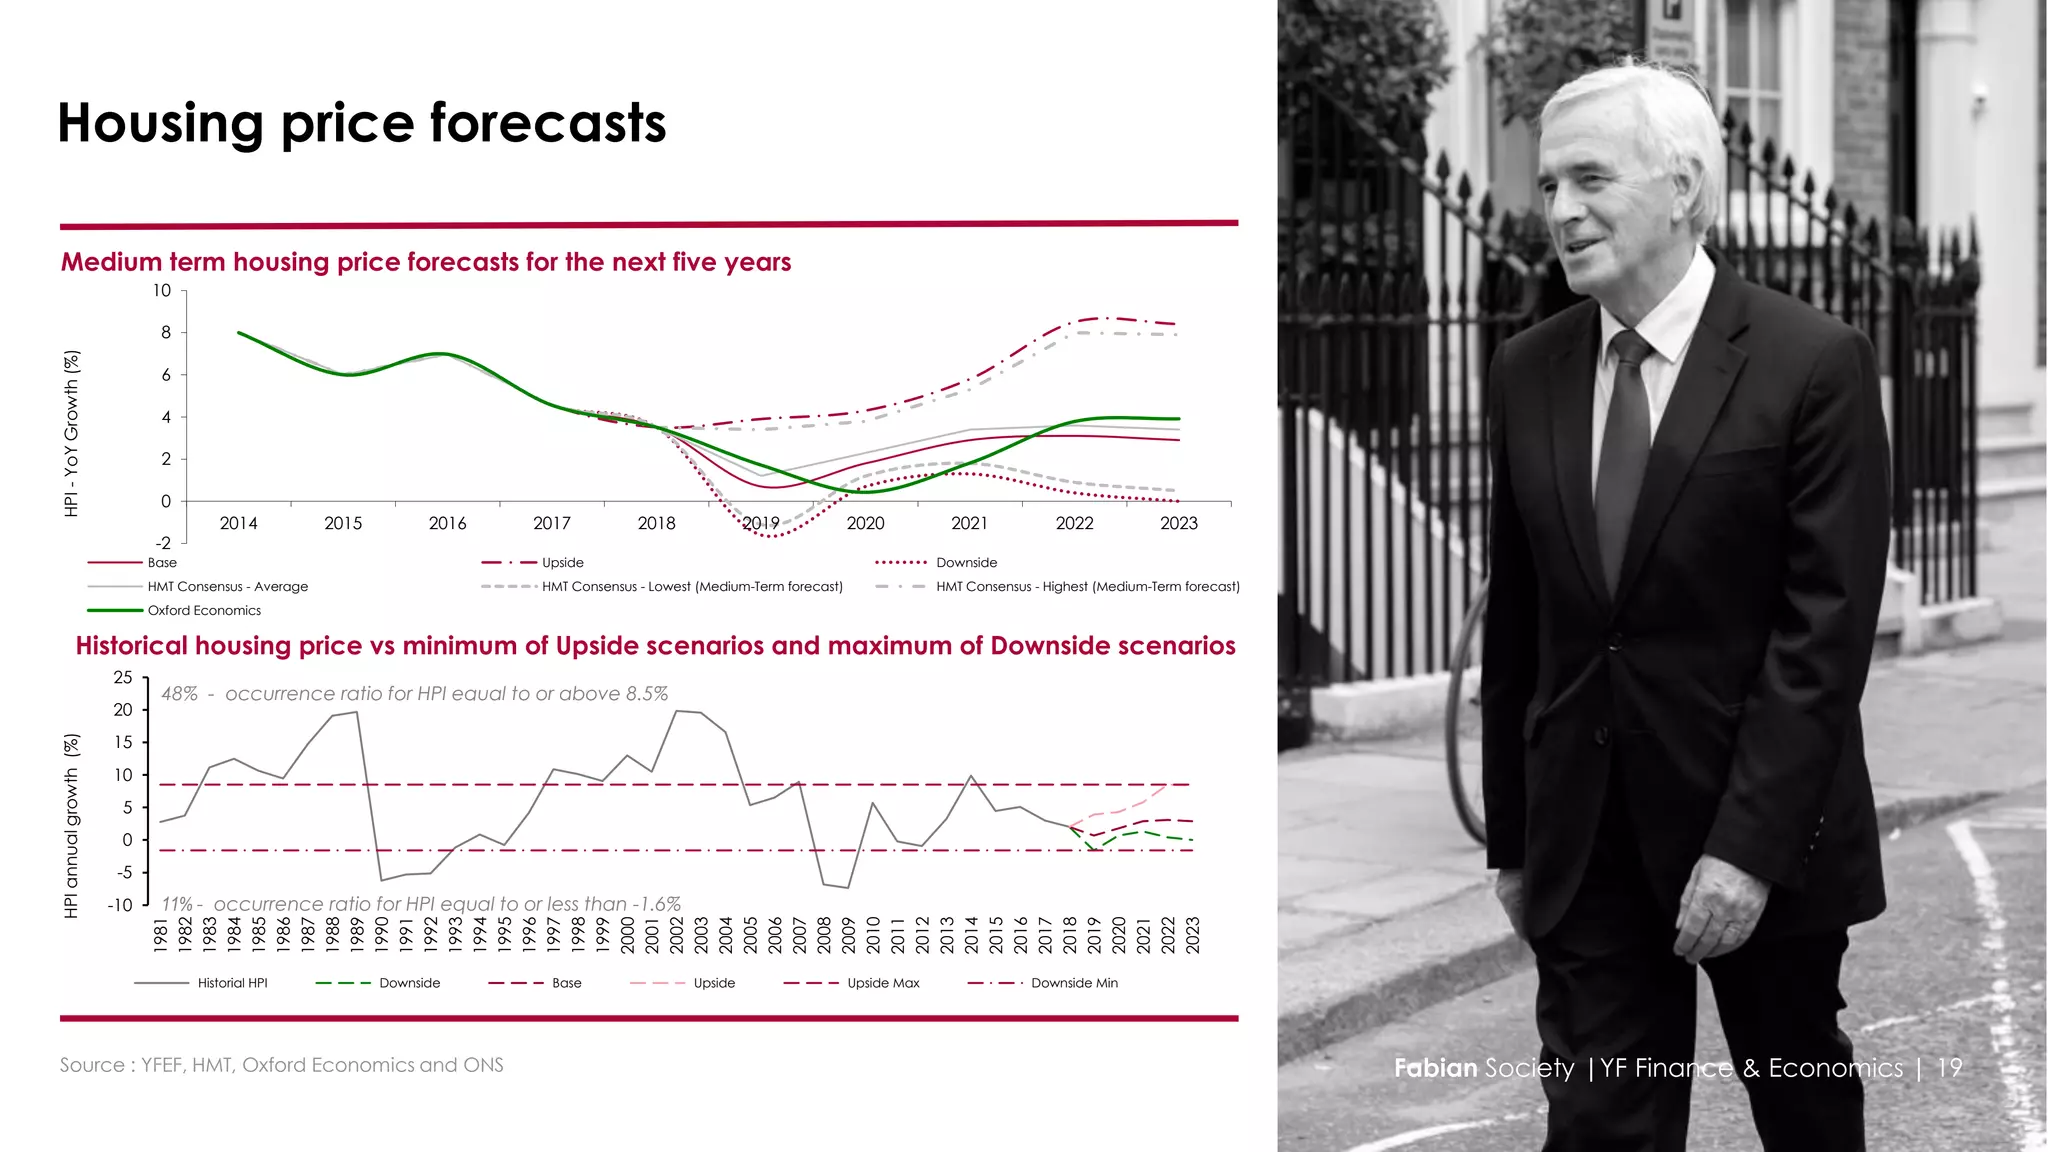
YOUNG FABIANS
August 2019
Economic Update
SUMMARY
RECENT ECONOMIC DEVELOPMENTS:
• GDP fell 0.2% in the second quarter of 2019, representing the first
drop since Q4 2012.
• The housing market started to weaken the months of June and
July.
• The global economy lost its pace mostly as a result of US-China
trade war and the fading effect of US fiscal stimulus.
LOOKING FORWARD:
• UK’s Q3 is likely to recover due to Brexit related distortions (e.g.
another round of stockpiling).
• US-China trade tensions continue with more American tariffs.
China responded by devaluating its currency.
Fabian Society |YF Finance & Economics | 1
-3.0%
-2.0%
-1.0%
0.0%
1.0%
2.0%
3.0%
2017 2018 2019 2020 2021
GDP(YoY,%growth)
Oxford Capital: Disorderly Capital: Orderly
Capital: Delay S&P IMF no border distruption
IMF severe
GDP growth in Brexit no-deal forecasts
GDP Q2 overview and forecasts
The economy continues to struggle to establish significant forward
momentum and this is represented in peer forecasts.
Fabian Society |YF Finance & Economics | 3
97
98
99
100
101
102
103
104
May2018
Jun2018
Jul2018
Aug2018
Sep2018
Oct2018
Nov2018
Dec2018
Jan2019
Feb2019
Mar2019
Apr2019
May2019
Jun2019
Production monthly Manufacturing monthly
-3.0%
-2.5%
-2.0%
-1.5%
-1.0%
-0.5%
0.0%
0.5%
1.0%
1.5%
2008Q1
2008Q4
2009Q3
2010Q2
2011Q1
2011Q4
2012Q3
2013Q2
2014Q1
2014Q4
2015Q3
2016Q2
2017Q1
2017Q4
2018Q3
2019Q2
-8.0%
-6.0%
-4.0%
-2.0%
0.0%
2.0%
4.0%
Quarter on quarter (left hand side)
Source : IMF & ONS
UK GDP saw the first quarterly contraction since Q4 2012 attributed to
declining manufacturing output related to Brexit
UK real GDP growth
Fabian Society |YF Finance & Economics | 4
UK monthly index of sectoral output
45
50
55
60
May-15
Aug-15
Nov-15
Feb-16
May-16
Aug-16
Nov-16
Feb-17
May-17
Aug-17
Nov-17
Feb-18
May-18
Aug-18
Nov-18
Feb-19
May-19
Services Manufacturing Construction
45
50
55
60
May-15
Aug-15
Nov-15
Feb-16
May-16
Aug-16
Nov-16
Feb-17
May-17
Aug-17
Nov-17
Feb-18
May-18
Aug-18
Nov-18
Feb-19
Services Manufacturing Construction
UK COMPOSITE GROWTH INDICATOR (Purchasing Managers Index, 50+ indicates growth)
GROWTH
CONTRACTION
Source : CIPS/Markit
Low and Falling Business Activity: A Sign of A Shrinking Economy
Fabian Society |YF Finance & Economics | 5
-30
-20
-10
0
10
20
30
40
50
-30
-20
-10
0
10
20
30
40
50
Q32010
Q12011
Q32011
Q12012
Q32012
Q12013
Q32013
Q12014
Q32014
Q12015
Q32015
Q12016
Q32016
Q12017
Q32017
Q12018
Q32018
Q12019
Q32019
Smallbusinessconfidenceindex
Businessconfidenceindex
ICAEW BCM (all businesses) Small Business Confidence Index
BUSINESS CONFIDENCE, INDEX* CONSUMER CONFIDENCE, INDEX*
Source: YouGov/ONS (savings ratio)
* Score over 100 means more consumers are confident than unconfident
Consumer and Business Confidence Remain Low
-20
-15
-10
-5
0
5
10
100
102
104
106
108
110
112
114
116
01/2016
03/2016
05/2016
07/2016
09/2016
11/2016
01/2017
03/2017
05/2017
07/2017
09/2017
11/2017
01/2018
03/2018
05/2018
07/2018
09/2018
11/2018
01/2019
03/2019
Householdnetlending
Consumerconfidenceindex
Consumer confidence index Household net lending (% of GDP)
Fabian Society |YF Finance & Economics | 6
Source : uk.investing.com
UK: FTSE 100 AND 250
US: S&P 500
01 Jan 2017 = 100
Britain’s stock market indices fell, joining a sell-off in global markets,
as U.S.-China trade tensions
90
95
100
105
110
115
120
125
130
135
140
01/2017
02/2017
03/2017
04/2017
05/2017
06/2017
07/2017
08/2017
09/2017
10/2017
11/2017
12/2017
01/2018
02/2018
03/2018
04/2018
05/2018
06/2018
07/2018
08/2018
09/2018
10/2018
11/2018
12/2018
01/2019
02/2019
03/2019
04/2019
05/2019
06/2019
07/2019
08/2019
FTSE 100 FTSE 250 S&P 500
Fabian Society |YF Finance & Economics | 7
0%
1%
2%
3%
4%
5%
6%
7%
8%
9%
United
States
Germany Italy Japan United
Kingdom
China India
GDPgrowth,annual%
2018 (Actual) 2019 (Forecast) 2020 (Forecast)
Source : IMF
The UK saw a further downgrade in forecast growth in the recent IMF
World Economic Outlook
IMF Forecasts: UK GDP growth, annual IMF Forecasts: Selected Countries GDP growth,
annual
0.0
0.5
1.0
1.5
2.0
2.5
3.0
3.5
2012
2013
2014
2015
2016
2017
2018
2019
2020
2021
2022
2023
GDP,Annual%
Sep-17 Apr-18 Apr-19
Fabian Society |YF Finance & Economics | 8
GDP forecasts
Upside
BeaconEconomicForecasting
Pantheon
KernConsulting
CapitalEconomics
ITEMClub
OxfordEconomics
Heteronomics
ExperianEconomics
CEBR
Commerzbank
BloombergEconomics
Base
SantanderGBM
JPMorgan
INGFinancialMarkets
DeutscheBank
DaiwaCapitalMarkets
EconomicPerspectives
Nomura
SocieteGenerale
HSBC
Citigroup
BankofAmerica-MerrillLynch
NatwestMarkets
Downside
2020
-1.5%
-1.0%
-0.5%
0.0%
0.5%
1.0%
1.5%
2.0%
Upside
Pantheon
KernConsulting
Heteronomics
CEBR
CBI
NatwestMarkets
INGFinancialMarkets
DaiwaCapitalMarkets
CapitalEconomics
EconomicPerspectives
Base
BeaconEconomicForecasting
SocieteGenerale
SantanderGBM
Commerzbank
ITEMClub
OxfordEconomics
ExperianEconomics
JPMorgan
HSBC
DeutscheBank
Citigroup
BloombergEconomics
Nomura
BankofAmerica-MerrillLynch
Downside
2019YoYGrowth
2019
Comparison of YFEF’s GDP rate forecasts with 2019, 2020 central forecasts of other institutions
Source: YFEF and HMT
Our Baseline scenario takes an average of the forecasts of other
institutions and we construct Upside (optimistic) and Downside
(pessimistic) scenarios based on thee forecasts.
YFEF’s Downside scenario shows -0.9% and -1.1% growth in GDP,
which represents a Downside risk.
Fabian Society |YF Finance & Economics | 9
Historical GDP vs minimum of Upside scenarios and maximum of
Downside scenarios
-6
-4
-2
0
2
4
6
8
10
12
1970
1972
1974
1976
1978
1980
1982
1984
1986
1988
1990
1992
1994
1996
1998
2000
2002
2004
2006
2008
2010
2012
2014
2016
2018
2020
2022
GDPAnnualGrowth(%)
GDP, historic Upside Baseline Downside Upside Max Downside Min
7% - occurrence ratio for GDP annual growth rates
40% - occurrence ratio for GDP annual growth rates to be or above 3.0%
-2
-1
-1
0
1
1
2
2
3
3
4
2014 2015 2016 2017 2018 2019 2020 2021 2022 2023
GDP-YoYGrowth(%)
Upside Baseline
Downside Oxford Economics
ITEM Club HMT Consensus - Lowest (Medium-Term forecast)
HMT Consensus - Highest (Medium-Term forecast) HMT Consensus - Average
GDP forecasts
Medium term GDP forecasts for the next five years
Our Downside and Upside scenarios span the range of probable
paths for GDP growth.
Regarding our Downside scenarios, the growth rates recover in 2021,
as the economy is expected to return towards the same long-run
trend growth rate in all scenarios.
YFEF’s maximum Upside forecasted growth rates of 3% have occurred in 27
years in the past 70 years, i.e. a frequency of 40%. Nonetheless, growth
rates of this magnitude have been observed mostly during the 1950s and
1980s.
Currently following a decade of low underlying productivity growth, GDP
growth rates higher than 3% should have a lower probability than the
historic average.
Source : YFEF, HMT, Oxford Economics and ONS Fabian Society |YF Finance & Economics | 10
-2
-1
0
1
2
3
4
5
6
2016 2017 2018 2019 2020 2021 2022
GDP-YoYGrowth(%)
Lowest [16- 19%] Low - Medium [15- 25%] Central [19- 29%]
Medium - Optimistic [0- 0%] Optimistic [8- 15%] Highest [21- 35%]
Mode BoE Upside Baseline
Downside
-3.9%
-2.8%
-1.1%
-4.6%
-3.9%
Average
-5%
-4%
-3%
-2%
-1%
0%
1949 - 1975 1976 - 1981 1982 - 1991 1992 - 2009 Downside
Peak-to-Trough(p.p.)
GDP forecasts
Comparison of YFEF’s GDP forecast scenarios vs BoE’s Fan Chart Peak-to-trough GDP in previous cycles
Our Baseline average of all forecasts falls broadly within the BoE central
forecast range while our extreme Upside and Downside scenarios,
understandably, are at the upper and lower ends of their range
Meanwhile, the Base scenario is largely consistent with the mean of BoE
forecasts. The probabilities assigned to the YFEF’s scenarios would be
expected to broadly align with the probabilities attached to similar
strength outturns in the BoE fan chart.
While the BoE fan chart is symmetrical by design, we believe that the current
risks for the UK economy are skewed toward Downside risks, given the
current risks of a No-Deal Brexit and other risks, such as a Eurozone downturn,
escalation of trade disputes, and a slowdown in China.
Source : YFEF, BoE and ONS Fabian Society |YF Finance & Economics | 11
Downside
SocieteGenerale
SantanderGBM
EconomicPerspectives
Citigroup
NatwestMarkets
DeutscheBank
KernConsulting
INGFinancialMarkets
ExperianEconomics
CEBR
BloombergEconomics
Base
Nomura
DaiwaCapitalMarkets
CapitalEconomics
Commerzbank
ITEMClub
BeaconEconomicForecasting
OxfordEconomics
Pantheon
JPMorgan
Heteronomics
Upside
2020
2.5%
3.0%
3.5%
4.0%
4.5%
5.0%
5.5%
Downside
SocieteGenerale
CBI
SantanderGBM
KernConsulting
NatwestMarkets
BloombergEconomics
ExperianEconomics
INGFinancialMarkets
DeutscheBank
DaiwaCapitalMarkets
Citigroup
Base
EconomicPerspectives
Nomura
Commerzbank
CapitalEconomics
ITEMClub
CEBR
JPMorgan
OxfordEconomics
Pantheon
Heteronomics
BeaconEconomicForecasting
Upside
Unemploymentrate(%)
2019
Unemployment forecasts
Comparison of YFEF’s unemployment rate forecasts with 2019, 2020 central forecasts of other institutions
Source: YFEF and HMT
Unemployment forecasts from the other institutions range from 3.6% and
3.3% to 4.3% and 4.9% for Q4, 2019 and 2020 respectively.
Our Baseline (average) scenario has unemployment at 4.0% in 2019
and 4.1% in 2020. Our illustrative Downside (pessimistic) scenario has
unemployment at 5% and 5.4%
Fabian Society |YF Finance & Economics | 12
3.0
3.5
4.0
4.5
5.0
5.5
2015 2016 2017 2018 2019 2020 2021 2022 2023
Unemploymentrate(%)
Upside Base
Downside Oxford Economics
HMT Consensus - Average HMT Consensus - Lowest (Medium-Term forecast)
HMT Consensus - Highest (Medium-Term forecast)
Unemployment forecasts
Medium term unemployment forecasts for the next five years Historical unemployment vs minimum of Upside scenarios and
maximum of Downside scenarios
0
2
4
6
8
10
12
1971
1973
1975
1977
1979
1981
1983
1985
1987
1989
1991
1993
1995
1997
1999
2001
2003
2005
2007
2009
2011
2013
2015
2017
2019
2021
2023
UnemploymentRate(%)
Historial unemplotment (LFS) Downside
Base Upside
Upside Min Downside Max
0% - occurrence ratio for unemployment rates
65% - occurrence ratio for unemployment rates equal to or above 5.35%
Source : YFEF, HMT, Oxford Economics and ONS
YFEF scenarios are generally more pessimistic than other institutions, with
our Base and Downside scenarios showing higher unemployment than our
peers.
The highest unemployment rate scenario is 5.35%. According to historical
observations, unemployment rates that were equal to or greater than this
occurred 32 years from 1971 (a 65% occurrence ratio).
Since there is currently a lower unemployment environment and the
labour market is more dynamic, unemployment rates are expected
to be at lower levels than those observed in the past.
Our scenarios show unemployment rising, in line with the risks of
Brexit.
Fabian Society |YF Finance & Economics | 13
1.0
1.5
2.0
2.5
3.0
3.5
4.0
4.5
5.0
5.5
2015 2016 2017 2018 2019 2020 2021 2022
Unemploymentrate(%)
Min - BoE Lowest [9- 33%] Low - Medium [35- 61%]
Central [24- 35%] Medium - Optimistic [0- 8%] Optimistic [0- 0%]
Highest [0- 0%] Upside Base
Downside Mode BoE
2.10
6.30
3.40
3.20
0.95
2.25
Average
0
1
2
3
4
5
6
7
1973 - 1977 1978 - 1983 1989 - 1992 2007 - 2011 Base Downside
Trough-to-Peak(p.p.)
Unemployment forecasts
Comparison of YFEF’s unemployment scenarios vs BoE’s GDP Fan
Chart
Peak-to-trough unemployment in previous cycles
Source : YFEF, BoE and ONS
In past recessions the average increase in the unemployment rate
between the peak and the trough is 3.8 p.p., while for YFEF’s
Downside scenario it is 2.3 p.p. YFEF’s Downside impact is below the
historical average but still broadly consistent with rises seen in previous
recessions if we exclude the rise in the 1978-83 recession.
YFEF’s Downside scenario shows a peak of 5.4% unemployment, whereas
during 2008 and 2009 the unemployment rate rose from 5.2% in 2007 to 8.4%
in 2011. Therefore, given the higher starting point (currently 3.9%
unemployment rate), a maximum of 5.4% unemployment rate in the
Downside scenario seems reasonable.
Fabian Society |YF Finance & Economics | 14
Upside
EconomicPerspectives
KernConsulting
CEBR
ITEMClub
Heteronomics
BeaconEconomic
Forecasting
Pantheon
BloombergEconomics
Base
OxfordEconomics
Nomura
DeutscheBank
Citigroup
CapitalEconomics
ExperianEconomics
SantanderGBM
DaiwaCapitalMarkets
Commerzbank
BankofAmerica-Merrill
Lynch
NatwestMarkets
Downside
2020
0.0%
0.5%
1.0%
1.5%
2.0%
Upside
EconomicPerspectives
CBI
KernConsulting
Heteronomics
Pantheon
CEBR
Base
OxfordEconomics
ITEMClub
ExperianEconomics
BeaconEconomicForecasting
SocieteGenerale
SantanderGBM
Nomura
NatwestMarkets
DeutscheBank
DaiwaCapitalMarkets
Commerzbank
Citigroup
CapitalEconomics
BloombergEconomics
BankofAmerica-MerrillLynch
Downside
Bankrate(%)
2019
Bank rate forecasts
Comparison of YFEF’s Bank rate scenario with 2019, 2020 central forecasts of other institutions
Source: YFEF and HMT
Official bank rates from the other institutions range from 0.75% to 1.25%
and 0.75% to 1.75% respectively. YFEFs Base Scenario, as an average of
these forecasts, have interest rates at 0.8% and 1% for the two years.
Though other major central banks have indicated they plan to loosen
monetary policy, the Bank of England looks likely to keep policy
unchanged until well into next year, unless there is a no-deal Brexit or
other downside risks to growth begin to play out.
Indeed at the time of writing, financial markets are pricing a 40%
chance that the MPC will cut interest rates before the end of the
year. But while the Fed and ECB have signalled an intention to
loosen policy, the MPC has suggested it has no plans to cut Bank
Rate if its central forecast plays our. As such, our baseline forecast
assumes that Bank Rate remains relatively modest until mid-2020.
Fabian Society |YF Finance & Economics | 15
0.0
0.5
1.0
1.5
2.0
2.5
3.0
3.5
4.0
2015 2016 2017 2018 2019 2020 2021 2022 2023 2024
GovernmentBondYield10y(Q4%)
Upside Base Downside
Oxford Economics ITEM Club HMT Consensus - Average
HMT Consensus - Lowest Bank rate (annual average, percent) forecast HMT Consensus - Highest
Bank rate forecasts
Medium term official bank rate forecasts for the next five years Historical official bank rate vs minimum of Upside scenarios and
maximum of Downside scenarios
0
1
2
3
4
5
6
7
8
1993
1994
1995
1996
1997
1998
1999
2000
2001
2002
2003
2004
2005
2006
2007
2008
2009
2010
2011
2012
2013
2014
2015
2016
2017
2018
2019
2020
2021
2022
2023
BankRate(%)
Historical Central Bank Rates Upside Base
Downside Downside Min Upside Max
59% - occurrence ratio for interest rates equal to or above 3.5%
0% - occurrence ratio for interest rates equal to or less than 0.25%
UK rate cuts will only become a possibility in the event that activity
materially undershoots the MPC’s forecast, inflation expectations fall
back, or the UK leaves the EU in disorderly fashion.
YFEFs Base (average) scenario is higher than the average of HMT’s. We
forecast the MPC has increased the Central Bank rate to mitigate the
effect of cost push inflationary pressures stemming from a depreciation
of sterling.
When comparing YFEF’s forecast rates of interest, alongside the historical
period between 1993 to 2019 it appears that the Upside scenarios are
reasonable. Frequent interest rate values occurred between 5% and 6%,
reflecting monetary policy before the global financial crisis, and between
0.5% and 1%, reflecting monetary policy after the crisis when bank rates
have been at historically low levels.
Source : YFEF, HMT, Oxford Economics and ONS Fabian Society |YF Finance & Economics | 16
0.0%
0.5%
1.0%
1.5%
2.0%
2.5%
3.0%
3.5%
4.0%
4.5%
Upside
CapitalEconomics
EconomicPerspectives
BeaconEconomicForecasting
SantanderGBM
Citigroup
SocieteGenerale
Base
ITEMClub
Heteronomics
Pantheon
NatwestMarkets
INGFinancialMarkets
Commerzbank
KernConsulting
CEBR
OxfordEconomics
Nomura
DaiwaCapitalMarkets
ExperianEconomics
Downside
Annualearnings(annual%change)
-10%
-8%
-6%
-4%
-2%
0%
2%
Upside
Maximum
Median
Mean
Base
Minimum
Downside
2019YoYGrowth
Commercial HPI and average earnings forecasts
Growth in Commercial property prices forecasts for 2019 Growth in average annual earnings forecasts for 2019
Source : YFEF, HMT, and Investment Property
YFEF’s 2019 scenario for growth in office commercial property values
have been benchmarked against 27 other institutions sourced from the
Investment Property Forum Consensus forecasts (only the average and
range are available, the individual forecasts are not publicly available).
The growth in office capital values for 2019 is shown in Figure 17, and
ranges from -8% to +2%.
Though the cost of imported raw materials rose sharply in 2017,
reflecting the impact of sterling depreciation in 2016, this effect has
faded. We estimate that there is still some spare capacity in the
economy, which should continue to weigh on earnings growth and
profit margins for the next few years, so market cost risk should
remain low
Fabian Society |YF Finance & Economics | 17
-1%
0%
1%
2%
3%
4%
5%
Upside
BeaconEconomic
Forecasting
Commerzbank
DaiwaCapital
Markets
Economic
Perspectives
Pantheon
ITEMClub
Base
CapitalEconomics
Heteronomics
OxfordEconomics
Downside
Growth(Q4onpreviousQ4,%)
2019
Upside
ExperianEconomics
BeaconEconomic
Forecasting
DaiwaCapitalMarkets
Pantheon
ITEMClub
KernConsulting
Commerzbank
Heteronomics
Base
OxfordEconomics
CapitalEconomics
EconomicPerspectives
Downside
2020
Housing price forecasts
Comparison of YFEF’s housing price scenarios with 2019, 2020 central forecasts of other institutions
Source: YFEF and HMT
YFEF’s Base and Downside is relatively more pessimistic than their peers. This forecast is influenced by UK house prices dropping for the second month
in a row, falling 0.2% in July as continued economic uncertainty led to a reduction in sales, HMRC data indicated that UK home sales are on the
downturn, with sales in June coming in 16.5% lower than the same month in 2018 at 84,490, though mortgage approvals remained steady at around
66,000 according to figures from the Bank of England.
Fabian Society |YF Finance & Economics | 18
-2
0
2
4
6
8
10
2014 2015 2016 2017 2018 2019 2020 2021 2022 2023
HPI-YoYGrowth(%)
Base Upside Downside
HMT Consensus - Average HMT Consensus - Lowest (Medium-Term forecast) HMT Consensus - Highest (Medium-Term forecast)
Oxford Economics
Historical housing price vs minimum of Upside scenarios and maximum of Downside scenarios
-10
-5
0
5
10
15
20
25
1981
1982
1983
1984
1985
1986
1987
1988
1989
1990
1991
1992
1993
1994
1995
1996
1997
1998
1999
2000
2001
2002
2003
2004
2005
2006
2007
2008
2009
2010
2011
2012
2013
2014
2015
2016
2017
2018
2019
2020
2021
2022
2023
HPIannualgrowth(%)
Historial HPI Downside Base Upside Upside Max Downside Min
48% - occurrence ratio for HPI equal to or above 8.5%
11% - occurrence ratio for HPI equal to or less than -1.6%
Housing price forecasts
Medium term housing price forecasts for the next five years
Source : YFEF, HMT, Oxford Economics and ONS Fabian Society |YF Finance & Economics | 19
EconomicPerspectives
Upside
Heteronomics
BeaconEconomicForecasting
CapitalEconomics
CEBR
SocieteGenerale
JPMorgan
KernConsulting
Pantheon
Nomura
DeutscheBank
Downside
Base
ITEMClub
ExperianEconomics
INGFinancialMarkets
SantanderGBM
BloombergEconomics
OxfordEconomics
NatwestMarkets
DaiwaCapitalMarkets
BankofAmerica-MerrillLynch
Commerzbank
2020
0.0%
0.5%
1.0%
1.5%
2.0%
2.5%
3.0%
3.5%
4.0%
EconomicPerspectives
Upside
CEBR
CapitalEconomics
CBI
KernConsulting
ExperianEconomics
SantanderGBM
Nomura
NatwestMarkets
INGFinancialMarkets
Base
ITEMClub
Downside
OxfordEconomics
BeaconEconomic
Forecasting
Pantheon
Commerzbank
Citigroup
BloombergEconomics
SocieteGenerale
JPMorgan
DeutscheBank
DaiwaCapitalMarkets
BankofAmerica-Merrill
Lynch
Heteronomics
CPI%,Q4
2019
CPI forecasts
Comparison of YFEF’s CPI scenarios with 2019, 2020 central forecasts of other institutions
Source: YFEF and HMT
Higher inflation for the Downside scenarios have been justified by YFEF
envisaging a cliff-edge Brexit with no deal and higher import prices. This
could lead inflation to be above target.
YFEF would normally expect the Upside to have higher inflation than
the Base case, reflecting stronger demand in the economy.
Our scenarios for 2020 indicate slightly higher levels of inflation than
other institutions forecasts. This stems from welfare freeze coming to
an end and economic recovery (consistent with our scenario for
GDP annual growth rates).
Fabian Society |YF Finance & Economics | 20
0
1
2
3
2014 2015 2016 2017 2018 2019 2020 2021 2022 2023
CPIAnnualGrowth(%)
Downside Base
Upside Oxford Economics
HMT Consensus - Average HMT Consensus - Lowest (Medium-Term forecast)
HMT Consensus - Highest (Medium-Term forecast)
0
1
2
3
4
5
1992
1993
1994
1995
1996
1997
1998
1999
2000
2001
2002
2003
2004
2005
2006
2007
2008
2009
2010
2011
2012
2013
2014
2015
2016
2017
2018
2019
2020
2021
2022
2023
CPIannualgrowth(%)
Historical CPI Upside Base Downside Upside max Downside min
18% - occurrence ratio for CPI equal to or above 2.8%
11% - occurrence ratio for CPI equal to or less than 1.0%
CPI forecasts
Medium term CPI forecasts for the next five years
Source : YFEF, HMT, Oxford Economics and ONS
YFEF’s Downside scenario shows a relatively high CPI inflation rate in
the Downside taking into account of the following scenarios:
• Tariffs and other barriers to trade between the UK and EU are
introduced suddenly from 2019Q4 onwards increasing the price of
raw materials; and,
• This is further exacerbated by depreciation of sterling as demand for
the pound falls within FOREX.
YFEF’s Downside and Upside CPI inflation rates have occurred between
1.0 to 2.8% (respectively) which is in line historical frequencies seen since
inflation targeting was adopted in 1992.
Historical CPI vs minimum of Upside scenarios and maximum of
Downside scenarios
Fabian Society |YF Finance & Economics | 21
-1
0
1
2
3
4
5
2015 2016 2017 2018 2019 2020 2021
CPI(annual)%
Min - BoE Lowest [15- 26%] Low - Medium [11- 16%]
Central [13- 23%] Medium - Optimistic [13- 22%] Optimistic [12- 14%]
Highest [9- 29%] Upside Base
Downside Mode BoE
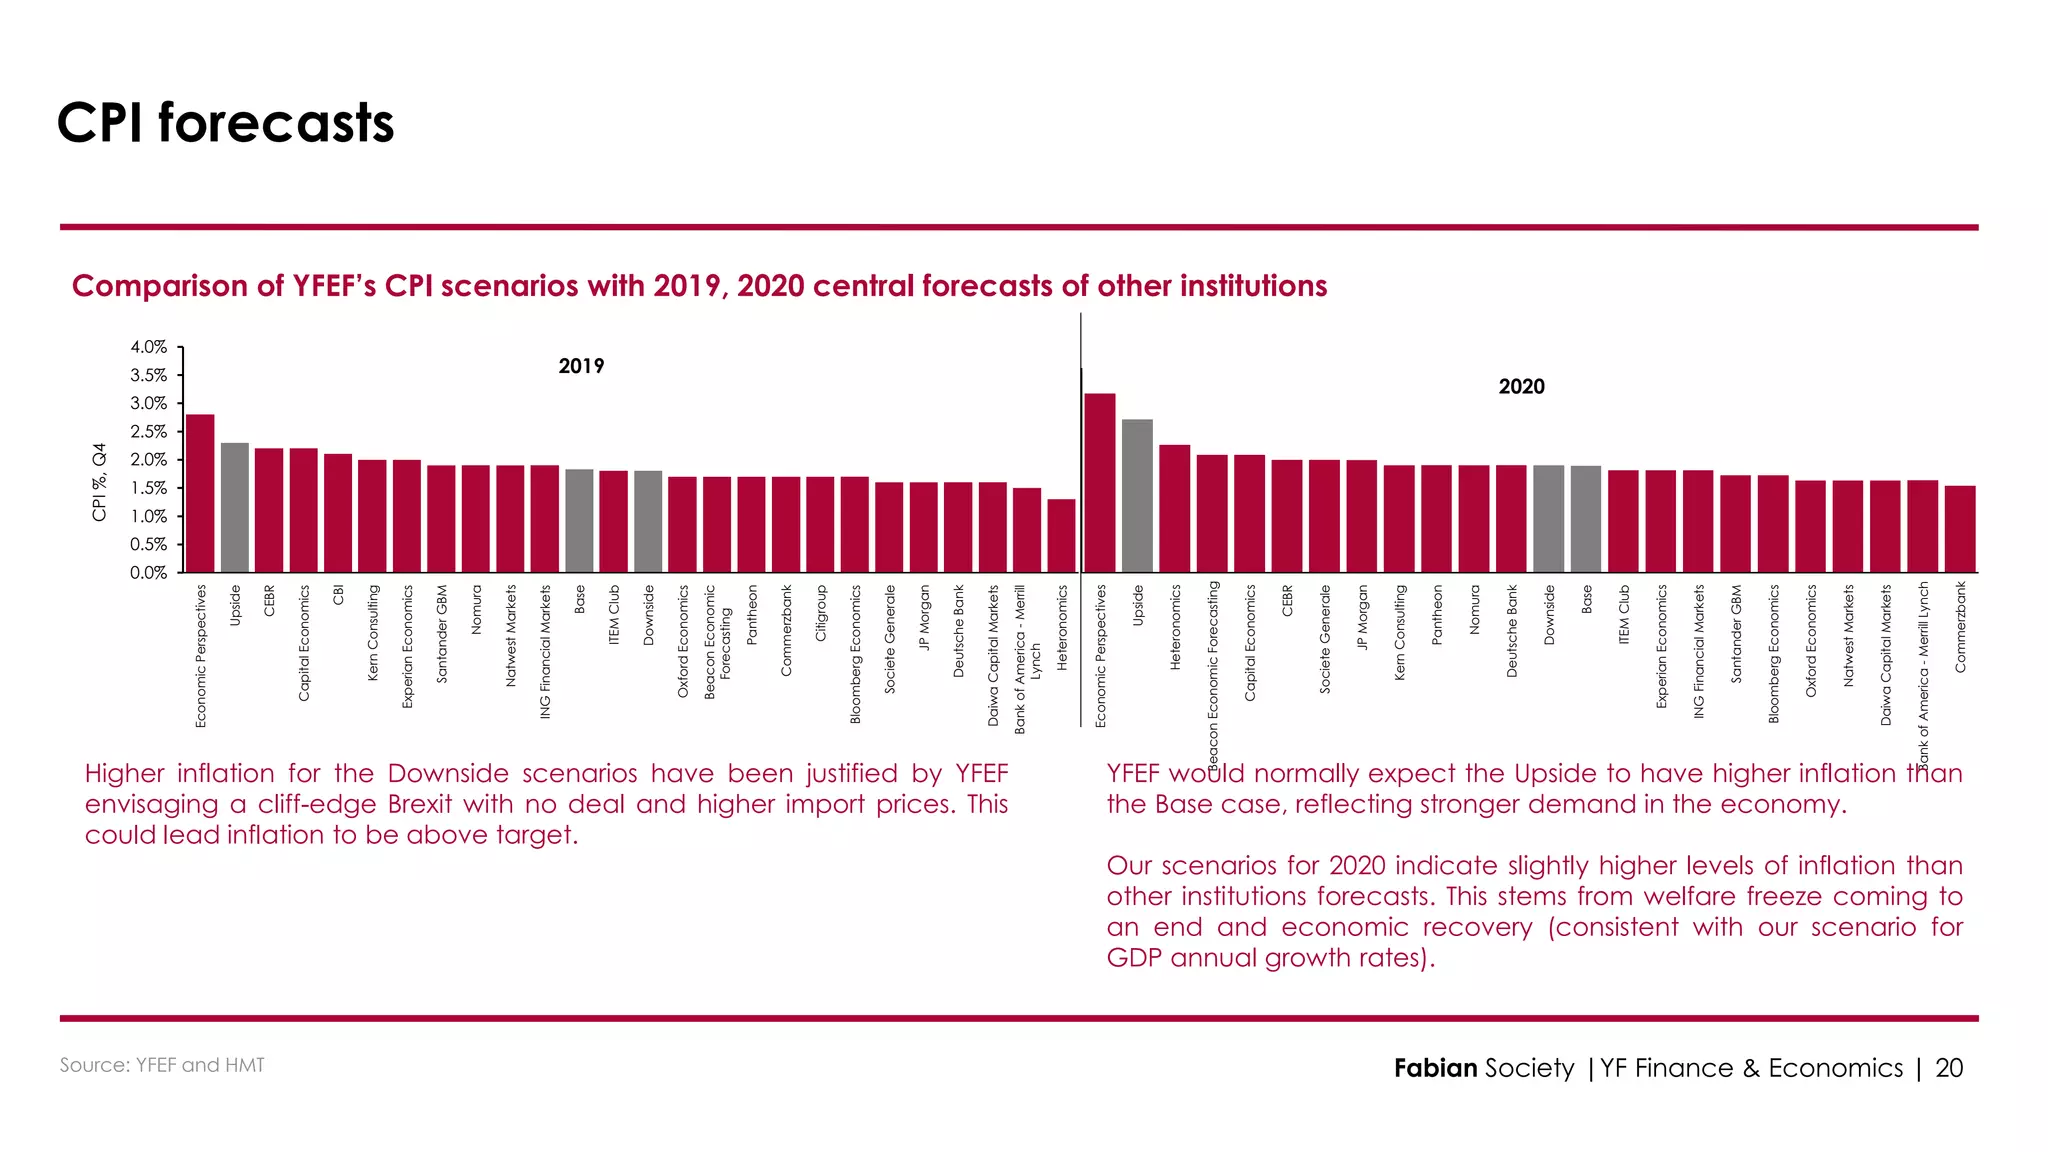
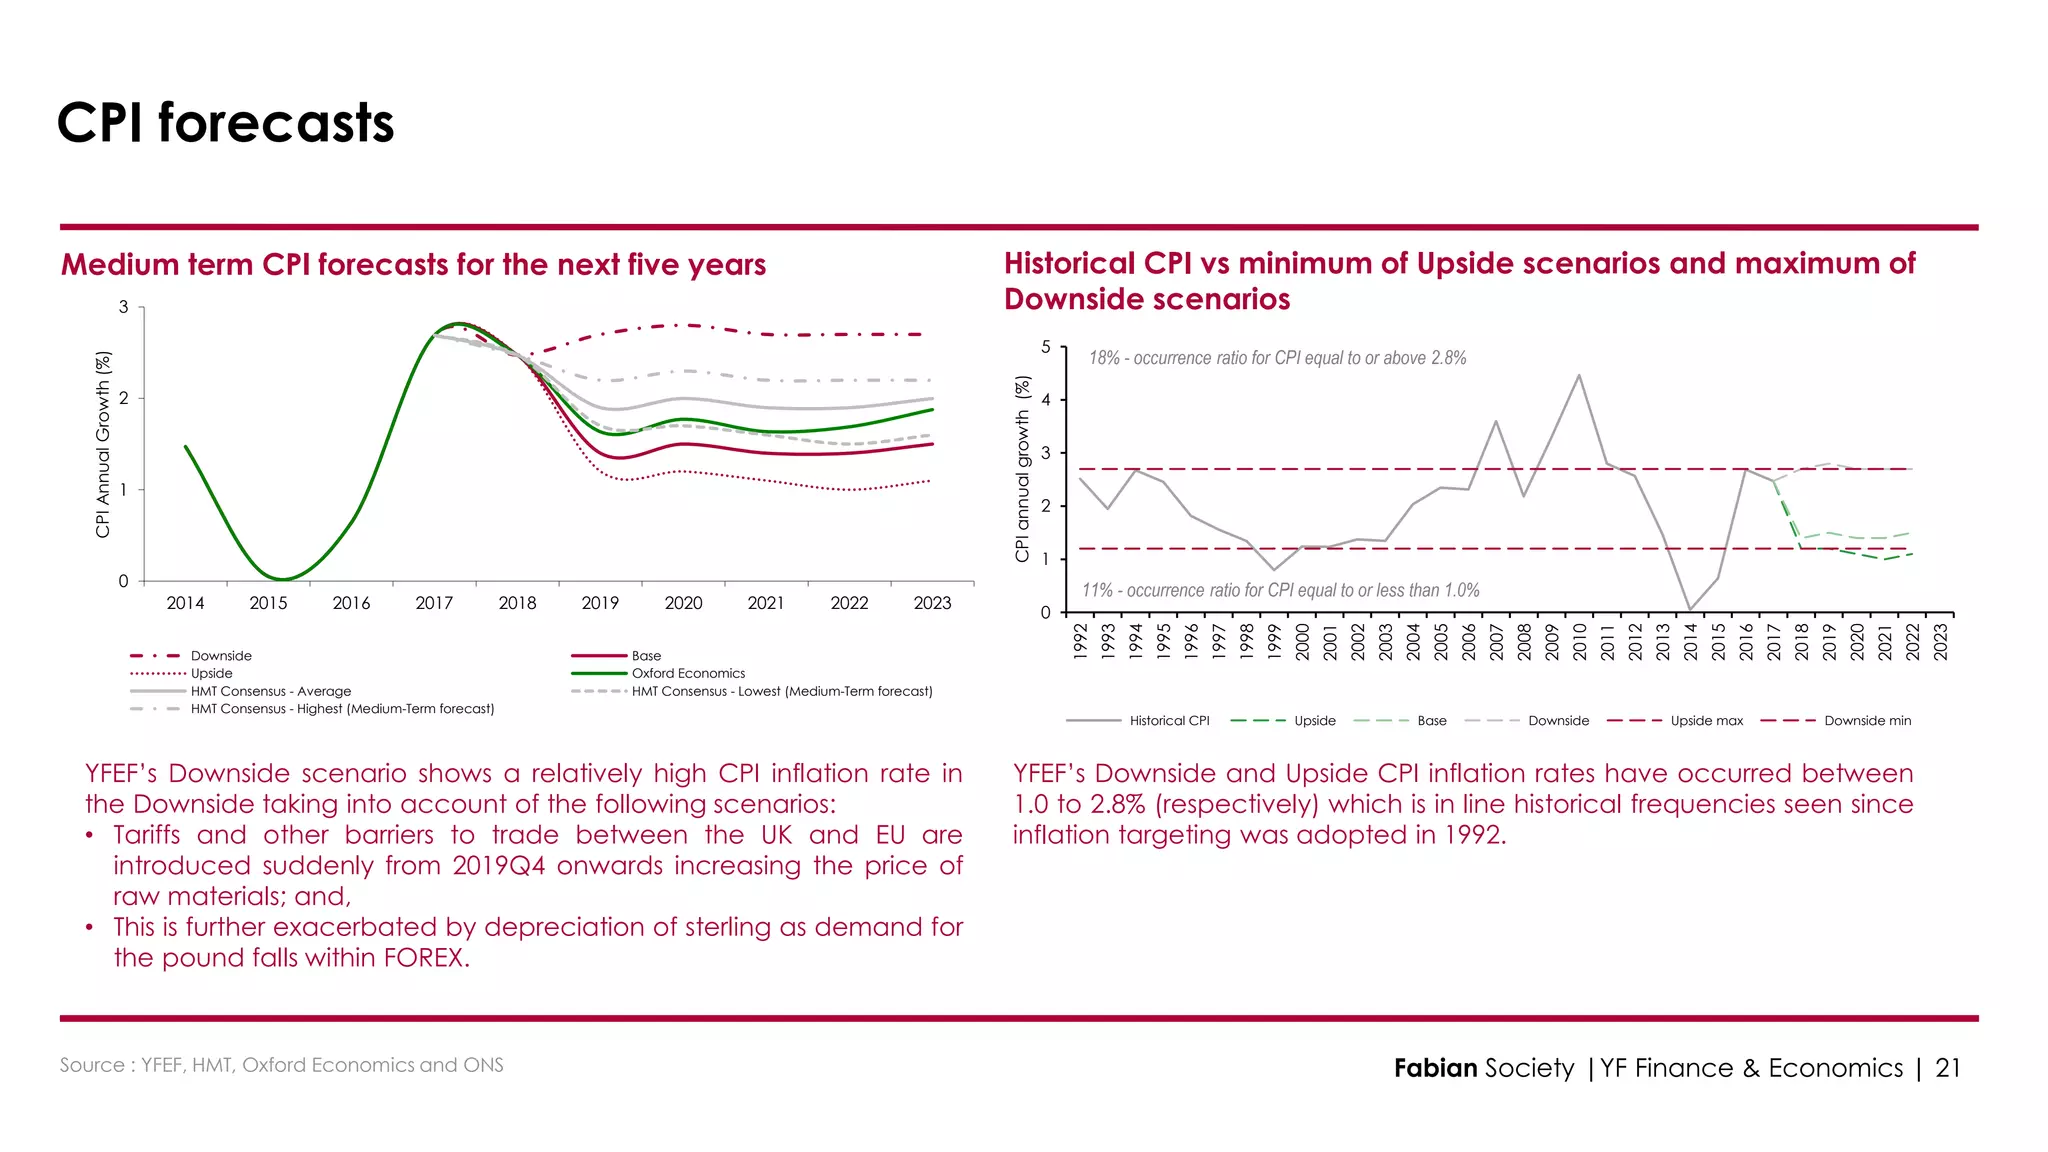
Comparison of YFEF’s CPI forecast scenarios vs BoE’s GDP Fan Chart
CPI forecasts
YFEF’s scenario have been compared against the latest Bank of England (BoE)
CPI forecast fan chart. The fan chart shows that the three scenarios from YFEF
are within a narrow range of the BoE’s fan.
Fabian Society |YF Finance & Economics | 22
THANK YOU
Lead author and economist
Amarvir Singh-Bal
Contributors
Contact address:
economynetwork@youngfabians.org.uk
Communications
Gregory Gillette
Economist and forecaster
Guilherme Rodrigues
President
Jeevun Sandher

Yf econ update-2019-08_v1.0