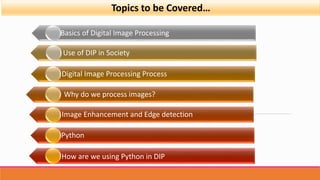
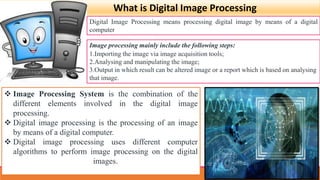
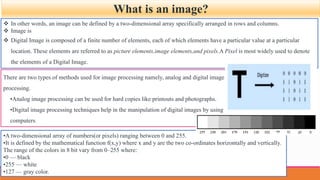
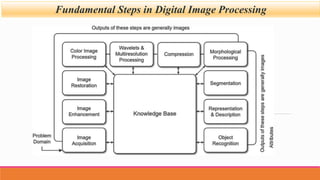
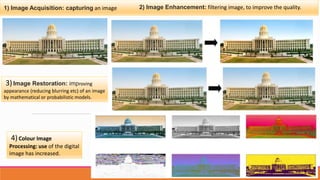
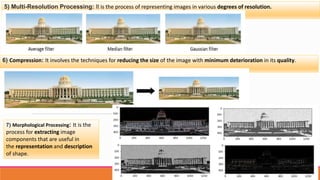
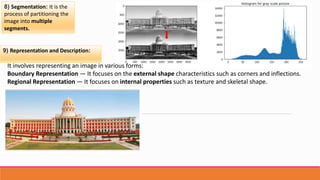
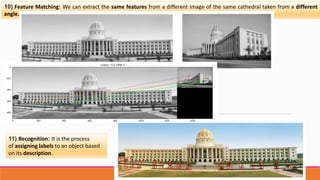
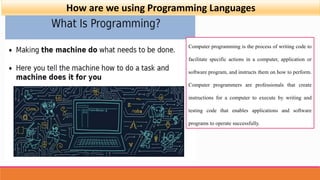
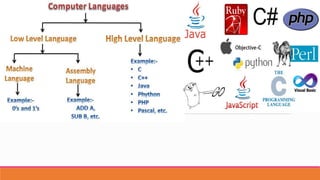
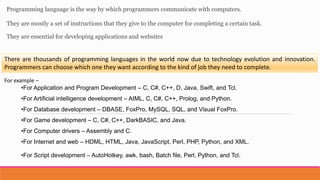
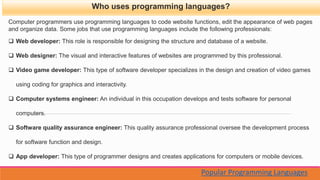
The document discusses digital image processing, including its definition, significance, and various techniques used for image enhancement and manipulation using Python. It outlines the fundamental steps in the digital image processing workflow, such as image acquisition, enhancement, restoration, and segmentation. Additionally, it touches upon the role of programming languages in image processing and lists popular programming tools utilized in the field.


![1 [Autosaved].pptx](https://cdn.slidesharecdn.com/ss_thumbnails/1autosaved-231007112012-6535a7e2-thumbnail.jpg?width=640&height=640&fit=bounds)