
Downloaded 278 times


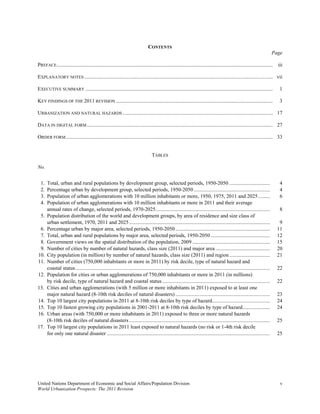


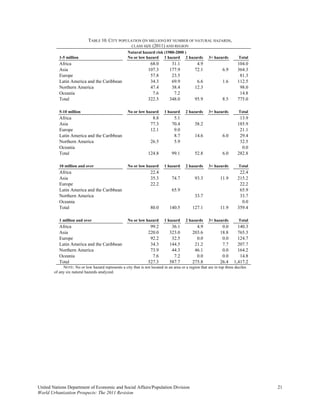
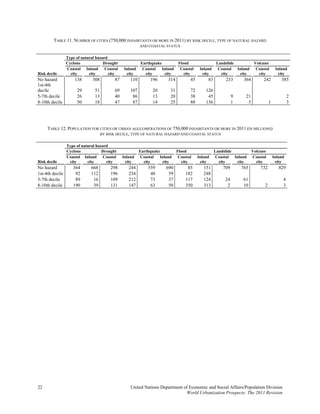
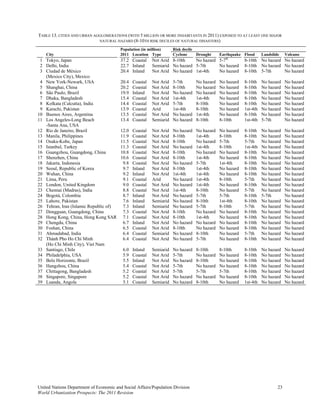
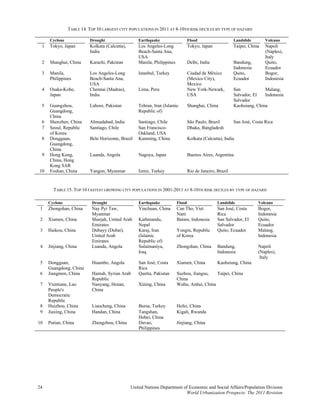

The document presents the World Urbanization Prospects 2011 revision from the United Nations, highlighting global urban and rural population data. It provides essential estimates and projections for urban agglomerations, alongside trends in urbanization, migration, and socio-economic factors affecting population distribution. Additionally, it notes the role of the UN Department of Economic and Social Affairs in providing data and guidance on population and development issues.


![Urban planning and development:in the context of nepal [compatibility mode]](https://cdn.slidesharecdn.com/ss_thumbnails/urbanplanninganddevelopment-inthecontextofnepalcompatibilitymode-141227074431-conversion-gate01-thumbnail.jpg?width=640&height=640&fit=bounds)


