Download to read offline
![2014
REVISION
highlights[ ]
World
Urbanization
Prospects
United Nations](https://image.slidesharecdn.com/annexes-170917112034/85/Annexes-1-320.jpg)
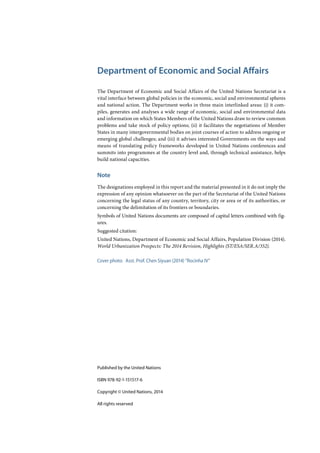


![2021NATIONALLEAGUEOFCITIESTRENDSINSMARTCITYDEVELOPMENT
TrendsinSmartCityDevelopment
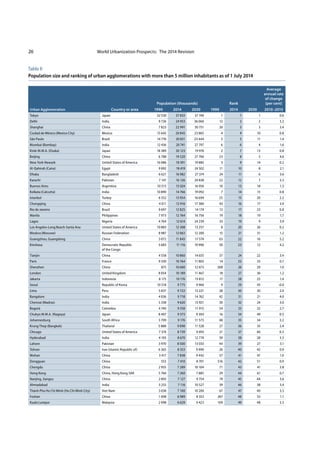
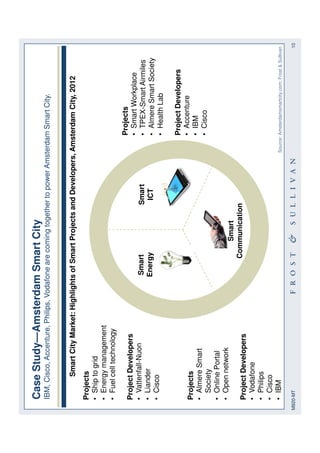
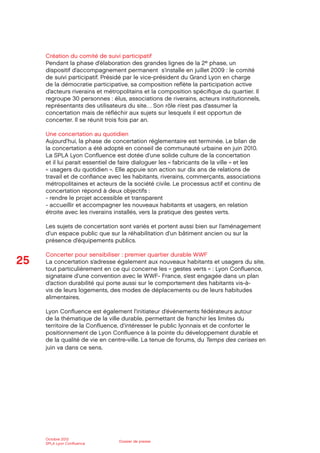
CommunityEngagement
Theconcernoverprivacyisnotlimitedto
projectmanagers.Thereisstillaquestion
ofhowthecommunitywillrespondtothe
sensorsmonitoringtheirneighborhoods.
LeeTien,aseniorstaffattorneyatthe
ElectronicFrontierFoundation,likened
sensorprojectstoincreasedsurveillance
andwonderedhowmuchforcesuch
privacypolicieswillreallyhaveifthe
police,forexample,requestinformation
thatwouldviolatethem.Theproject
managersareawarethatconcernslike
thesecouldbeanissue.Aspartoftheir
governancedocument,they’veincluded
provisionsforcommunityoutreachin
anyareaswherenodesmightbeplaced.
Thatoutreachincludesmeetingwith
aldermenandwomenandcommunity
leaders,andholdingcommunitymeetings
withresidents.Inaddition,theyplanto
holdworkshopsto,“introduceconcepts,
rangingfromenvironmentalscienceto
electronicsdesigntodataanalytics,to
neighborhoodyouth.”
Thecity’sSmartCommunitiesinitiative
includesadigitalliteracyandoutreach
programthatincreasedratesof
broadbandadoptionandinternetusage,
includingjobsearch[es]inthecity’s
ninepredominatelyAfrican-American
andLatinolow-andmiddle-income
neighborhoods.Between2008(when
theprogramwasimplemented)and2013,
thoseneighborhoodsintheinitiativesaw
a13percentagepointincreaseininternet
usage.
Whilethisprogramdoesnotnecessarily
demonstratehigh-techdelivery,itworks
toincreaseconnectivityinthecity,
makingitmorelikelythattheresources
developedthroughprojectsliketheAoT
willbeutilizedbyandaccessibletoall
cityresidents.
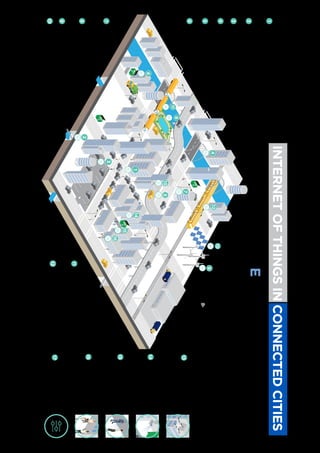
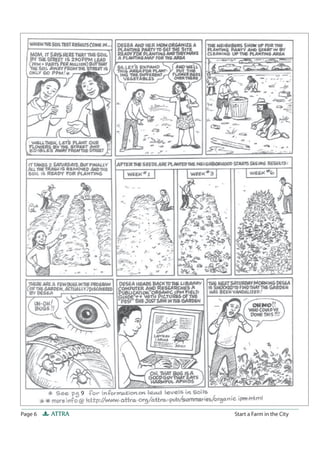
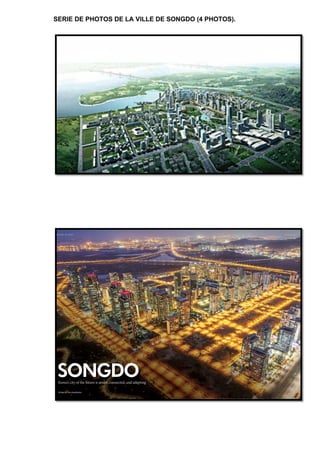
TheInternetofThings
Aswireless,Bluetooth,andsensor
technologyhasbecomeincreasingly
sophisticatedandinexpensiveithas
movedfrombeingfoundexclusively
inexpensivehi-techproductssuch
ascomputersandcellphonesto
increasinglylow-tech,evenanalog,
itemssuchasthermostats,coffee
makers,andeventoys.Together
withtheadventofcloudnetworked
computer,whichhasminimalized
theneedforphysicalstorageand
computingpowerinadevice,the
devicesaroundusareundergoing
aconceptualreinvention.Every
consumerproductorpieceof
infrastructureincreasinglyhasthe
abilitytosensesurroundingstimuli,to
communicatewitheachother,andto
drawonthecomputingandstorage
powerofthecloud.Thisphenomenon
hasbeendubbedtheInternetof
Things(IoT).Essentially,theseismic
changethattheinternetbroughtto
computersisnowextendingitself
beyondcomputerstoincreasingly
simpleandinexpensivedevices.
Marketincentivesforthisshiftare
high.Themoresmartdevicesthere
are,themoredataisgenerated
aboutconsumer’spreferencesand
habits.Butwhatdoesthismeanfor
cities?Smartcitiesareemployingthe
sametechnologytoconnecttheir
disparateutility,infrastructure,and
publicservicegrids,generatingreal-
timeaggregatedata.Thisinturncan
helpcitiesmanagetheirprograms
andservicesmoreeffectivelyand
gaugetheirimpactimmediately.
Sensorsinstalledonwaterpipes
candetectleaksandcommunicate
themtothewaterutilityinstantly.
Smartparkingmeterscannotify
parkingagentswhentheyaretimed
out,aswellasresidentswhena
spaceisfree.Smartinfrastructure
communicatingwithitsutilitiesisjust
aone-sidedexchange.Increasingly,
asautonomousvehiclesanddrones
fillcitystreetsandskylines,smart
citieswillinvestininfrastructure
tovehicle(I2V)technology,where
trafficlightsandpublicinfrastructure
communicateswiththesmartdevices
aroundthem.Thecityofthefutureis
aninterconnectedone,wheredevices
communicatewithoneanotherina
constantstreamofdatathatprovides
real-timeinformationtothepublic
andthemunicipality.Asthistrend
accelerates,innovativecitieswill
becomemoreefficient,open,and
responsivetotheirresidents.](https://image.slidesharecdn.com/annexes-170917112034/85/Annexes-66-320.jpg)
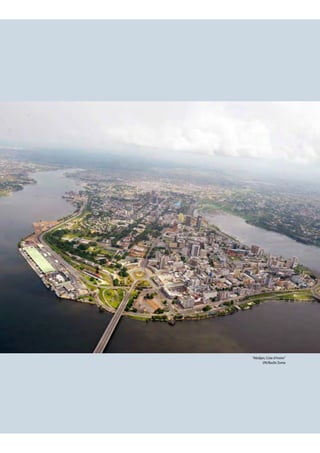
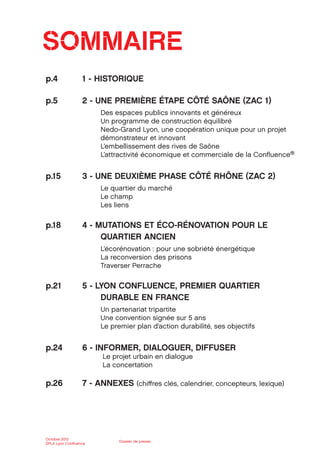
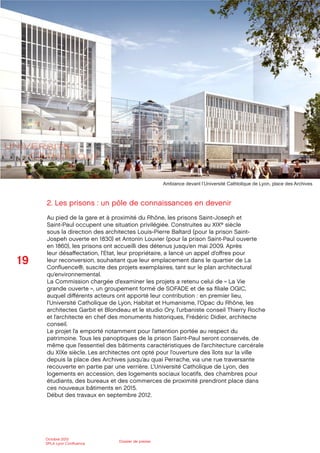
![2425NATIONALLEAGUEOFCITIESTRENDSINSMARTCITYDEVELOPMENT
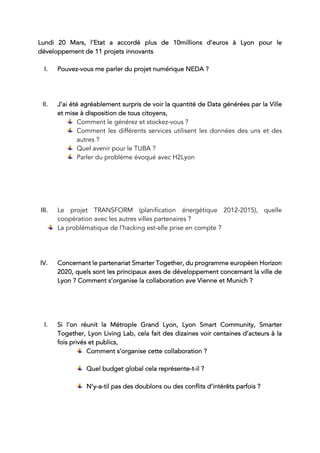
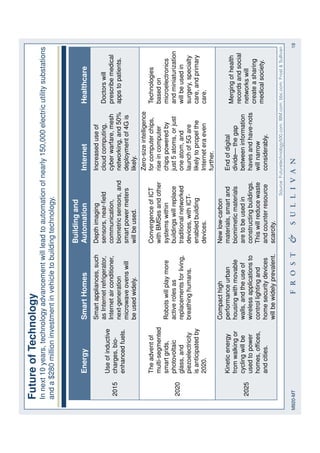
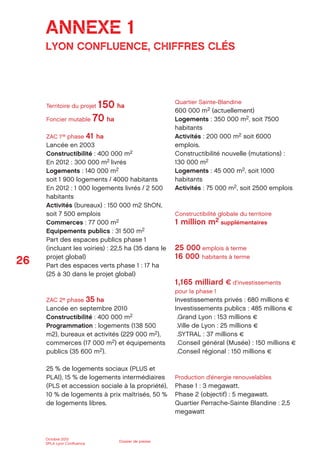
TrendsinSmartCityDevelopment
theuniversity“hashadalonghistory
ofworkingwithagenciesoftheCityof
Philadelphiatoapplyknowledgeand
skillstohelpcontributetosolutions
tochallengesthatfacethecity.”5
In
collaborationwiththecityofPhiladelphia,
DrexelandtheUniversityofPennsylvania
willfocusonincorporatingtechnology
andanalyticstoimproveexistingpublic
serviceinfrastructure,tomeasurethe
impactofnewinfrastructures(toinclude
greeninfrastructure),andtoaddress
inclusiveeconomicdevelopment.
TheUniversityofPennsylvaniaisalso
partneringwiththecityofPhiladelphia
topromotedatacollectionviageospatial
technologiesthatareusedtovisualize,
measure,andanalyzetheearth’sfeatures.
ThetechnologiesincludeGPS,GIS,and
remotesensing(RS).TheOITprovides
GISservicesthathelp“developand
deliverstate-oftheart....technologyand
servicestotheenterprise(citywide).”6
GISServicesGroup(GSG)providescity
officialswiththetechnologytohelp
develop,deploy,andmaintainspatial
data,aswellasprovide30geospatialweb
services.Withover200,000hitsdaily,
thecity’sgeospatialwebservicesand
applicationsproviderelevantinformation
onurbandevelopmentandhavebroad
applicationsforPennsylvania’sbusinesses
andnonprofits.
CommunityEngagement
AnotherinitiativethattheOITis
workingtowardsisPhilly311,which
willopenthelinesofcommunication
betweenPhiladelphiaresidentsand
thegovernment.Philly311usessocial
mediaandphoneapplicationsasa
forumtocommunicatewithcitizens
inrealtime.7
Anexampleofthis
communicationincludescityleaders
usingTwittertocommunicatetocitizens
abouttrafficpatterns.AsPhiladelphia’s
urbanpopulationcontinuestogrow,
Philly311hasthepotentialtoimprove
communicationbetweenpublicofficials
andresidents.
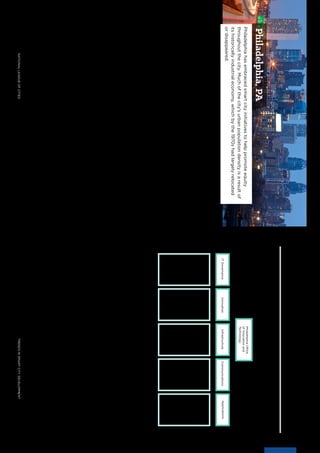
Charlotte,NC
Overthepastdecade,Charlottehasundergonetremendous
growth.AccordingtotheU.S.CensusBureau,Charlottesawthe
10th
largestincreaseinpopulationamonglargecities.
Charlottegrewby17,695peoplefrom
July2014toJuly2015,resultinginatotal
populationof827,0978,9
.Whilemost
largecitiessuchasNewYork,Boston,
andChicagoareseeingslowornegative
growth,Charlottehasbecomeahub
formajorcorporateexpansionsaswell
asanexpandingsuburbanpopulation.
Withvastamountsofruralarea,warmer
weather,andlowercostsofliving,
southerncitiessuchasCharlottepresent
notonlyopportunityforbusinessowners
butalsoamorehospitableenvironment
forfamiliesaimingtomoveawayfrom
larger,overpopulated,andoldercities.
MuchofCharlotte’seconomicsuccessis
attributedtobeingthesecondbiggest
bankingcenterinthecountrybehind
NewYorkCity.Charlottehoststhe
headquartersofBankofAmerica,aswell
asmajorregionaloperationalfacilitiesfor
anumberofotherinstitutions,including
Citi,AllyFinancial,JPMorganChase,
andWellsFargo.Newjobsarequickly
beingaddedtoCharlotteasthese
bankinginstitutionscontributetoawider
economyinfinancialservices.10
Withan
increaseinavailablejobs,therehasbeen
aninfluxofyoungerpeoplemovingto
Charlotteforeducationandemployment
opportunities.11
Thecityiscurrentlyfacing
thepressuresofpopulationgrowth,andis
focusingonwaystosustainthisgrowth.
Policy
Unlikeothercities,wherethecity
governmentplaysalargeroleinmany
smartcityinitiatives,cityleadersin
Charlottehavetakenamorehands-off
approach.Insteadofactivelycollecting
dataandconstructingmetrics,the
municipalityhasembracedamarket-
orientedandfacilitativerole,aimingto
“encourageindependentactionsfrom
awiderangeofparticipants.”12
Thecity
ofCharlotteintendstouseoutside
resourcestoeducatecitizensonhow
theirbehaviorscontributetoproblems
suchasenergywaste,andhowtheycan
changethosebehaviors.13
Administration
OnesmartinitiativeisEnvision
Charlotte,anon-profitpublicprivate
collaborativeorganizationestablished
in2011andfundedbygrantsfromthe
DepartmentofEnergy.Envisionfocuses
onusingsustainabilitytopromote
economicdevelopment.Createdby
partnershipsbetweenDukeEnergy,
Cisco,andCharlotteCenterCity
Partners,EnvisionCharlotteaimsto
help“accelerate[initiatives]fueledby
civicandcorporateleaderscommitted
tofurthertransformingthecityinto
thecountry’smostsustainablecore.”14](https://image.slidesharecdn.com/annexes-170917112034/85/Annexes-68-320.jpg)


![4243NATIONALLEAGUEOFCITIESTRENDSINSMARTCITYDEVELOPMENT
TrendsinSmartCityDevelopment
Endnotes
1Ebi,Kevin(2014).Philadelphiacreditssmartpolicingfor
lowercrimerates.SmartCitiesCouncil.Retrievedfromhttp://
smartcitiescouncil.com/article/philadelphia-credits-smart-
policing-lower-crime-rates
2Richey,Erin(2014).HowDataAnalysisHelpsPolice
DepartmentsFightCrime.Forbes.Retrievedfromhttp://www.
forbes.com/sites/emc/2014/06/03/data-analysis-helps-police-
departments-fight-crime/#2a75624043e8
3Faulstick,Britt(2015).DrexelandPennJoinWhiteHouseSmart
CitiesInitiative.DrexelNow.Retrievedfromhttp://drexel.edu/now/
archive/2015/September/MetroLab-Network/
4Lang,Deborah(2015).UniversityofPennsylvaniaAnnounces
CollaborationwithPhiladelphiainNewWhiteHouseMetroLab
Network.PennNews.Retrievedfromhttps://news.upenn.edu/
news/university-pennsylvania-announces-collaboration-city-
philadelphia-new-white-house-metro-lab-net
5Seenote48
6OfficeofInnovationandTechnology,GISServicesGroup.
Retrievedfromhttp://www.phila.gov/it/aboutus/units/Pages/
GISServicesGroup.aspx
7Philly311.Retrievedfromhttp://www.phila.gov/311/Pages/
default.aspx
8U.SCensusBureau
9Off,Gavinet.al(2016).Areyou1inamillion?Charlotte’sgetting
there.TheCharlotteObserver.Retrievedfromhttp://www.
charlotteobserver.com/news/local/article78623577.html
10Christie,Les(2014).10fastestgrowingcities.CNN
Money.Retrievedfromhttp://money.cnn.com/gallery/real_
estate/2014/03/27/fastest-growing-cities/8.html
11Off,GavinandPurvis,Kathleen(2014).Charlottesjoinsnation’s
fastest-growingcities.TheCharlotteObserver.Retrievedfrom
http://www.charlotteobserver.com/news/local/article9241220.html
12Graves,Bob(2016).Charlotte,N.C.:TheMakingofa‘Smart
City.’FutureStructure.Retrievedfromhttp://www.govtech.com/
fs/perspectives/Charlotte-NC-The-Making-of-a-Smart-City.html
13Pentland,William(2011).HowCharlotteBusinessesAreTackling
EnergyWasteThroughData.Forbes.Retrievedfromhttp://www.
forbes.com/sites/williampentland/2011/12/22/energy-data-the-
keys-to-the-utility-kingdom/#21b671673032
14HelpingthecityofCharlotteEnvisionaMoreSustainable
Future(2015).Verizon.Retrievedfromhttp://www.
verizonenterprise.com/resources/casestudies/cs_helping-the-city-
of-charlotte_en_xg.pdf
15http://www.duke-energy.com/news/releases/2010092301.asp
16http://www.baselinemag.com/innovation/charlotte-envisions-a-
smart-future.html
17DukeEnergy,SmartEnergyinOfficesretrievedfromhttp://
www.smartenergyinoffices.com/
18Ibid.
19SFEnvironment.(2012,November12).DesigningaSmarter,
MoreSustainableSanFrancisco.RetrievedAugust06,2016,from
http://sfenvironment.org/news/update/designing-a-smarter-and-
more-sustainable-san-francisco
20SanFranciscoclosertoturningzero-wasteambitioninto
reality.(n.d.).Retrievedfromhttps://www.theguardian.com/
environment/2014/jun/17/san-francisco-zero-waste-recycling-
composting
21SFEnvironment.(2012,November12).DesigningaSmarter,
MoreSustainableSanFrancisco.RetrievedAugust06,2016,from
http://sfenvironment.org/news/update/designing-a-smarter-and-
more-sustainable-san-francisco
22Ibid
23SanFranciscoOpenData.(n.d.).AboutSanFrancisco
OpenData.RetrievedJuly28,2016,fromhttps://data.sfgov.org/
about
24SFMTAMunicipalTransportationAgency.(2015,April22).Muni
Forward.ImplementationWorkbook.RetrievedAugust15,2016,
fromhttps://www.sfmta.com/sites/default/files/projects/2015/
About,%20TEP,%20MF_0.pdf
25Chong,R.(2013,May1).SFMayorSignsLandmarkOpenData
PolicyandProceduresLegislation.
26SFMayor’sOfficeofCivicInnovation.OfficeofMayorEdwin
M.Lee.(n.d.).LivingInnovationZones.RetrievedAugust2,2016,
fromhttp://innovatesf.com/projects/living-innovation-zones/
27DesigningSmarter,MoreSustainableSanFrancisco.(n.d.)
Retrievedfromhttp://sfenvironment.org/news/update/designing-
a-smarter-and-more-sustainable-san-francisco
28Indiaonlinepages.com.(n.d.).PopulationofDelhi2016.
RetrievedAugust14,2016,fromhttp://www.indiaonlinepages.
com/population/delhi-population.html
29Ibid
30MinistryofUrbanDevelopmentGovernmentofIndia.(2015).
SmartCities.MissionStatements&Guidelines.Retrievedfrom
http://smartcityludhiana.in/
31DelhiMetro-RailwayTechnology.n.d.Retrievedfromhttp://
www.railway-technology.com/projects/delhi-metro/
32Railway-Technology.com.(n.d.).DelhiMetro,India.Retrieved
August12,2016,fromhttp://www.railway-technology.com/
projects/delhi-metro/
33Ibid
34Ibid
35DelhiMetro.(2016,May4).DelhiGovt.todispatchCommon
MobilityCardformetroandtransportbusesfromJuly.Retrieved
fromhttp://www.delhimetrorails.com/delhi-govt-to-
36Aijaz,R.,&Hoelscher,K.(2015,December).India’sSmartCities
Mission:AnAssessment.ORFIssueBrief.
37Ibid
38Ibid
39EletsNewsNetwork.(2016,March).DDAlaunchestoolfor
onlinemonitoringofprojects.Retrievedfromhttp://smartcity.
eletsonline.com/dda-launches-tool-for-online-monitoring-of-
projects/
40TheCentreforInternet&Society.(2016,June).SmartCity
PoliciesandStandards:OverviewofProjects,DataPolicies,and
StandardsacrossFiveInternationalSmartCities.Retrievedfrom
http://cis-india.org/internet-governance/blog/policies-and-
standards-overview-of-five-international-smart-cities
41TheCentreforInternet&Society.(2016,June).SmartCity
PoliciesandStandards:OverviewofProjects,DataPolicies,and
StandardsacrossFiveInternationalSmartCities.Retrievedfrom
http://cis-india.org/internet-governance/blog/policies-and-
standards-overview-of-five-international-smart-cities
42MinistryofUrbanDevelopmentGovernmentofIndia.(2015).
SmartCities.MissionStatements&Guidelines.Retrievedfrom
http://smartcityludhiana.in/
43Gupta,M.D.(2016,January).Delhi’sVIPzoneonlistof20for
smartcityproject.HindustanTimes,NewDelhi.
44http://www.business-standard.com/article/politics/
delhi-govt-to-seek-public-opinion-on-app-based-bus-
service-116060301223_1.html
45PricewaterhouseCoopersIndia.(2015).Makingcitiessmartand
sustainable.
46EletsNewsNetwork.(2016,May).WorldBank,ADBgearup
forfundingsmartcityprojectsinIndia.http://smartcity.eletsonline.
com/world-bank-adb-gear-up-for-funding-smart-city-projects-in-
india/
47O’Leary,R.&Vij,N.(2012).Collaborativepublicmanagement:
Wherehavewebeenandwherearewegoing?AmericanReview
ofPublicAdministration,42(5),p.509-510.
48Ibid.
49Ebi,K.(2Aug2016).The#1overlookedsmartcityresource
(andit’susuallyfree).SmartCitiesCouncil.Retrievedfromhttp://
smartcitiescouncil.com/article/1-overlooked-smart-city-resource-
and-its-usually-free.
50Ibid.,p.512-513.Seealso:EmersonK,NabatchiT,BaloghS
(2012).An
IntegrativeFrameworkforCollaborativeGovernance.Journal
ofPublicAdministrationResearchandTheory,22(1),p.20,
particularlytheirdiscussionoftheimportanceofshared
motivation.
51CourseyD.,NorrisD.F.(2008),ModelsofE-Government:Are
TheyCorrect?AnEmpiricalAssessment.
PublicAdministrationReview,68(3),p.533;Vanolo,A.(2013).
Smartmentality:Thesmartcityasdisciplinary
strategy.UrbanStudies,51(5),p.892.
52McLean,A.,Bulkeley,H.,&Crang,M.(2015).Negotiatingthe
urbansmartgrid:Socio-technical
experimentationinthecityofAustin.UrbanStudies(1)18,p.8.
53Ibid.,p.529;Angelidou,M.,op.cit.,p.104[seenote1]
54McLeanetal.,op.cit.,p.2[seenote102].
55Vanolo.,op.cit.,p.891[seenote101].
56U.S.DepartmentofCommerce,NationalInstituteofStandards
andTechnology.(2016).IoT-enabledsmart
cityframework[Whitepaper].Retrievedfrom
https://s3.amazonaws.com/nist-sgcps/smartcityframework/files/
IoT-EnabledSmartCityFrameworkWP.pdf
57Ibid.,p.3.
58SmartCitiesCouncil,SmartCitiesReadinessGuide(Redmond,
WA:SmartCitiesCouncil,2015).
59Neirotti,etal.,op.cit.,p.29[seenote5].
60Ibid.,p.34;Luque-Ayala,A.,&Marvin,S.(2015).Develop
criticalunderstandingofsmarturbanism?Urban
Studies(52)12,p.2110.](https://image.slidesharecdn.com/annexes-170917112034/85/Annexes-77-320.jpg)


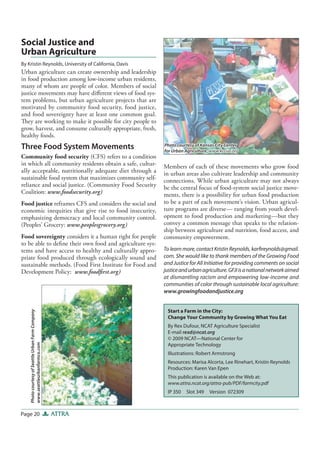


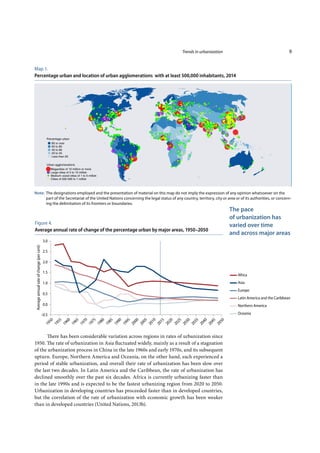
The 2014 revision of World Urbanization Prospects by the United Nations indicates that 54% of the global population lives in urban areas, a figure expected to rise to 66% by 2050, particularly driven by rapid urbanization in Asia and Africa. Key countries, including India, China, and Nigeria, will account for a significant portion of this growth while many urban areas face challenges due to unplanned expansion and inequality. The report emphasizes the need for integrated policies that address the complexities of urban development and the urgency for sustainable solutions in an increasingly urbanized world.


![A Global Community[1]](https://cdn.slidesharecdn.com/ss_thumbnails/a-global-community1-1209608480062421-9-thumbnail.jpg?width=640&height=640&fit=bounds)