Download to read offline
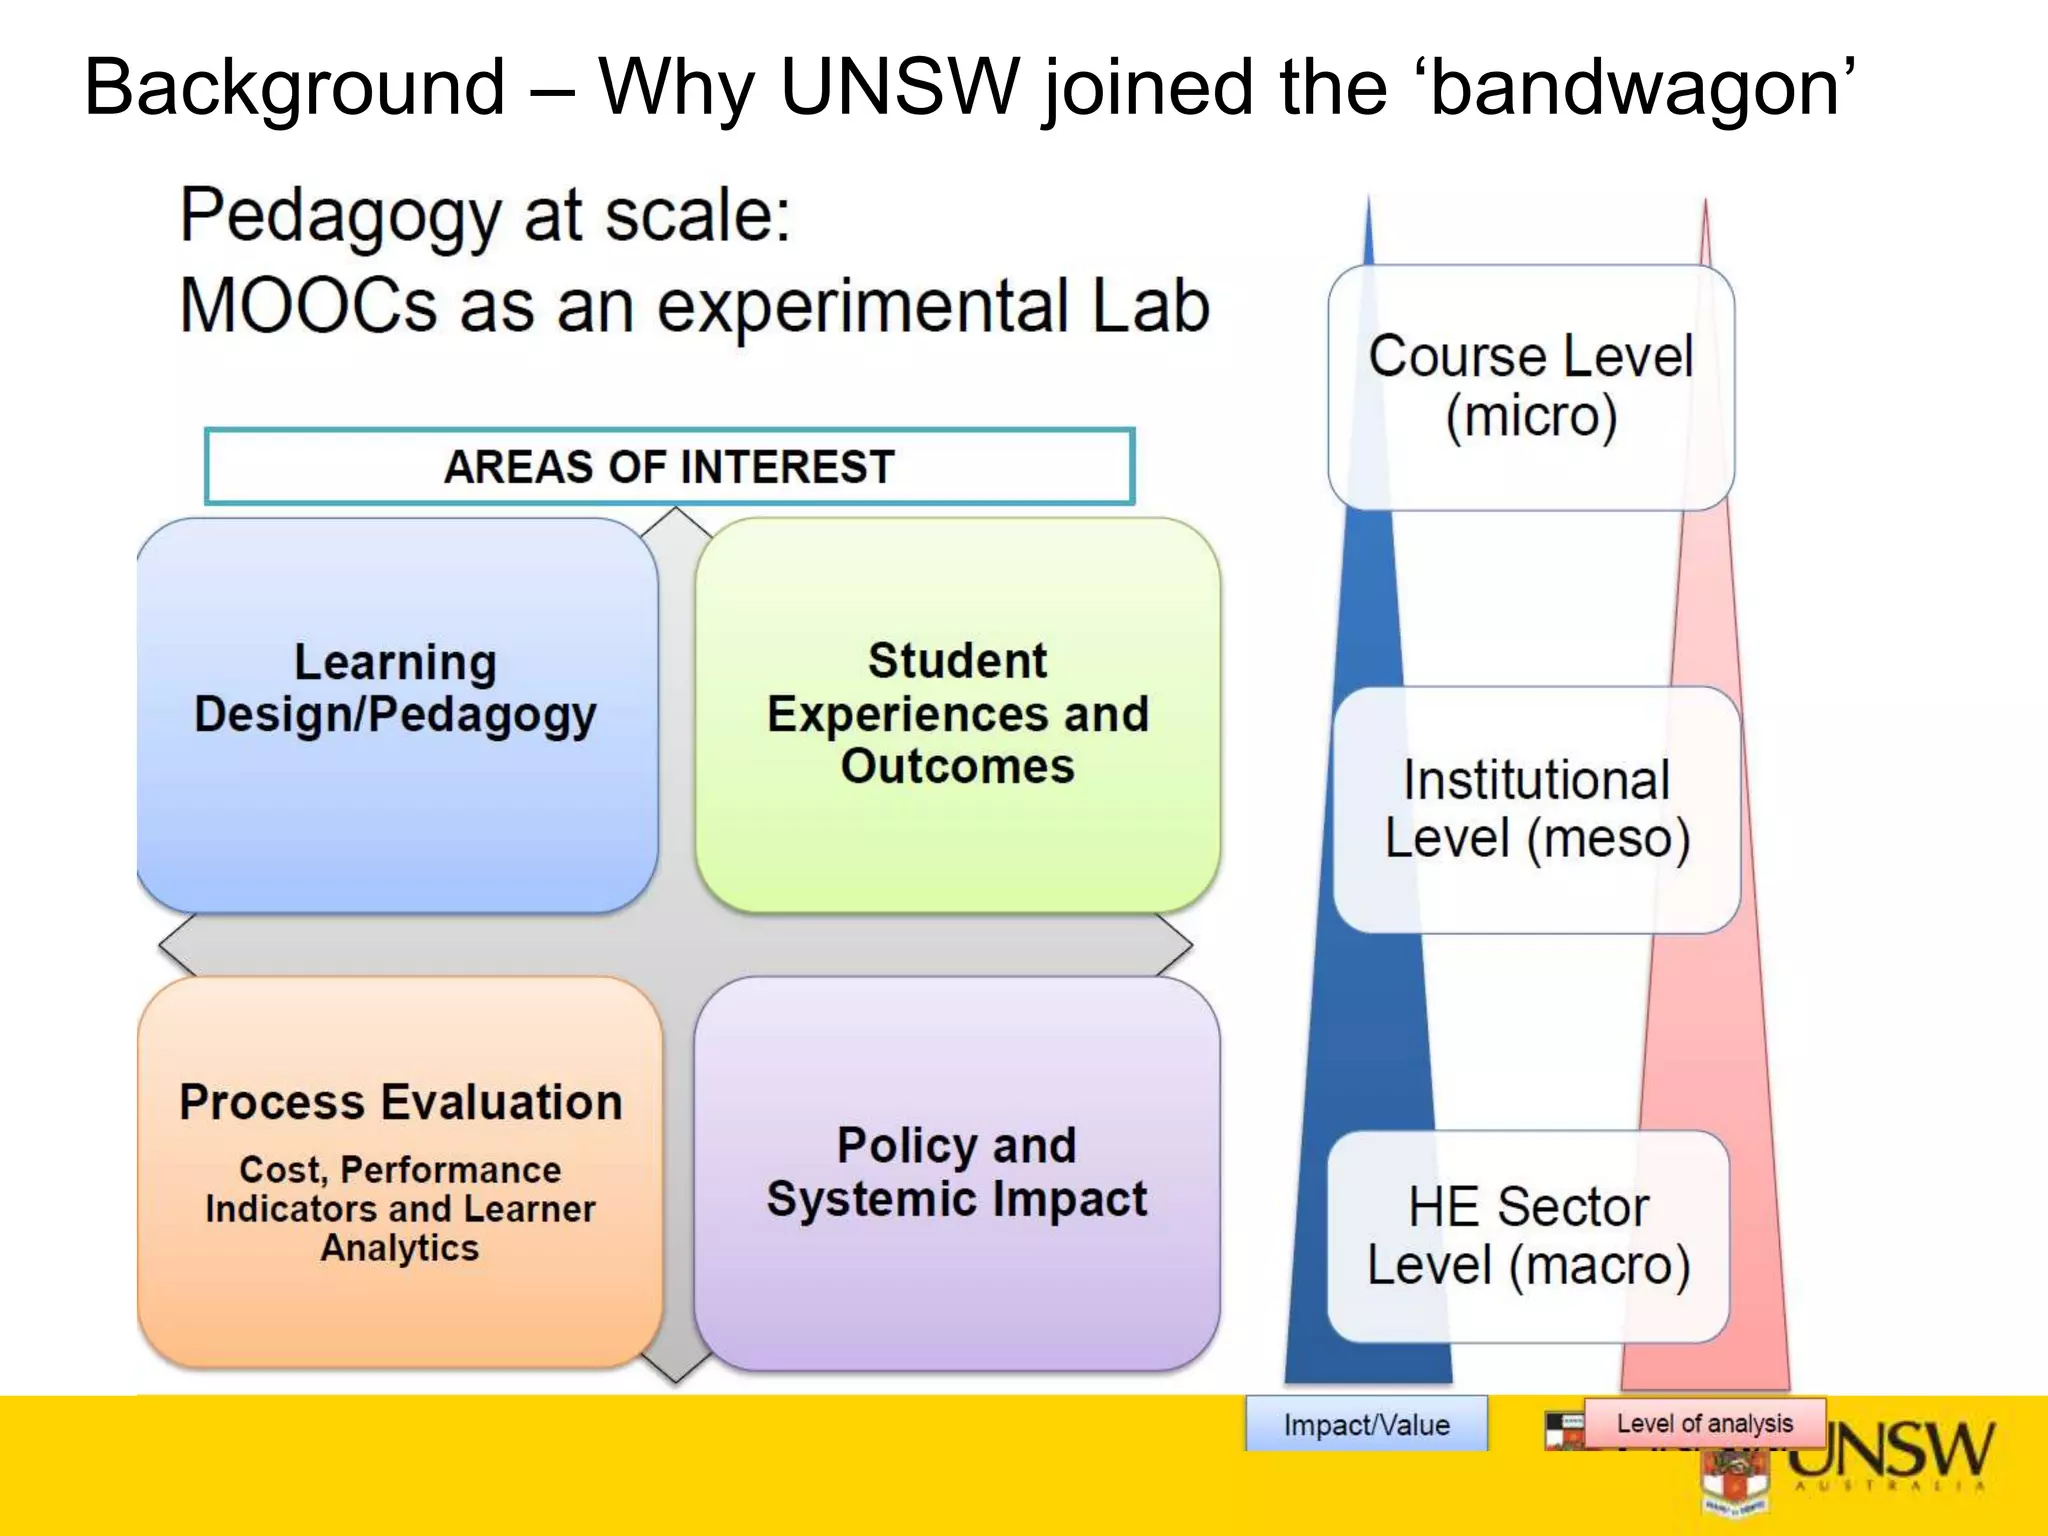
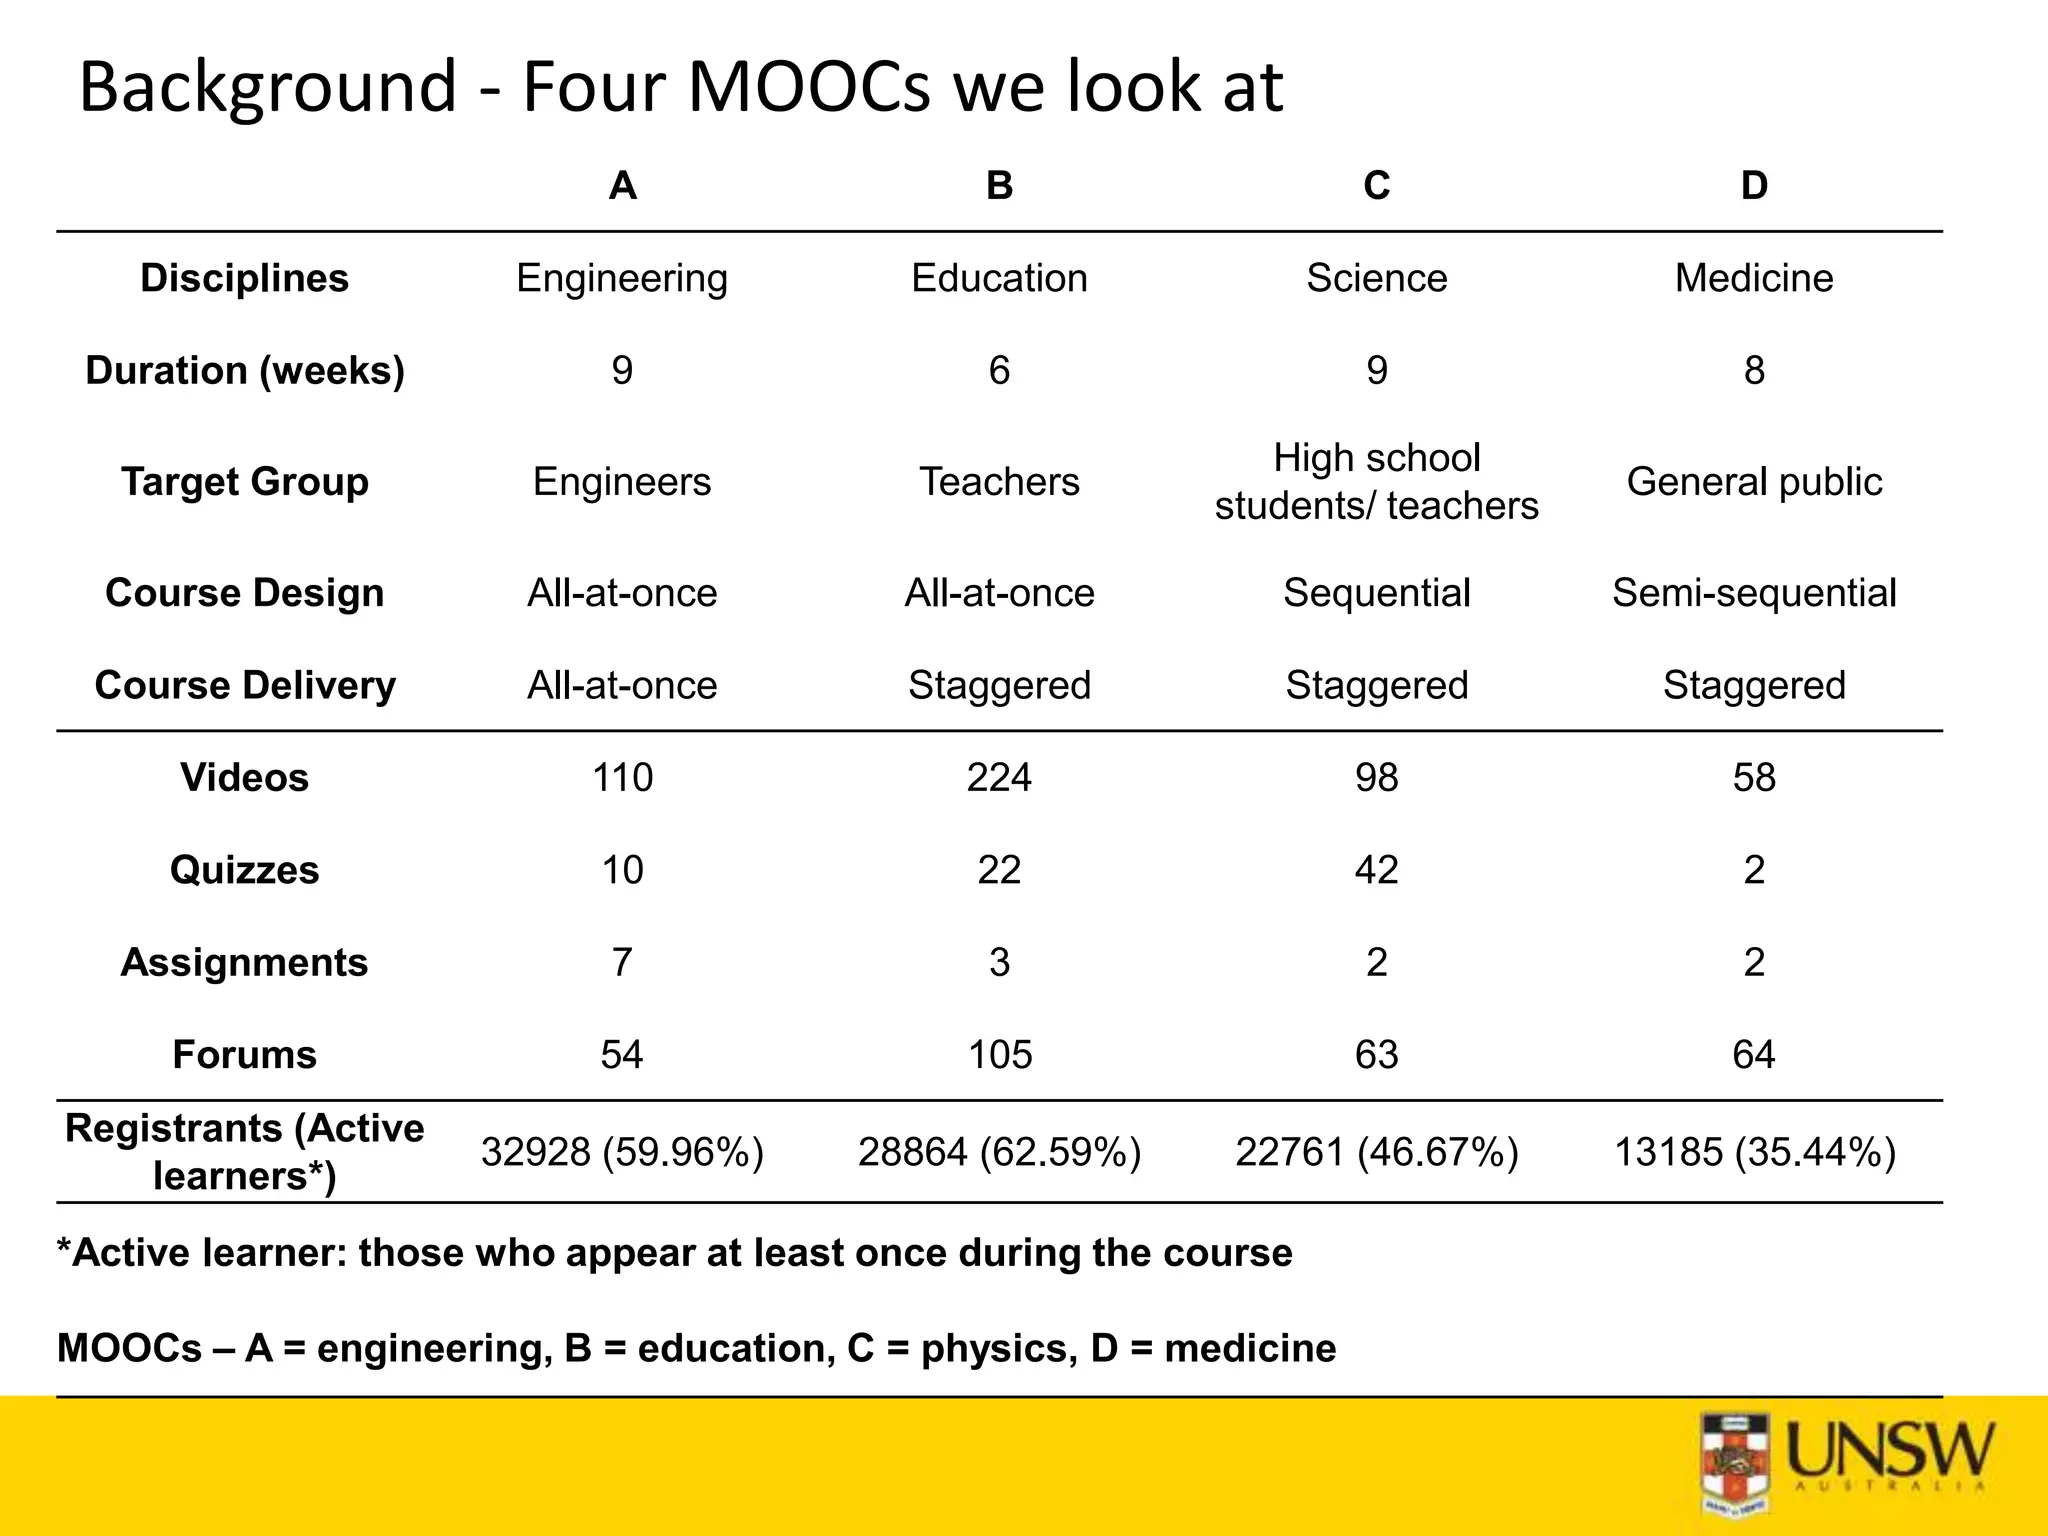
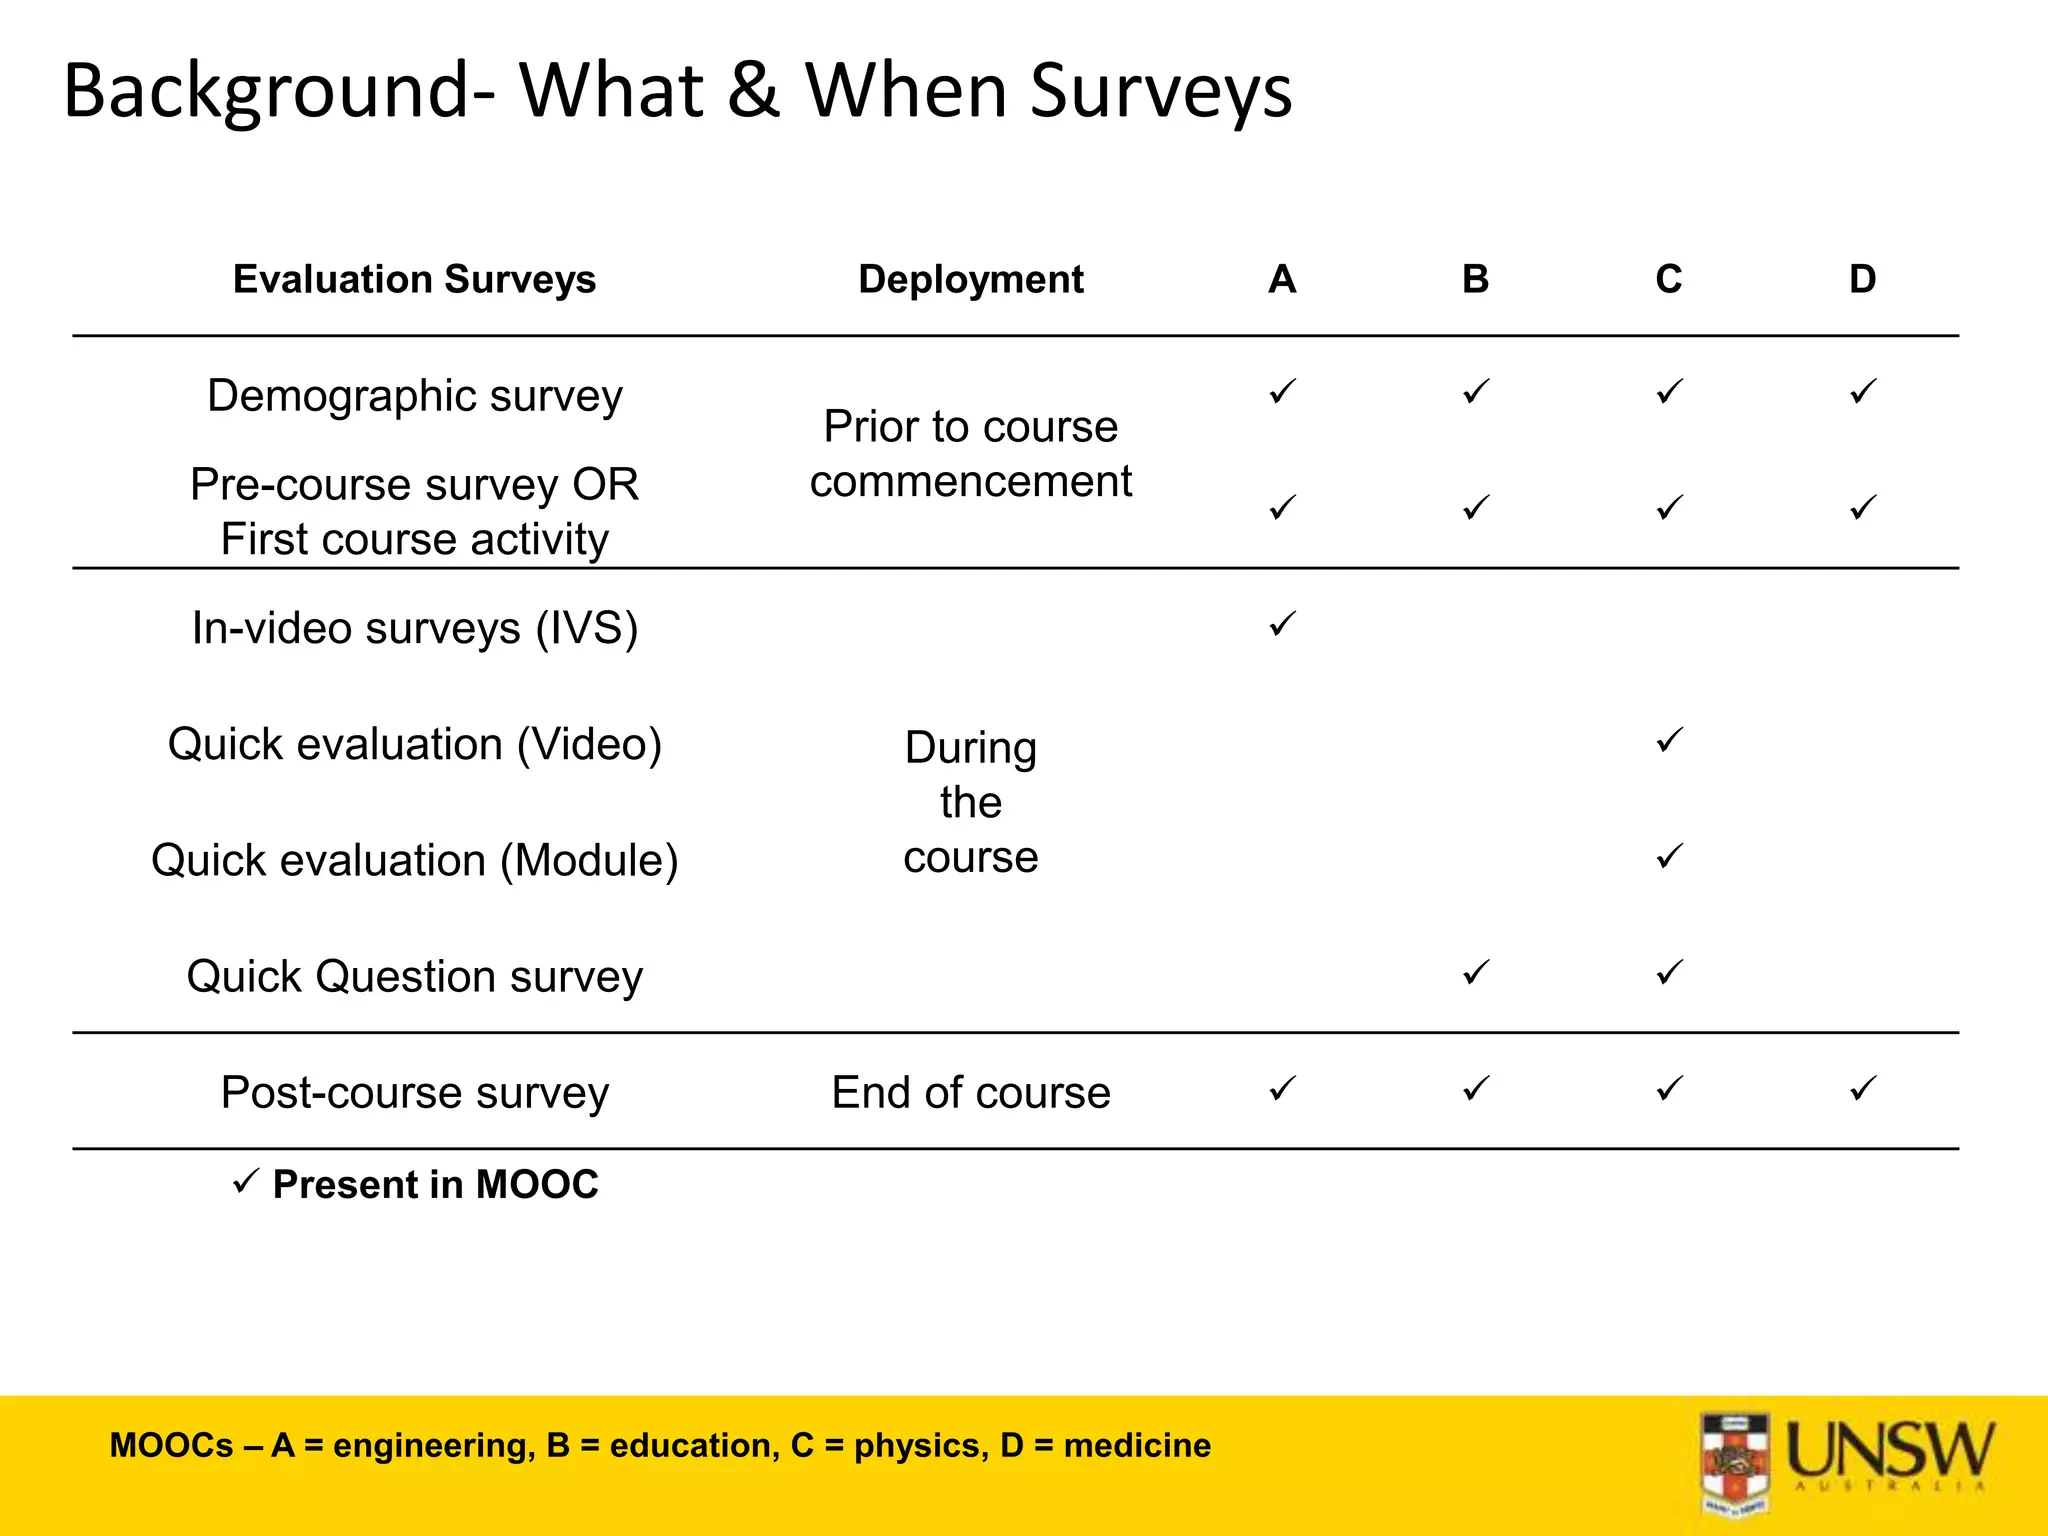
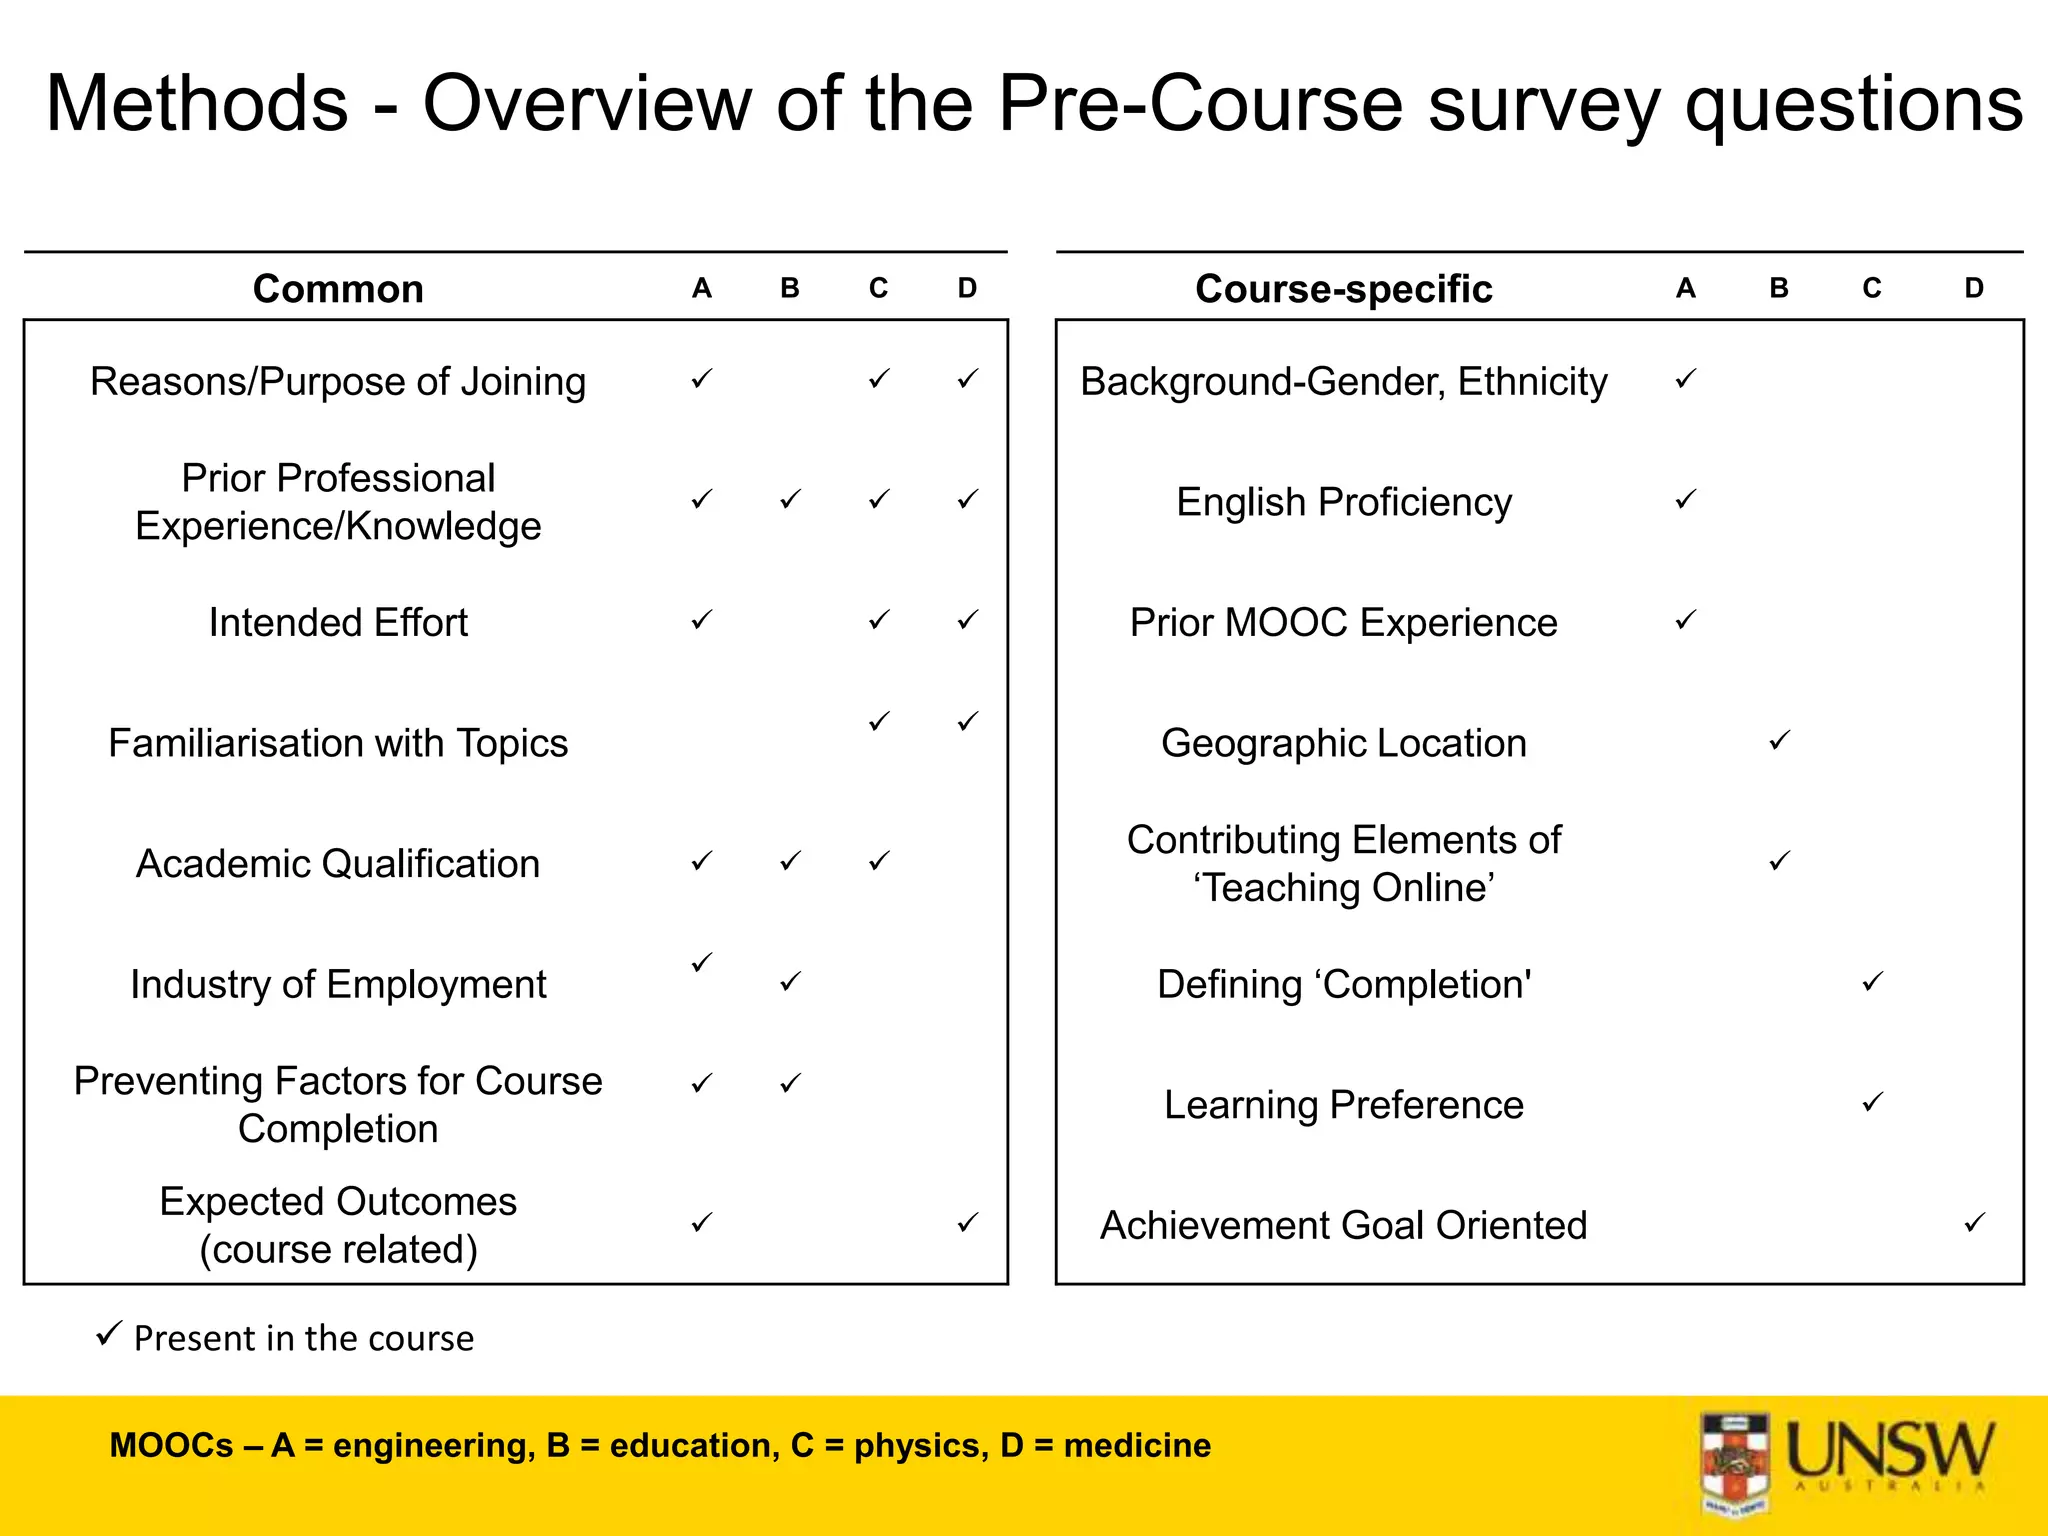

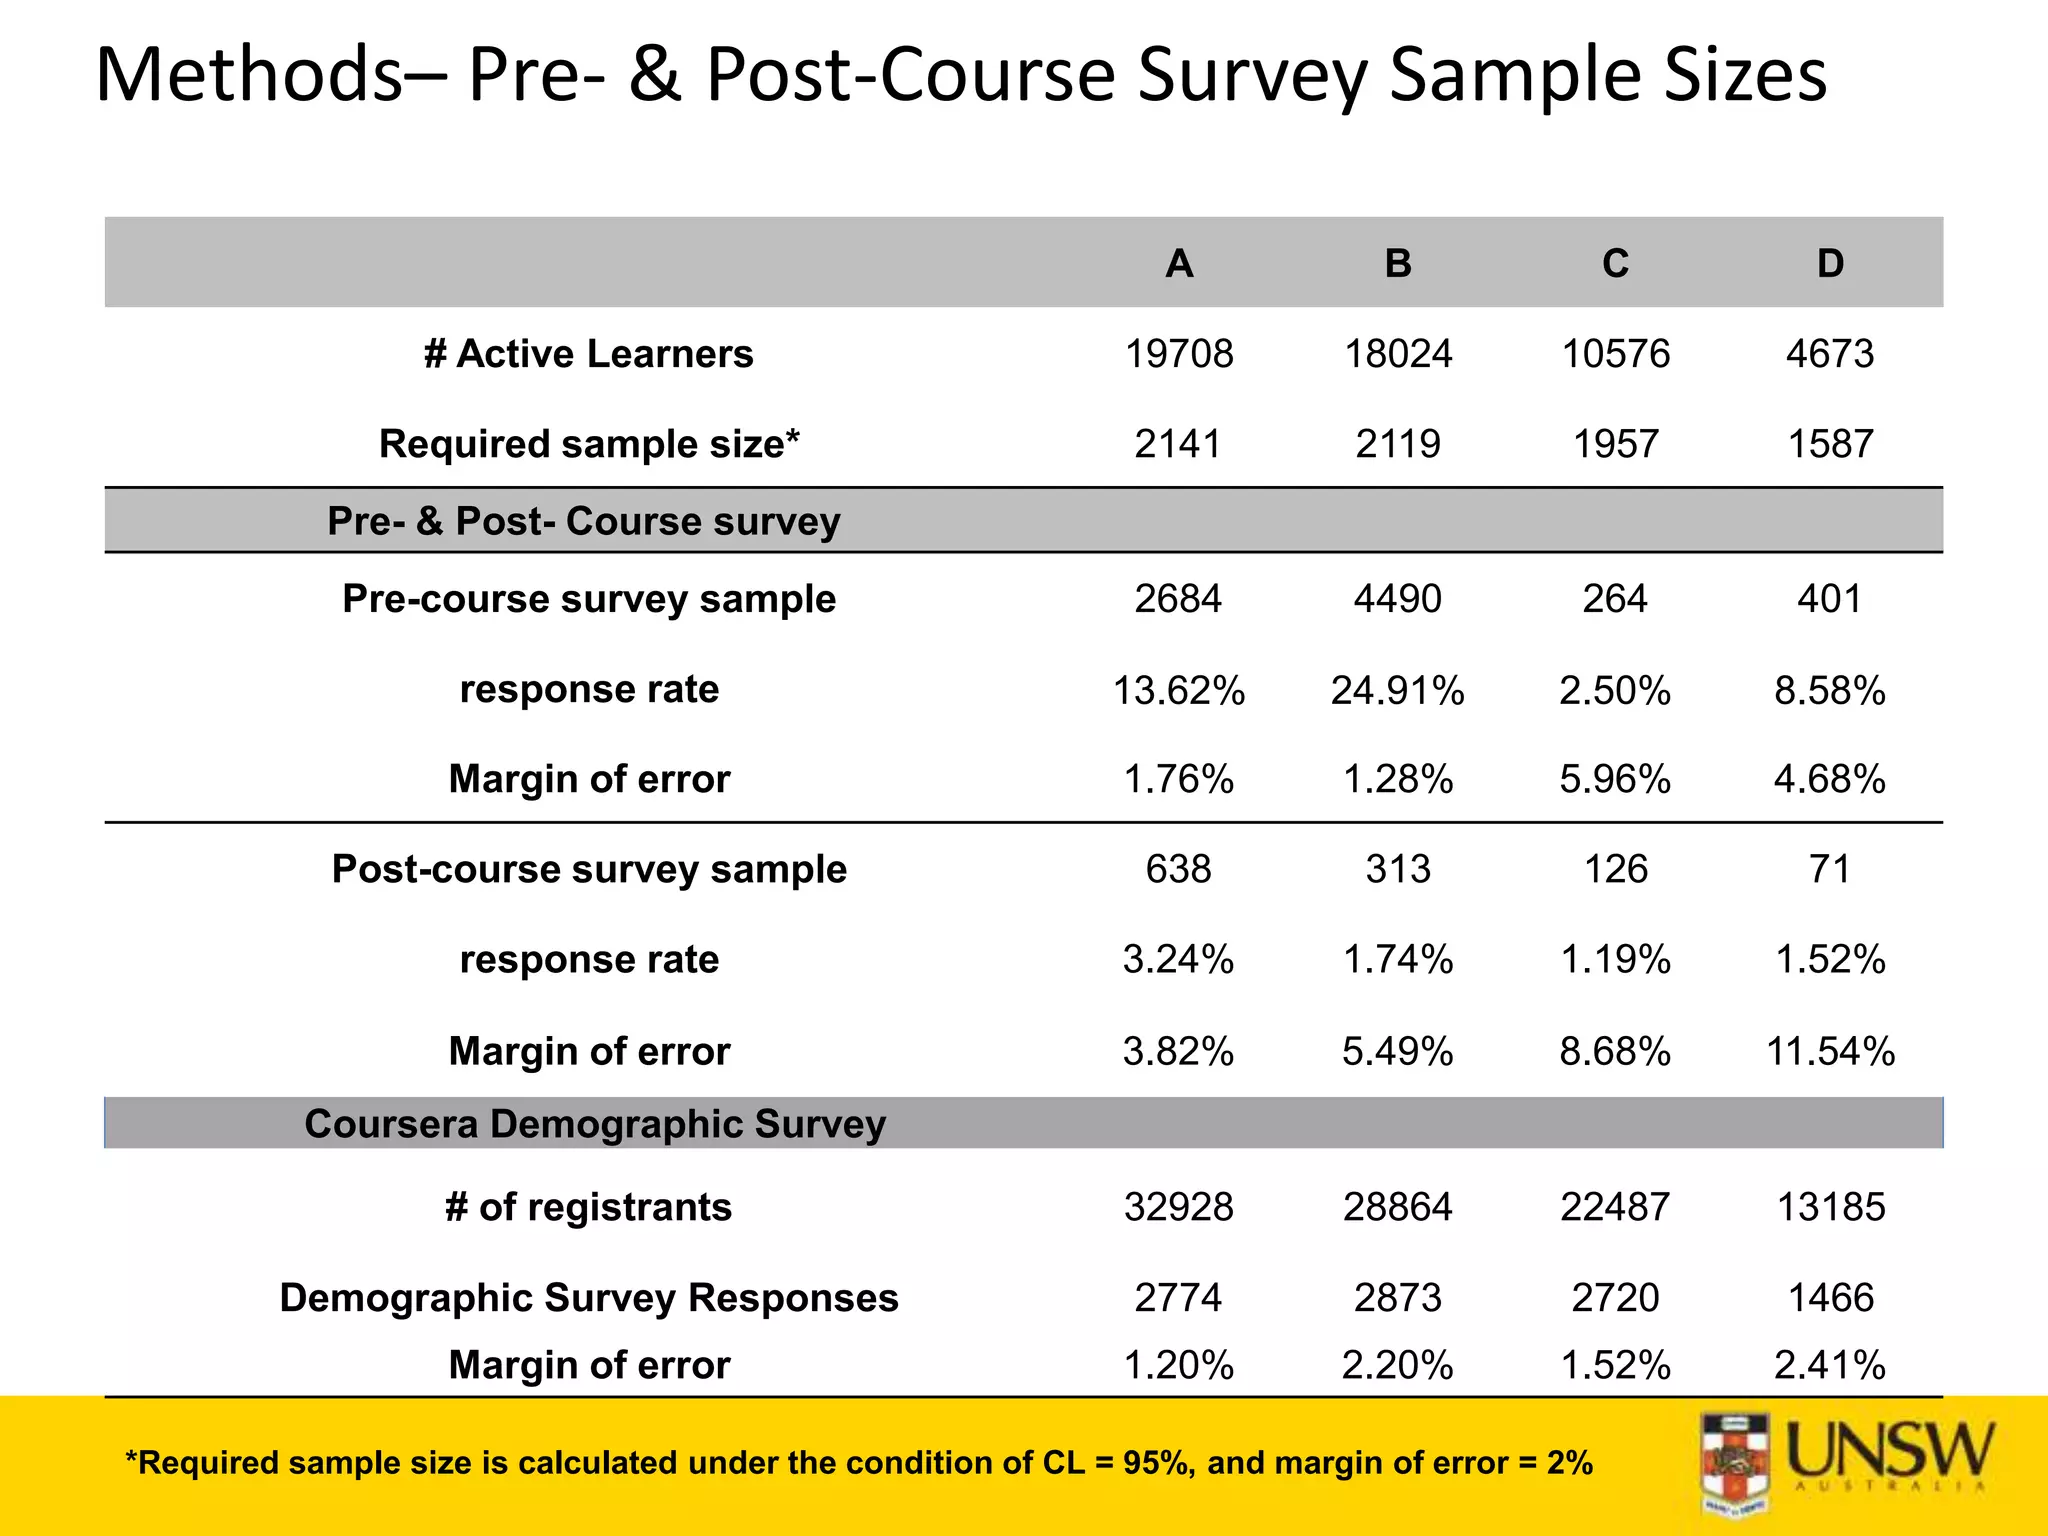
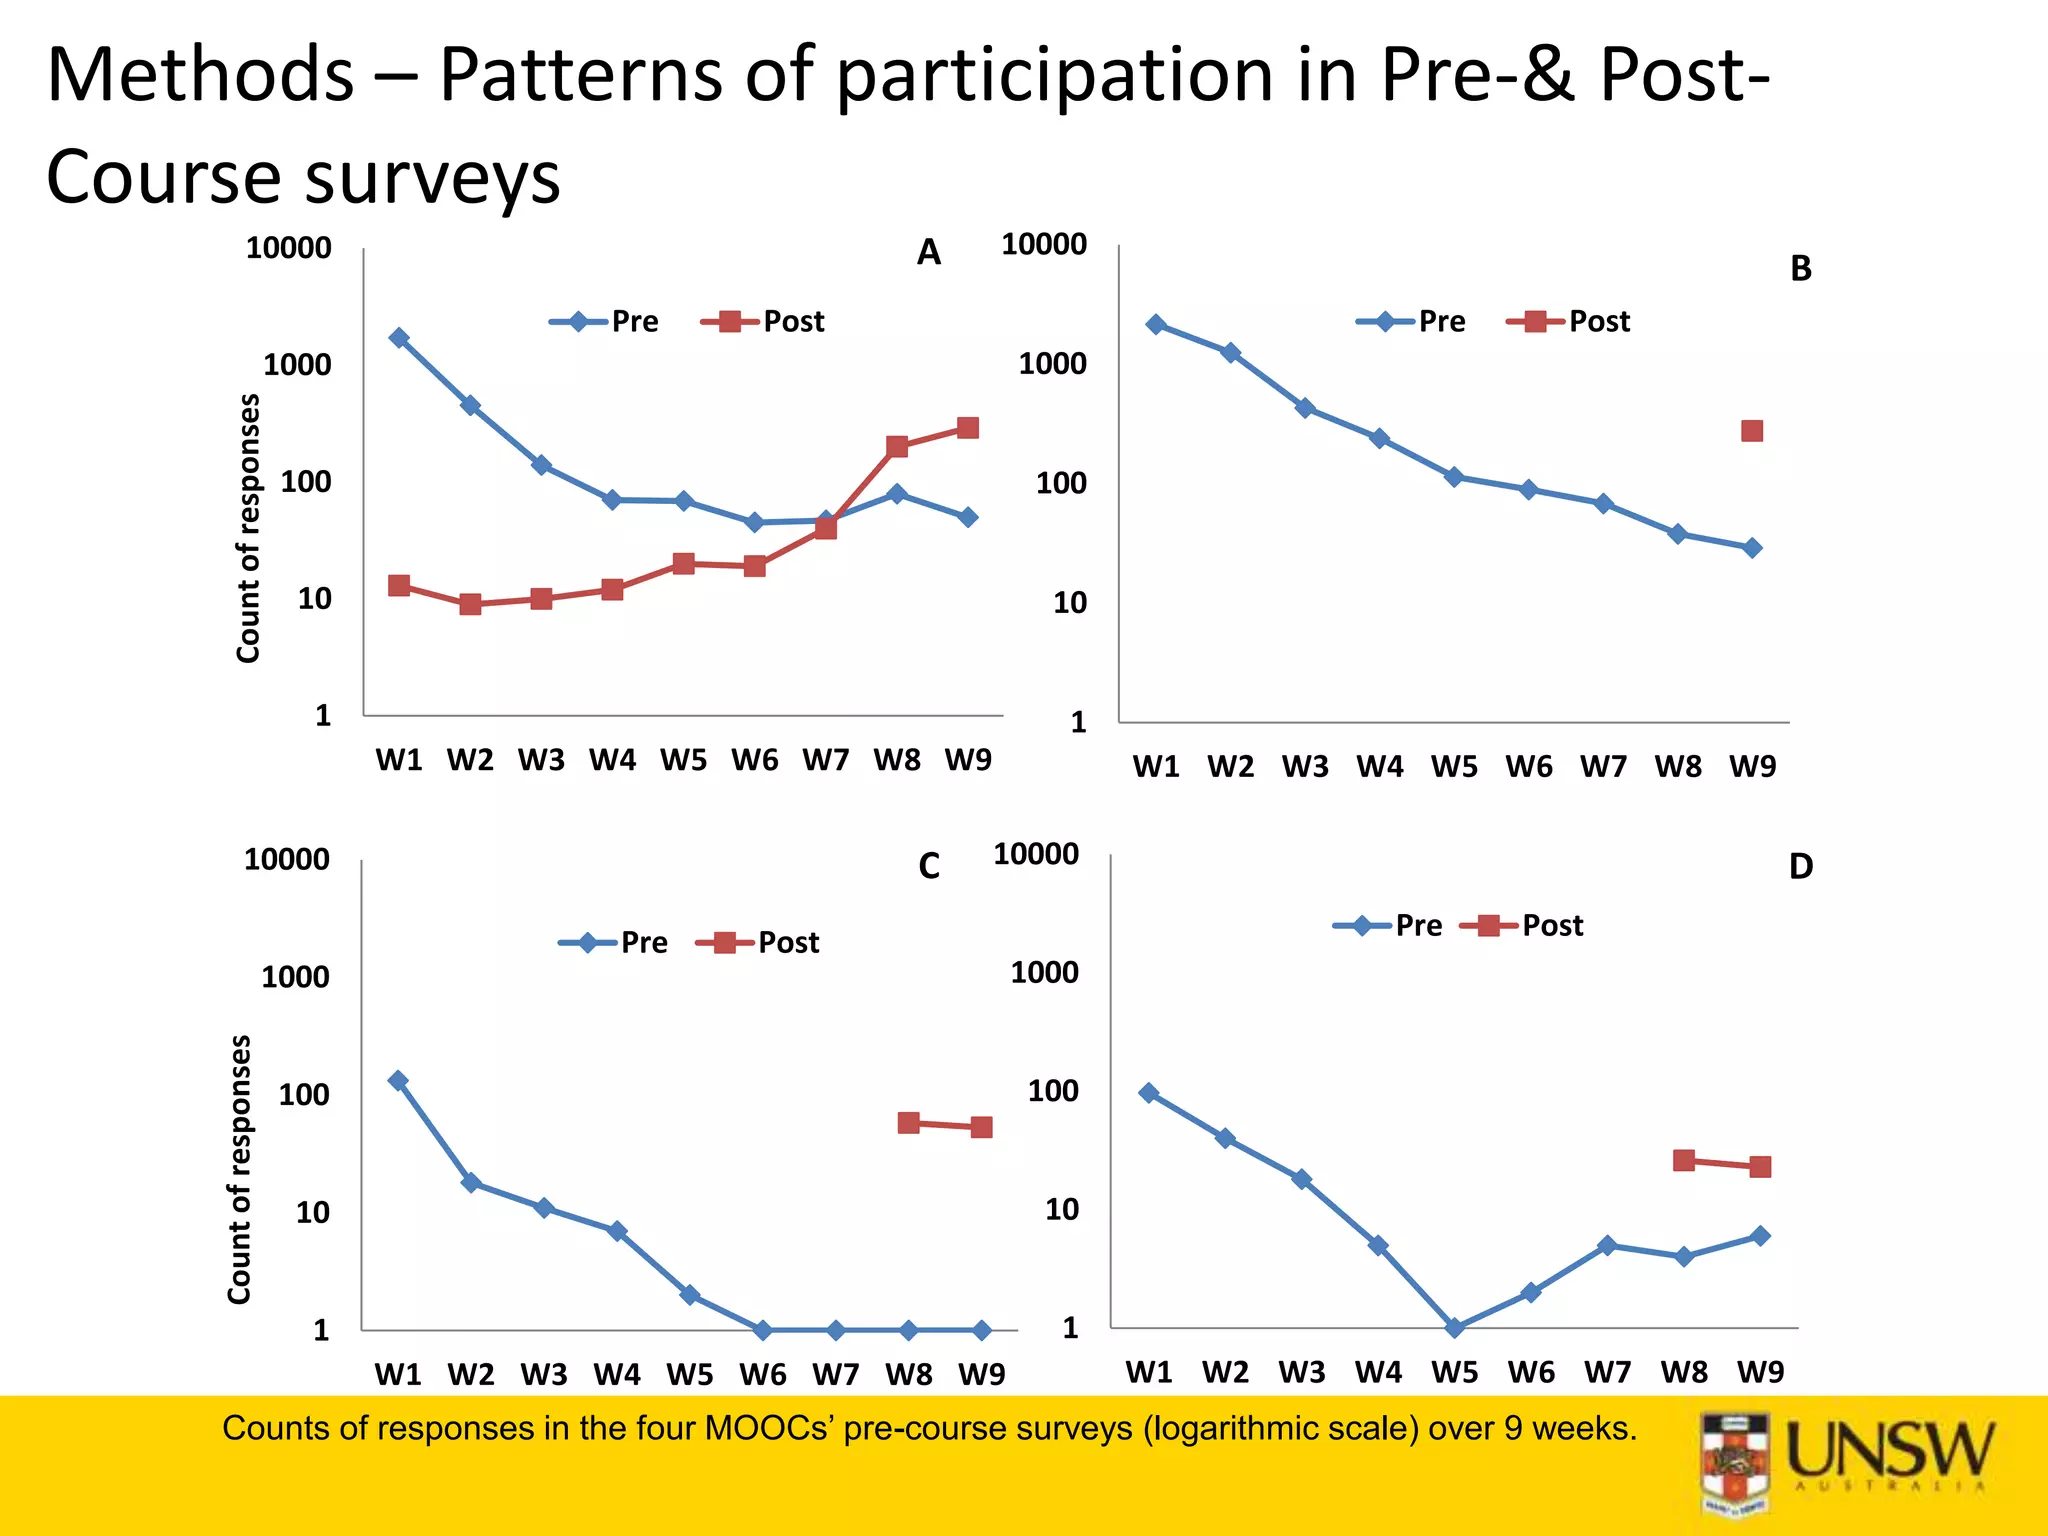
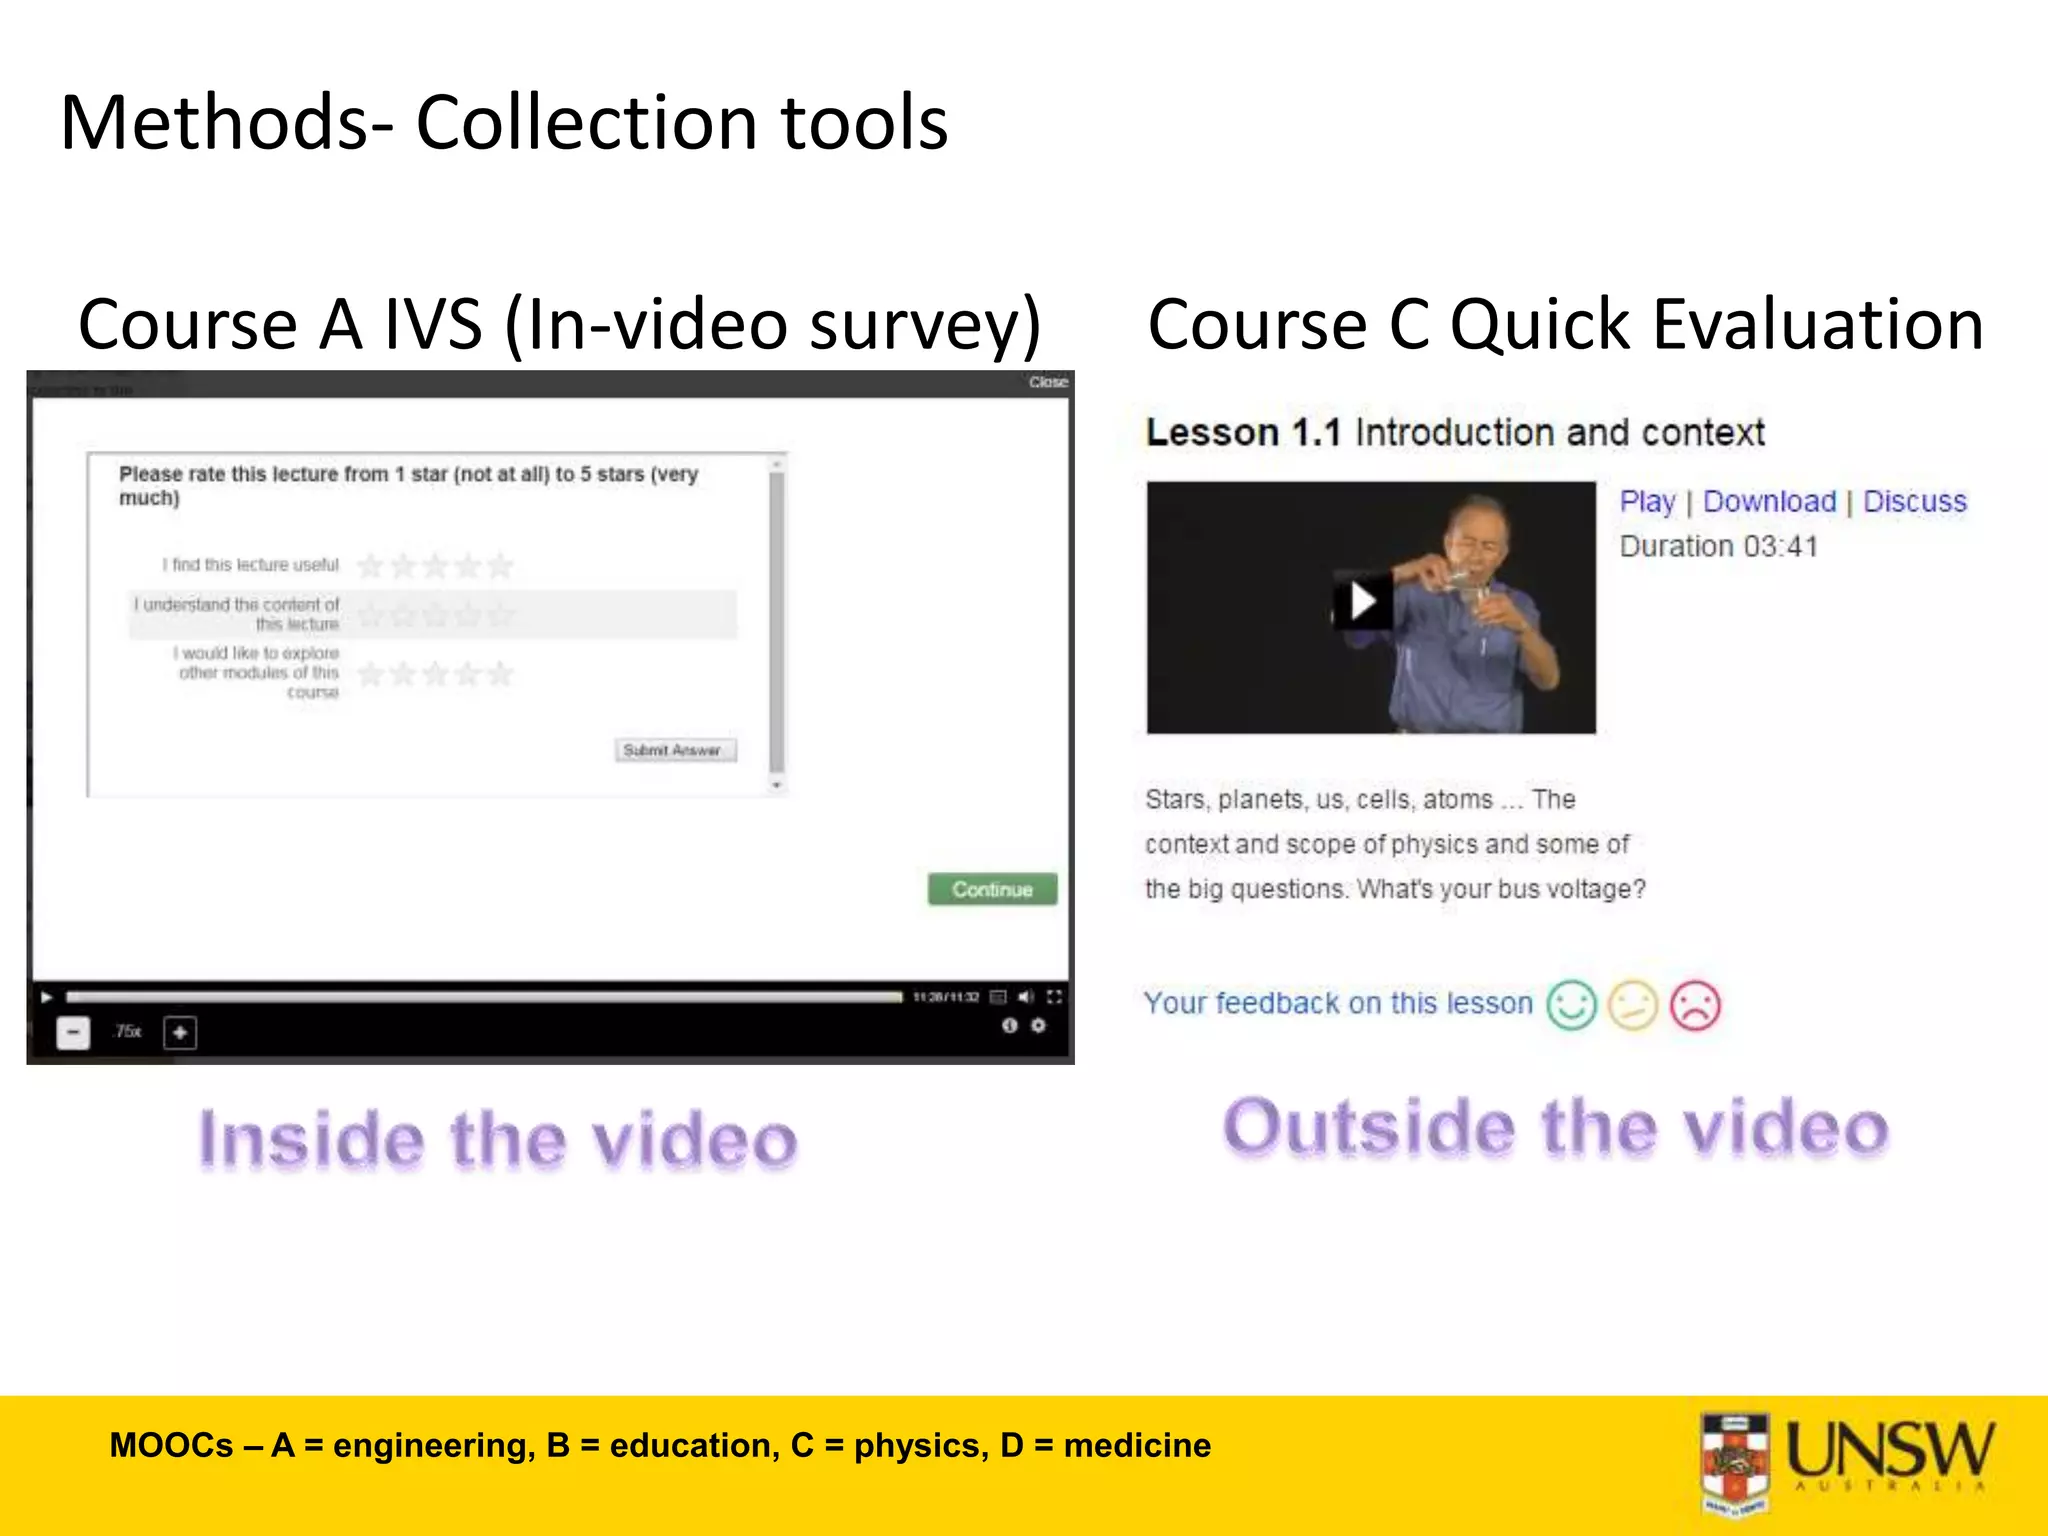
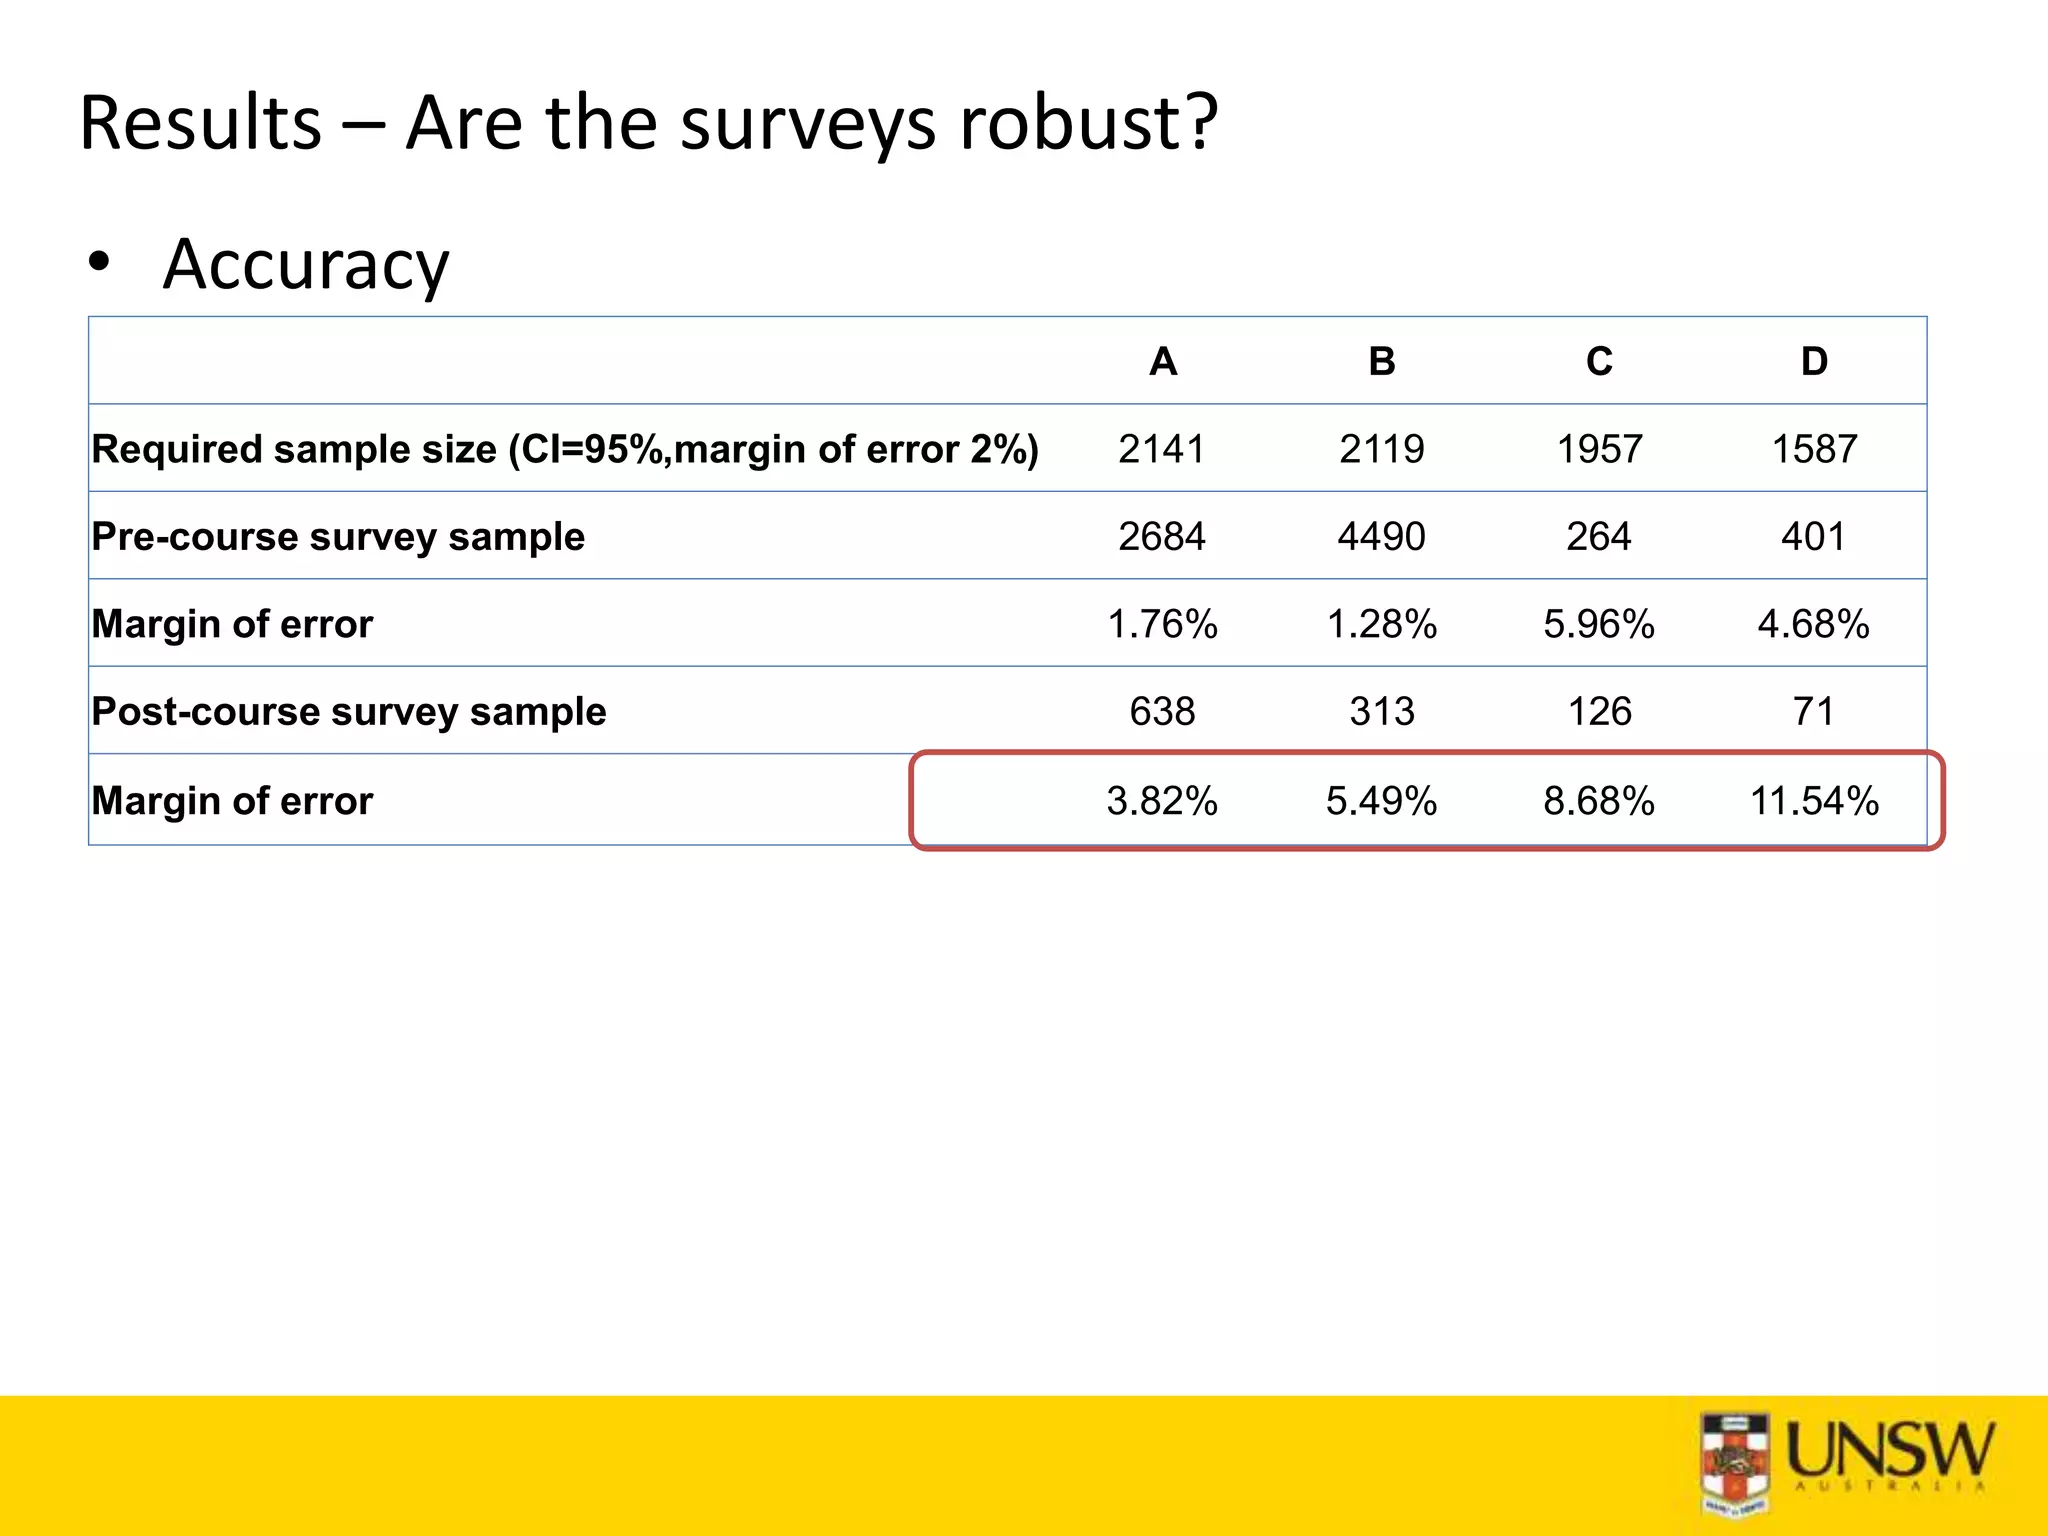
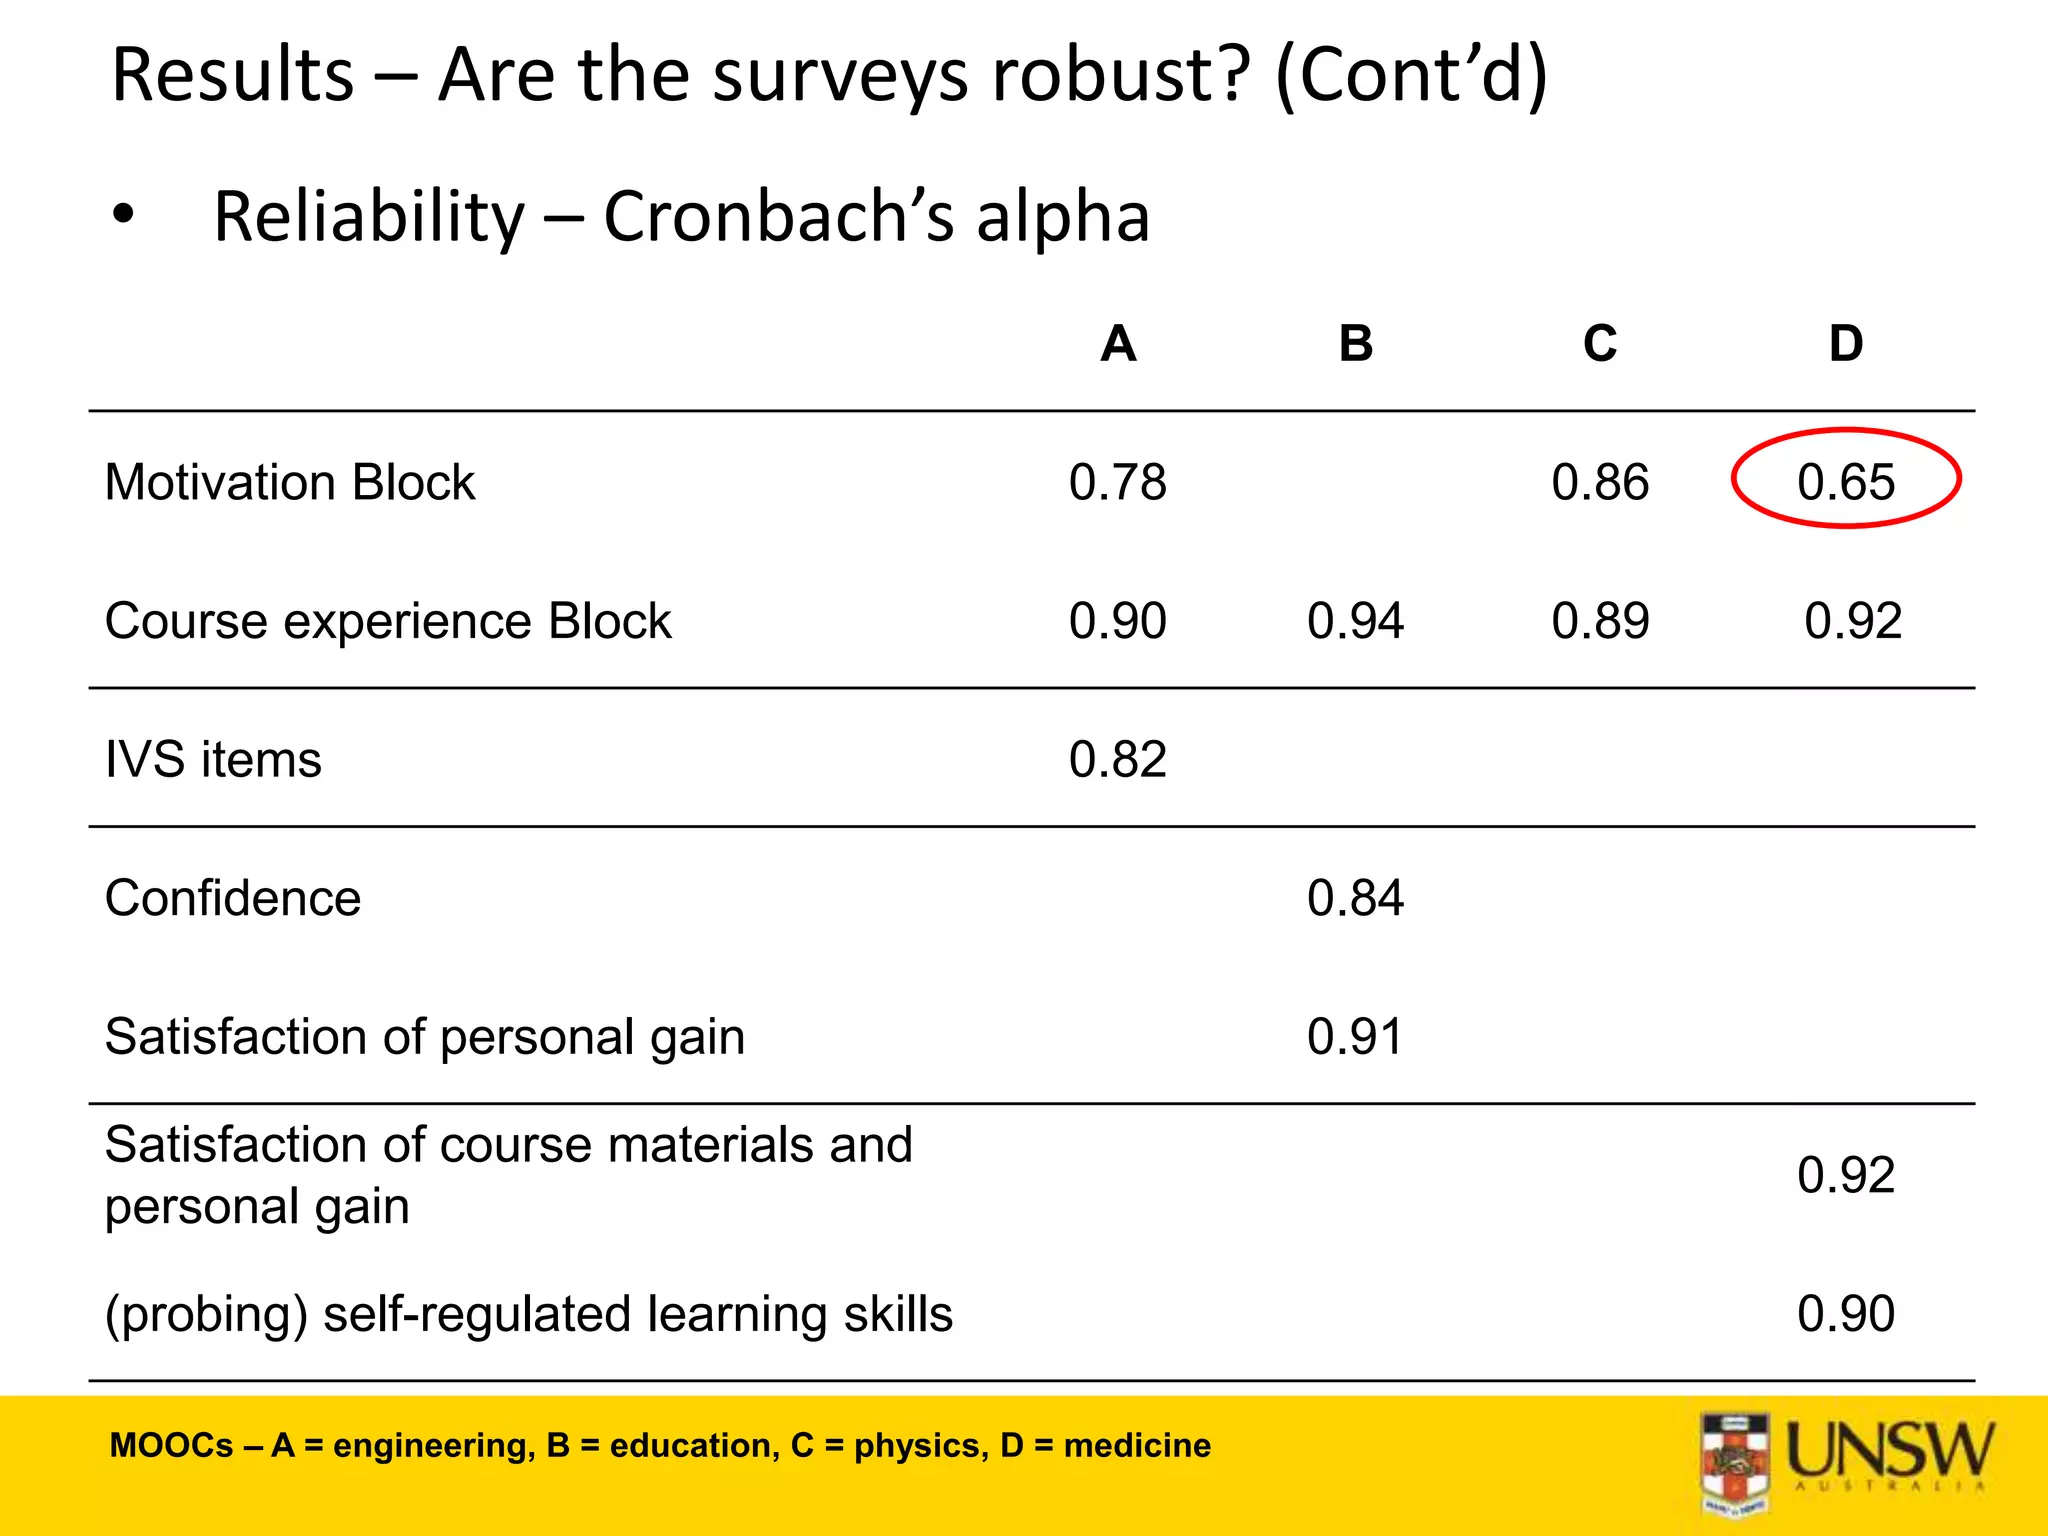
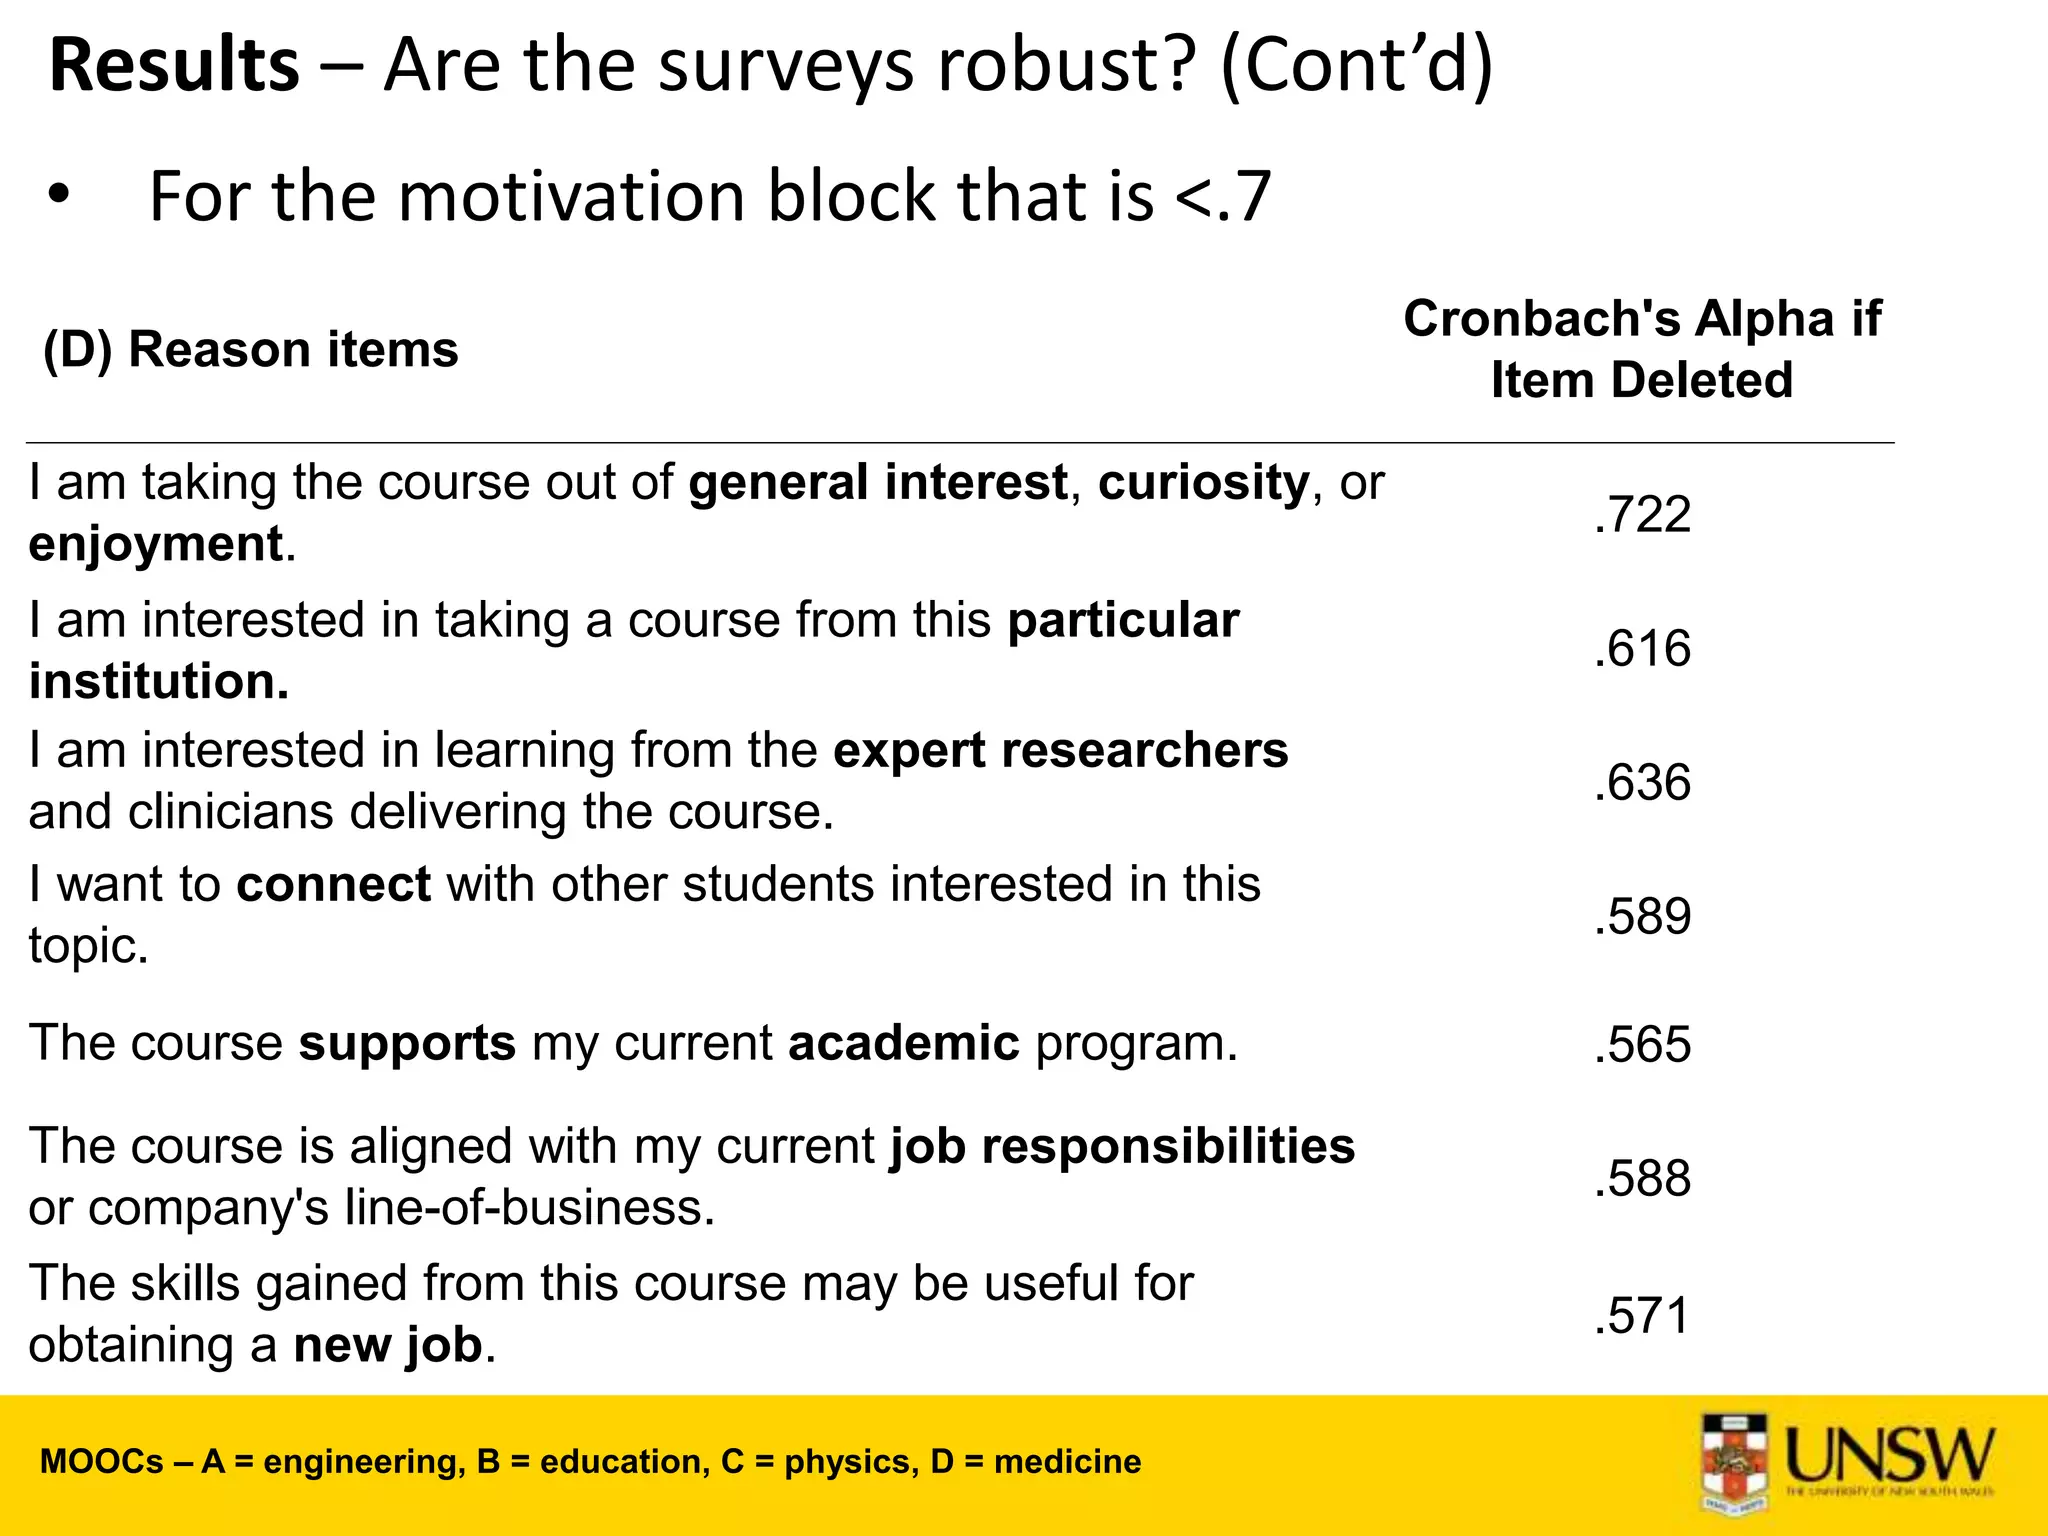
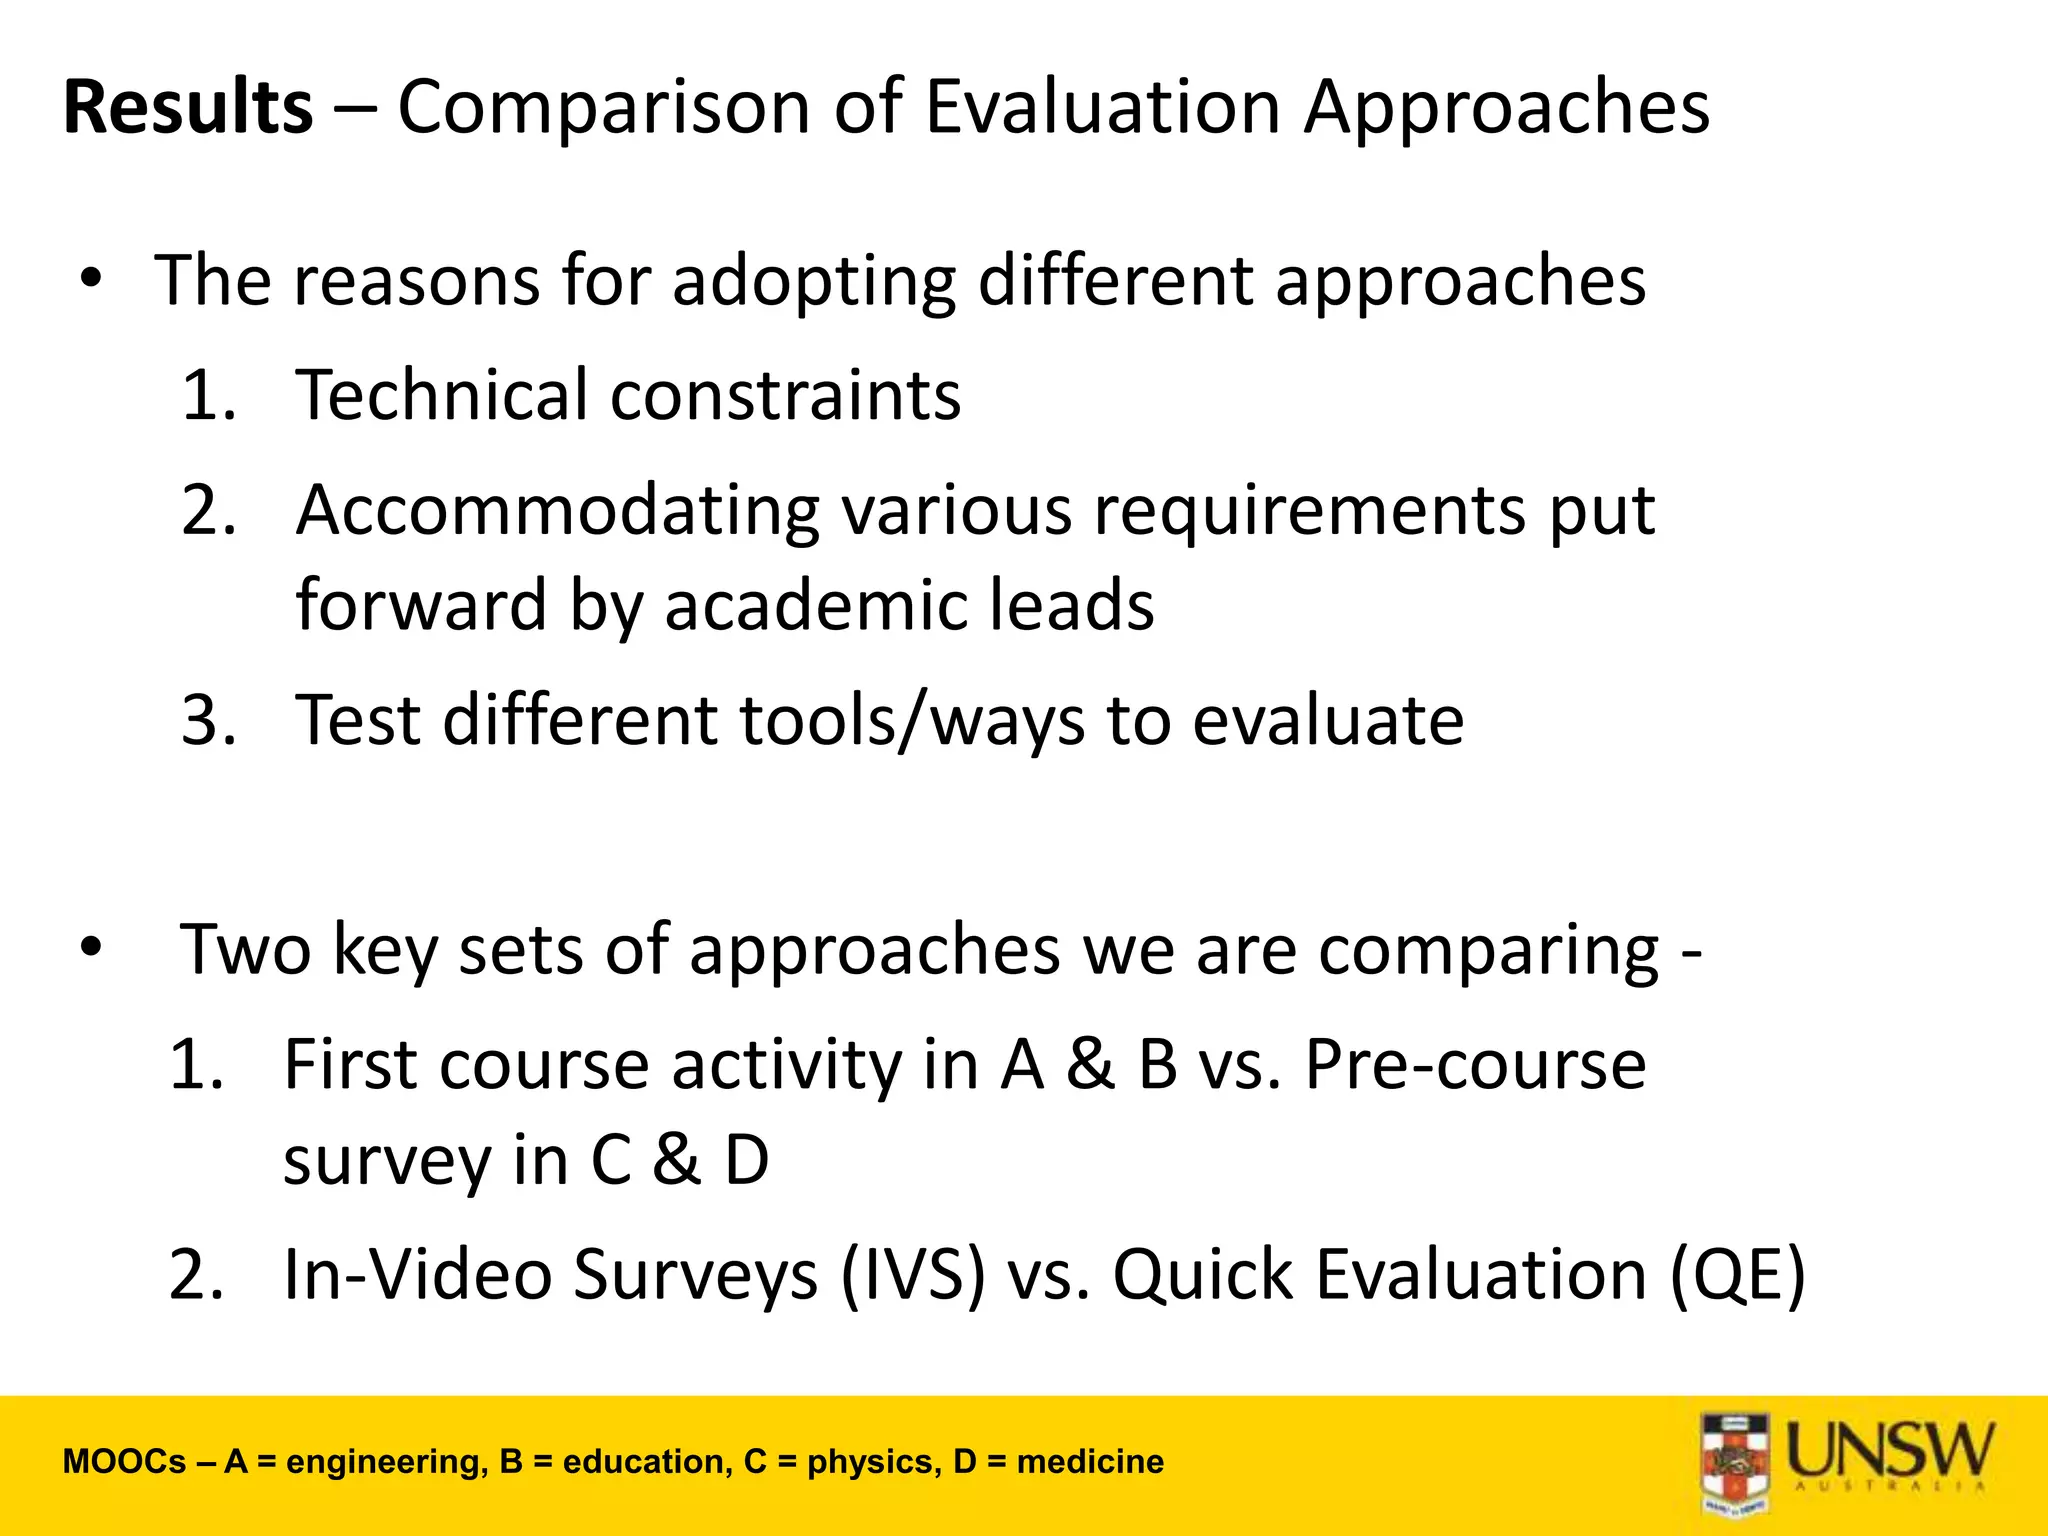
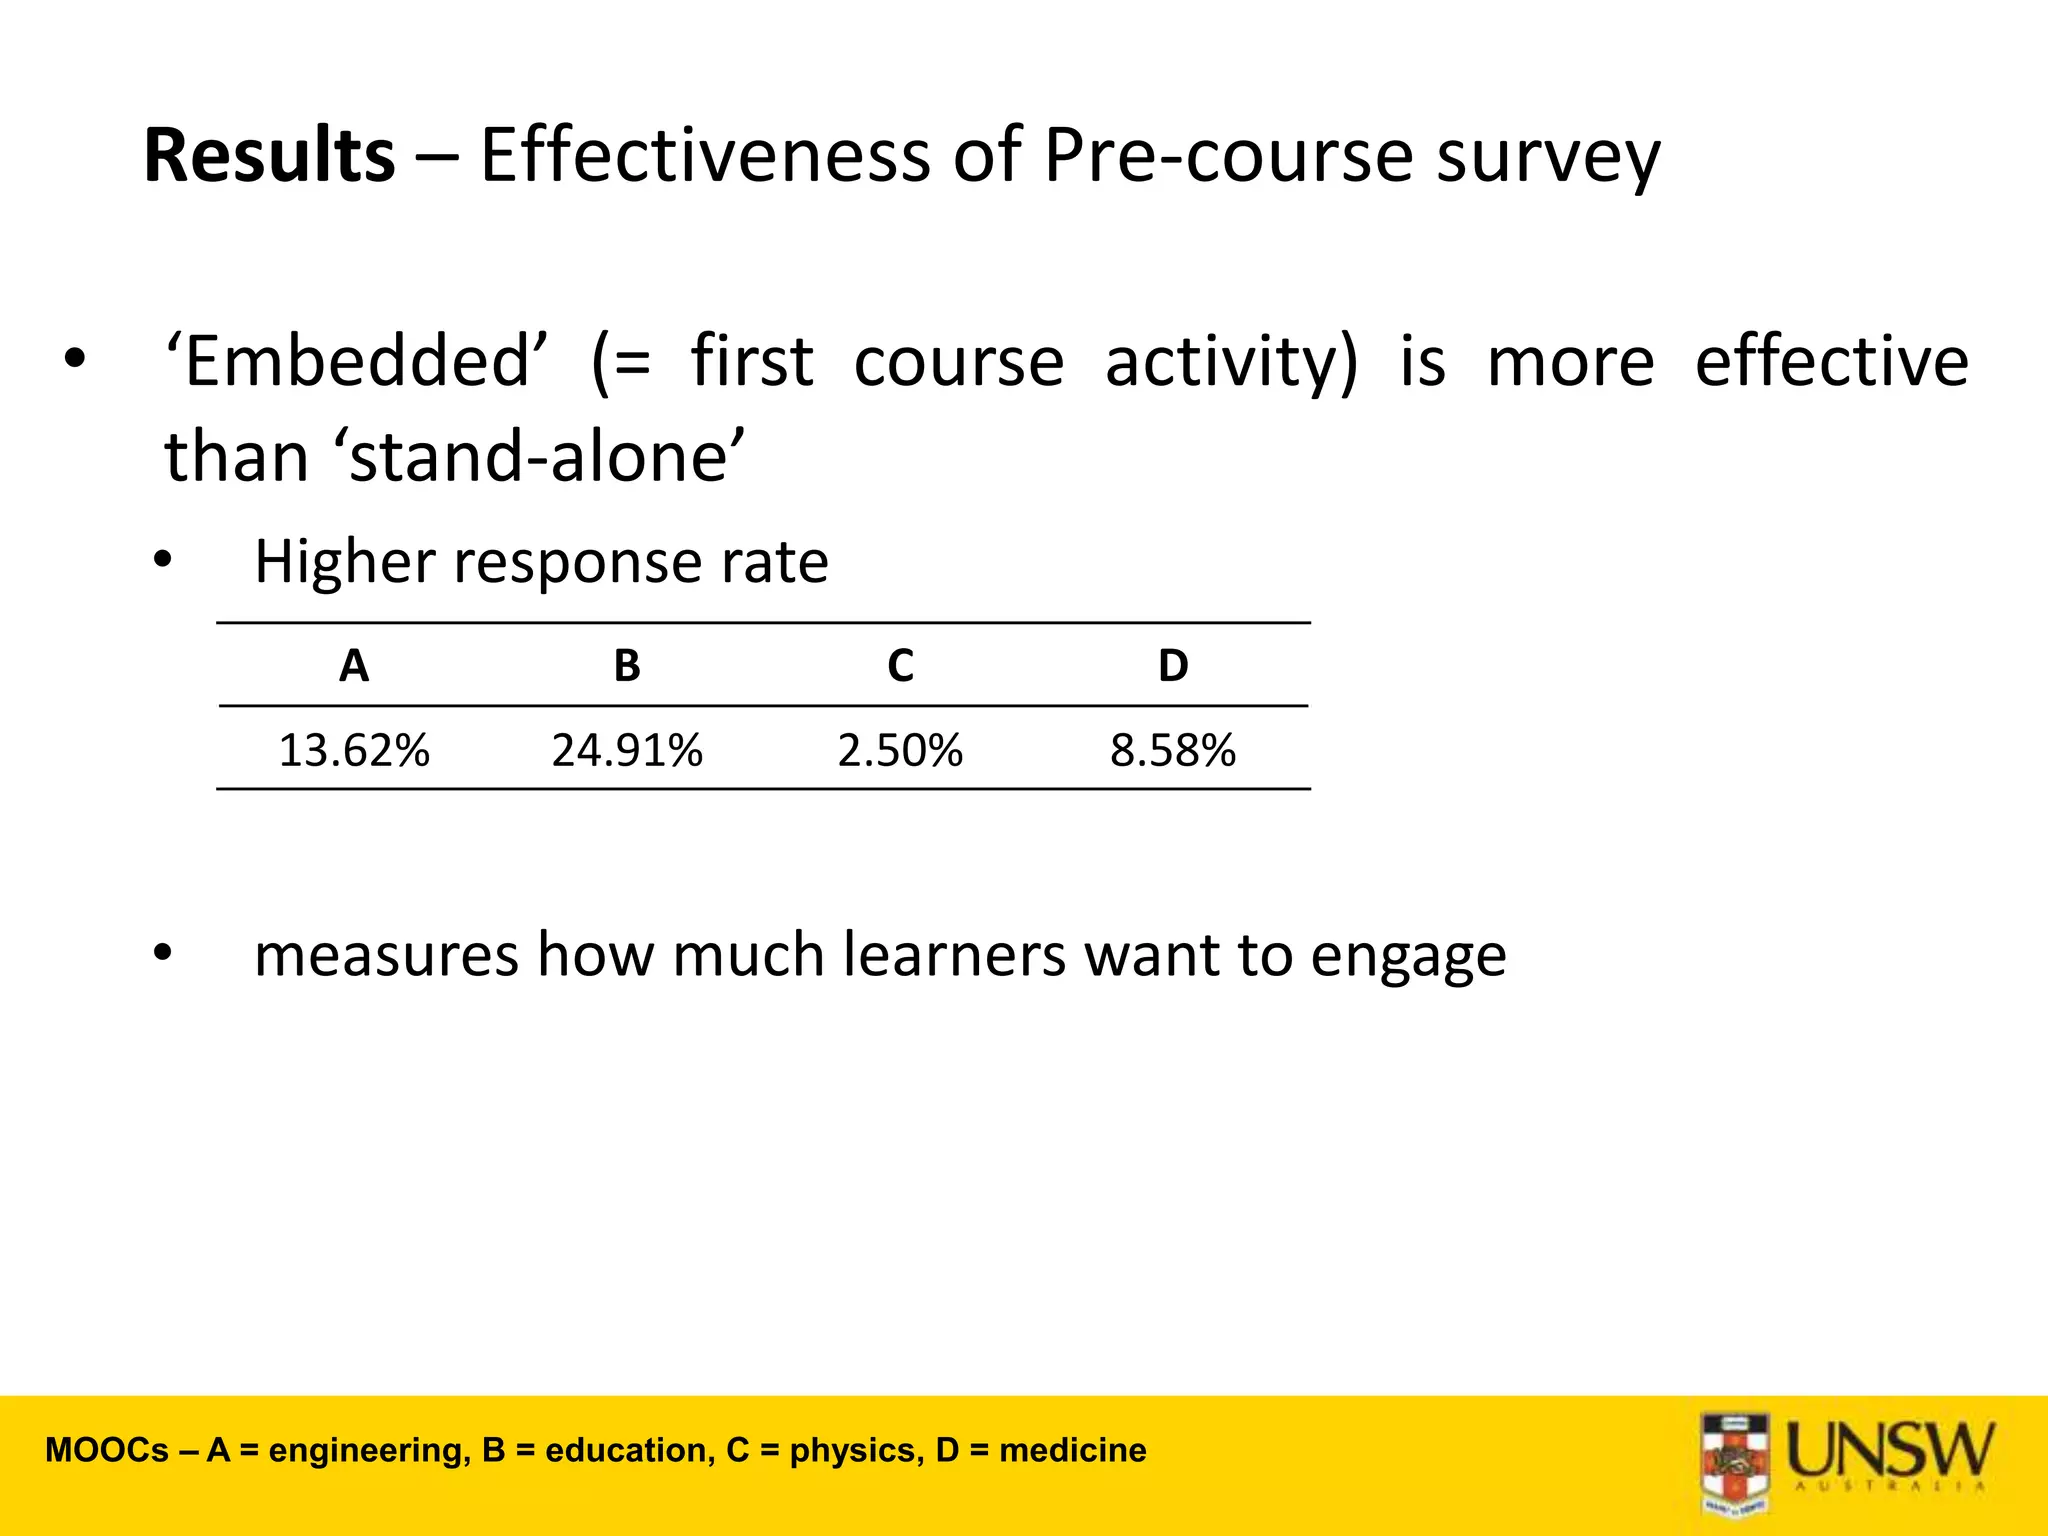
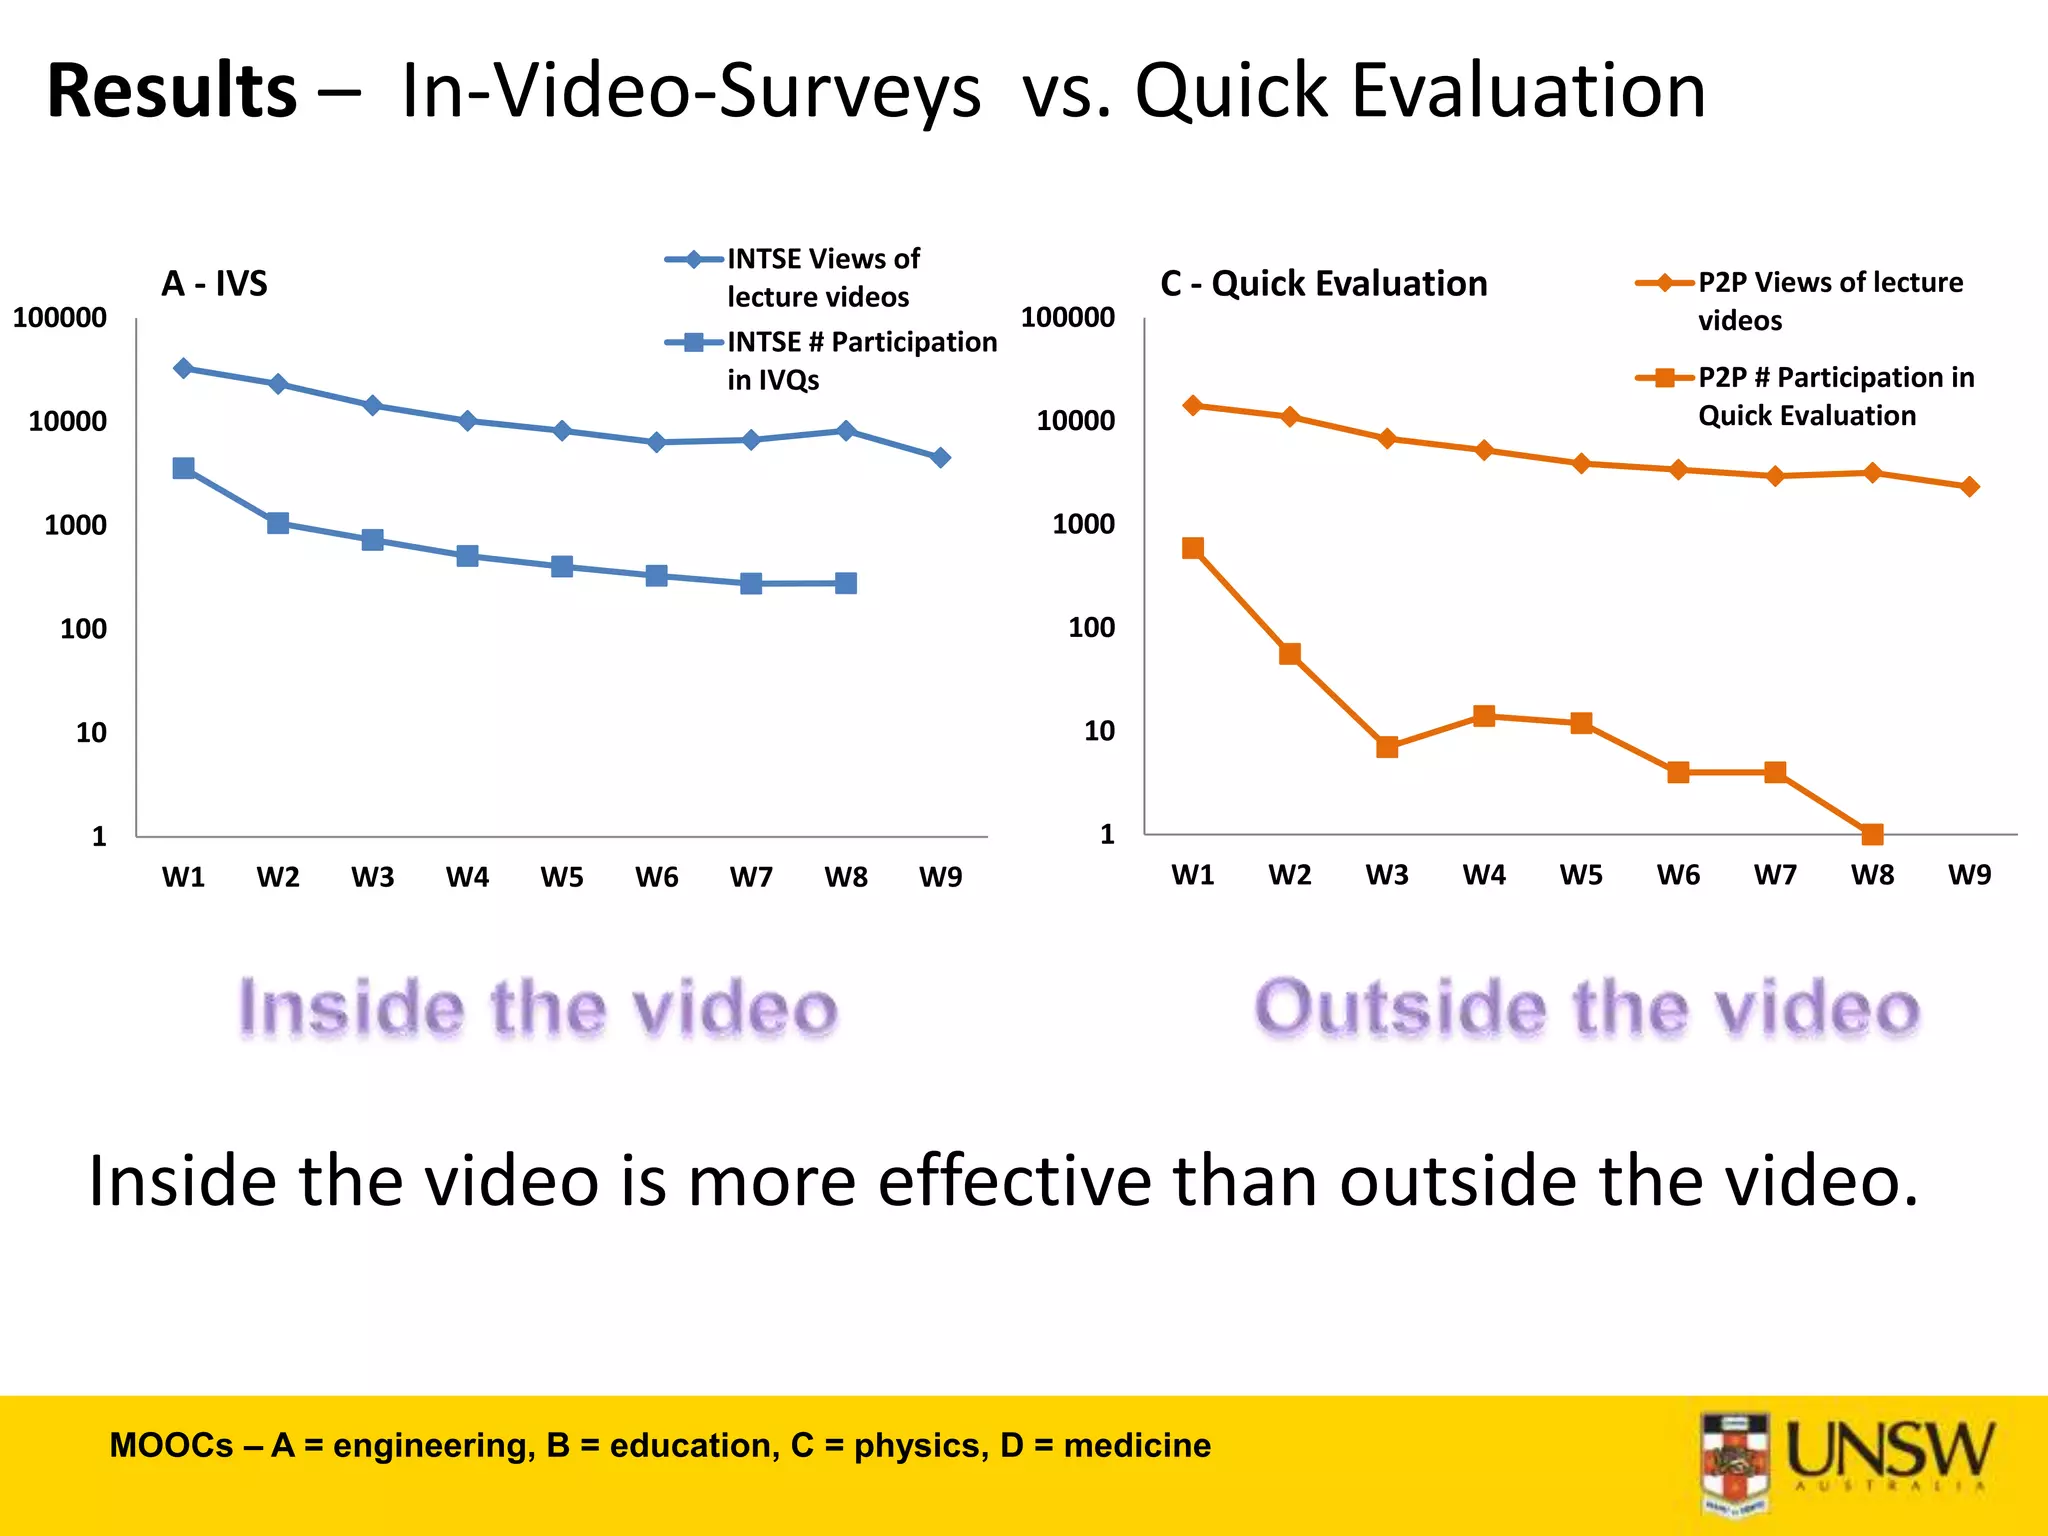
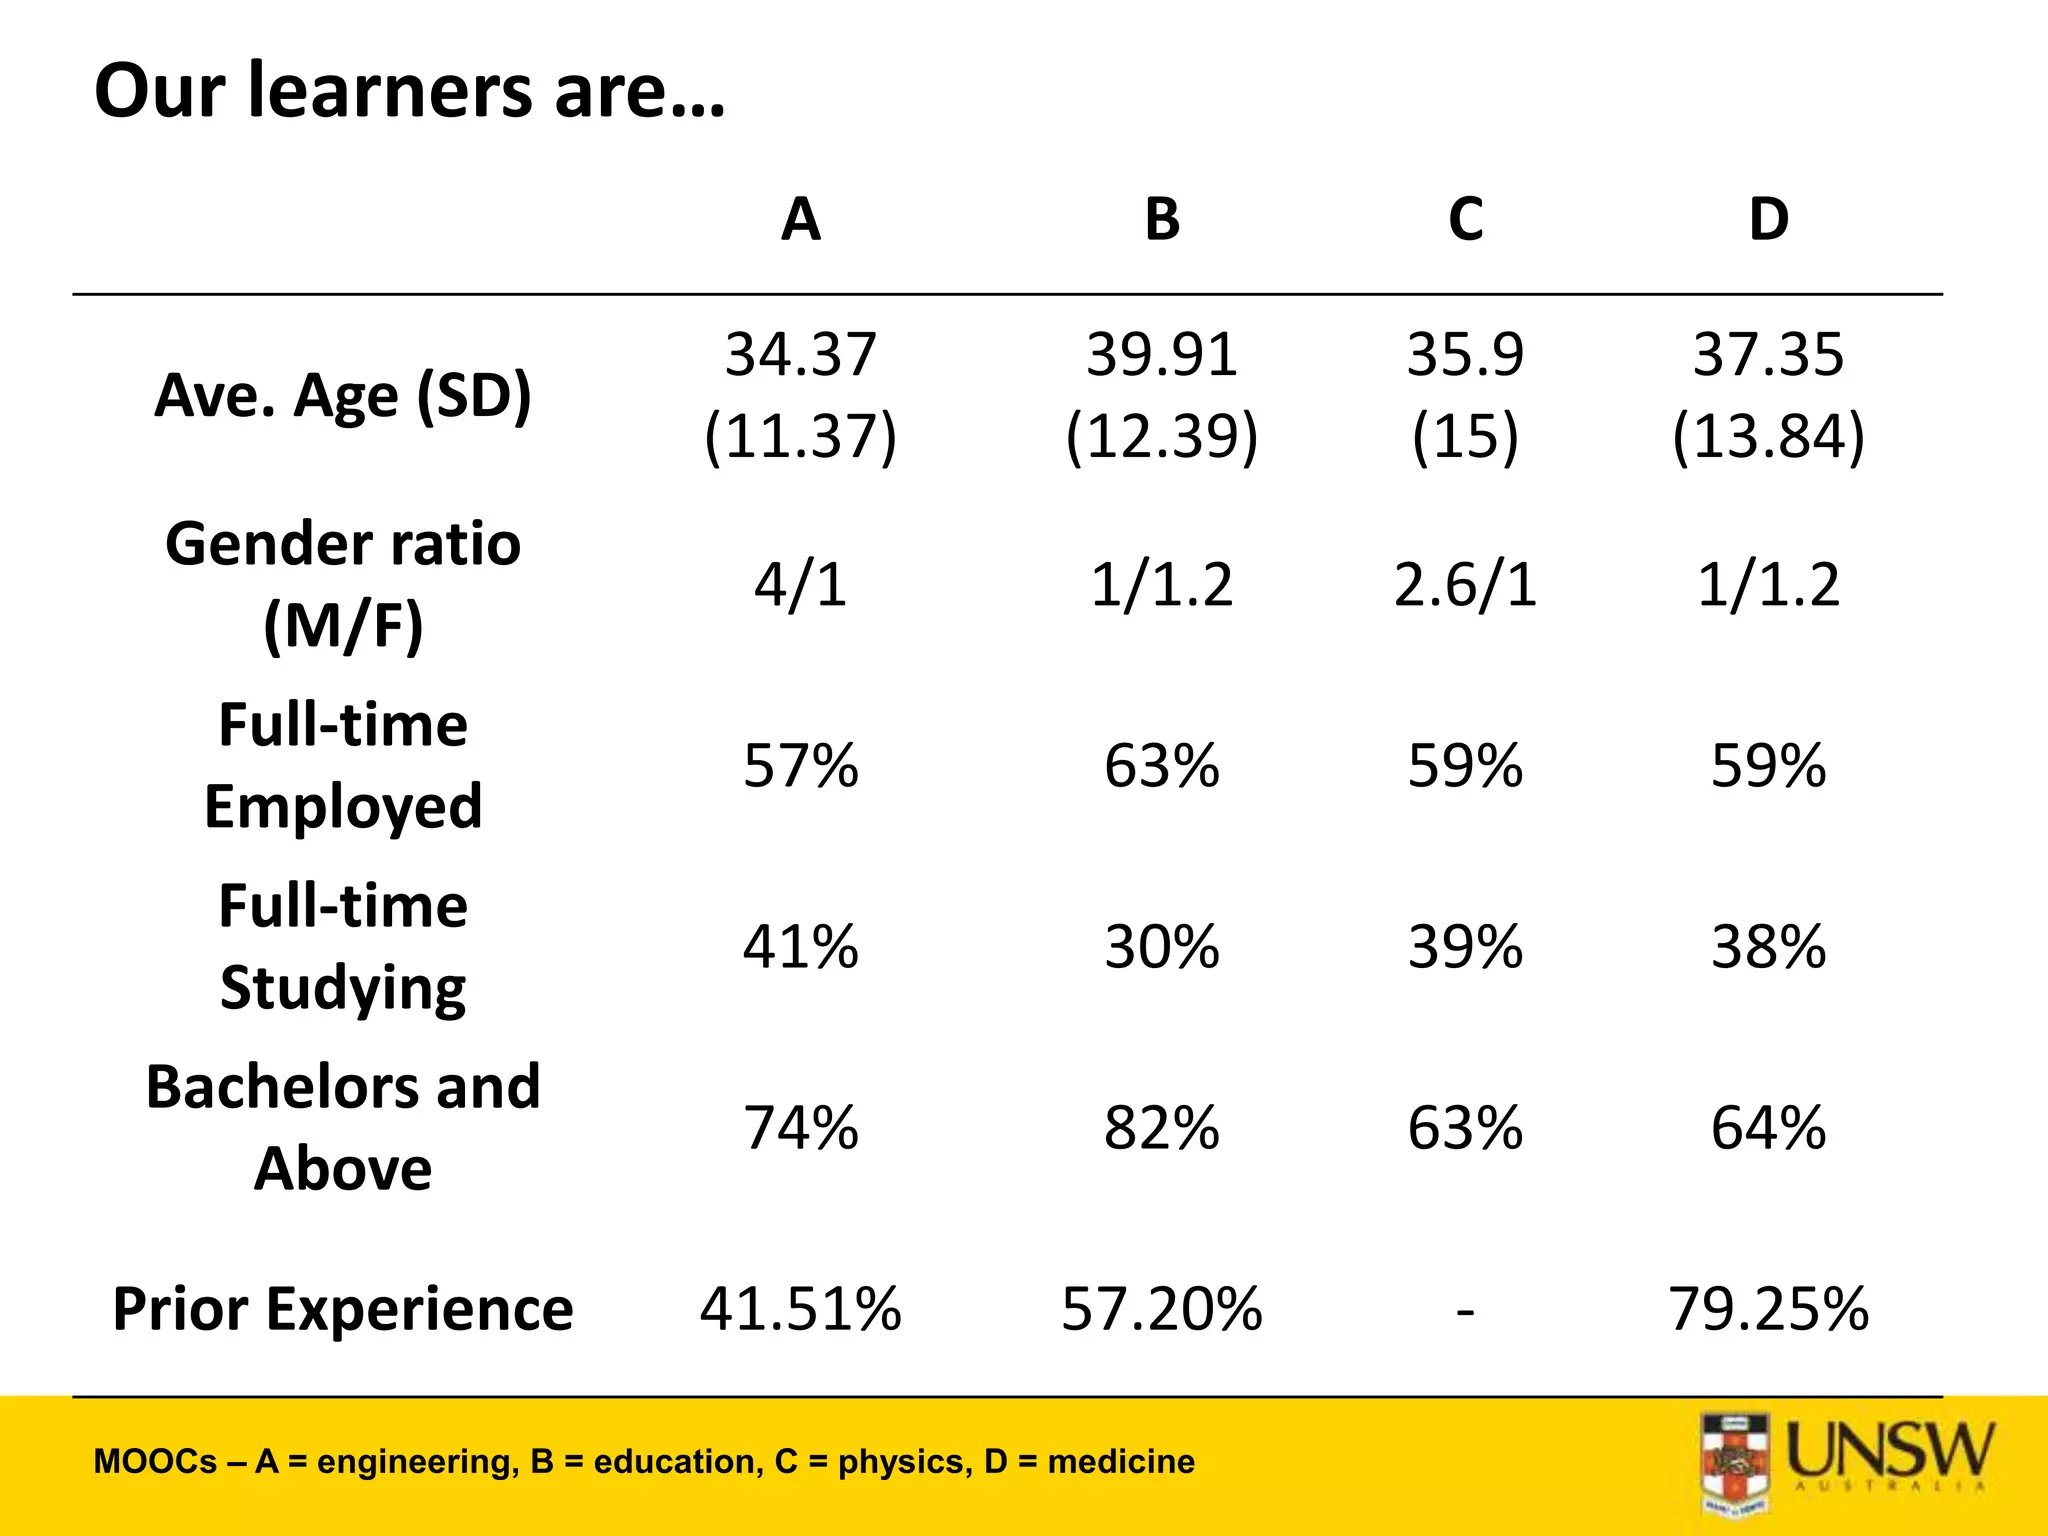
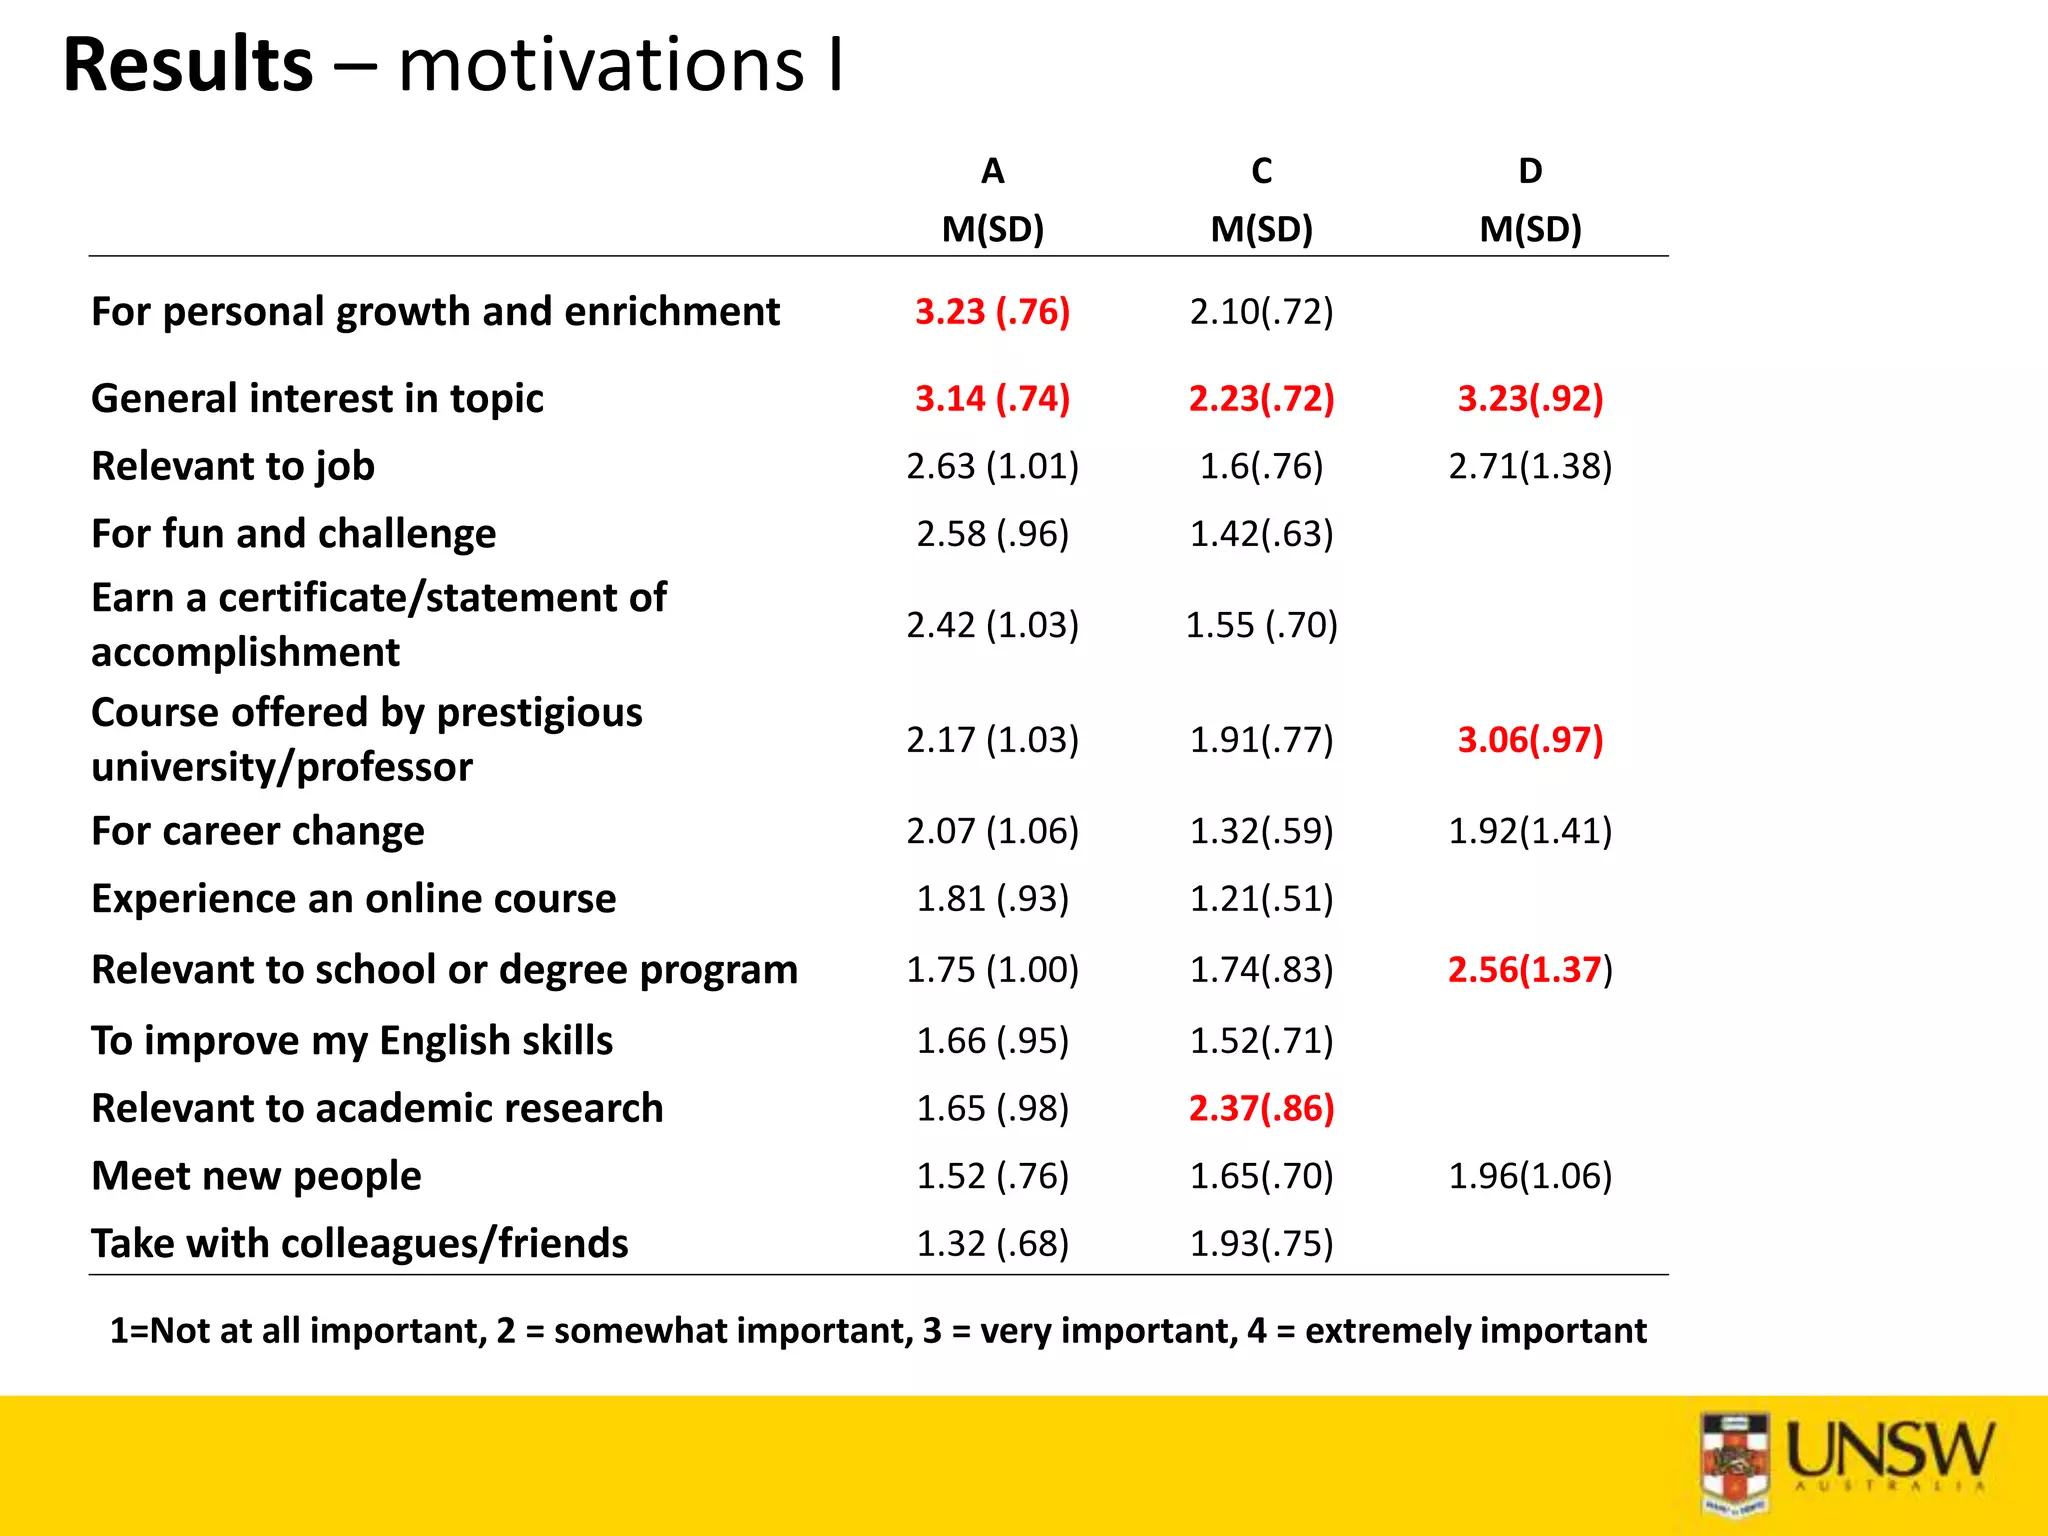
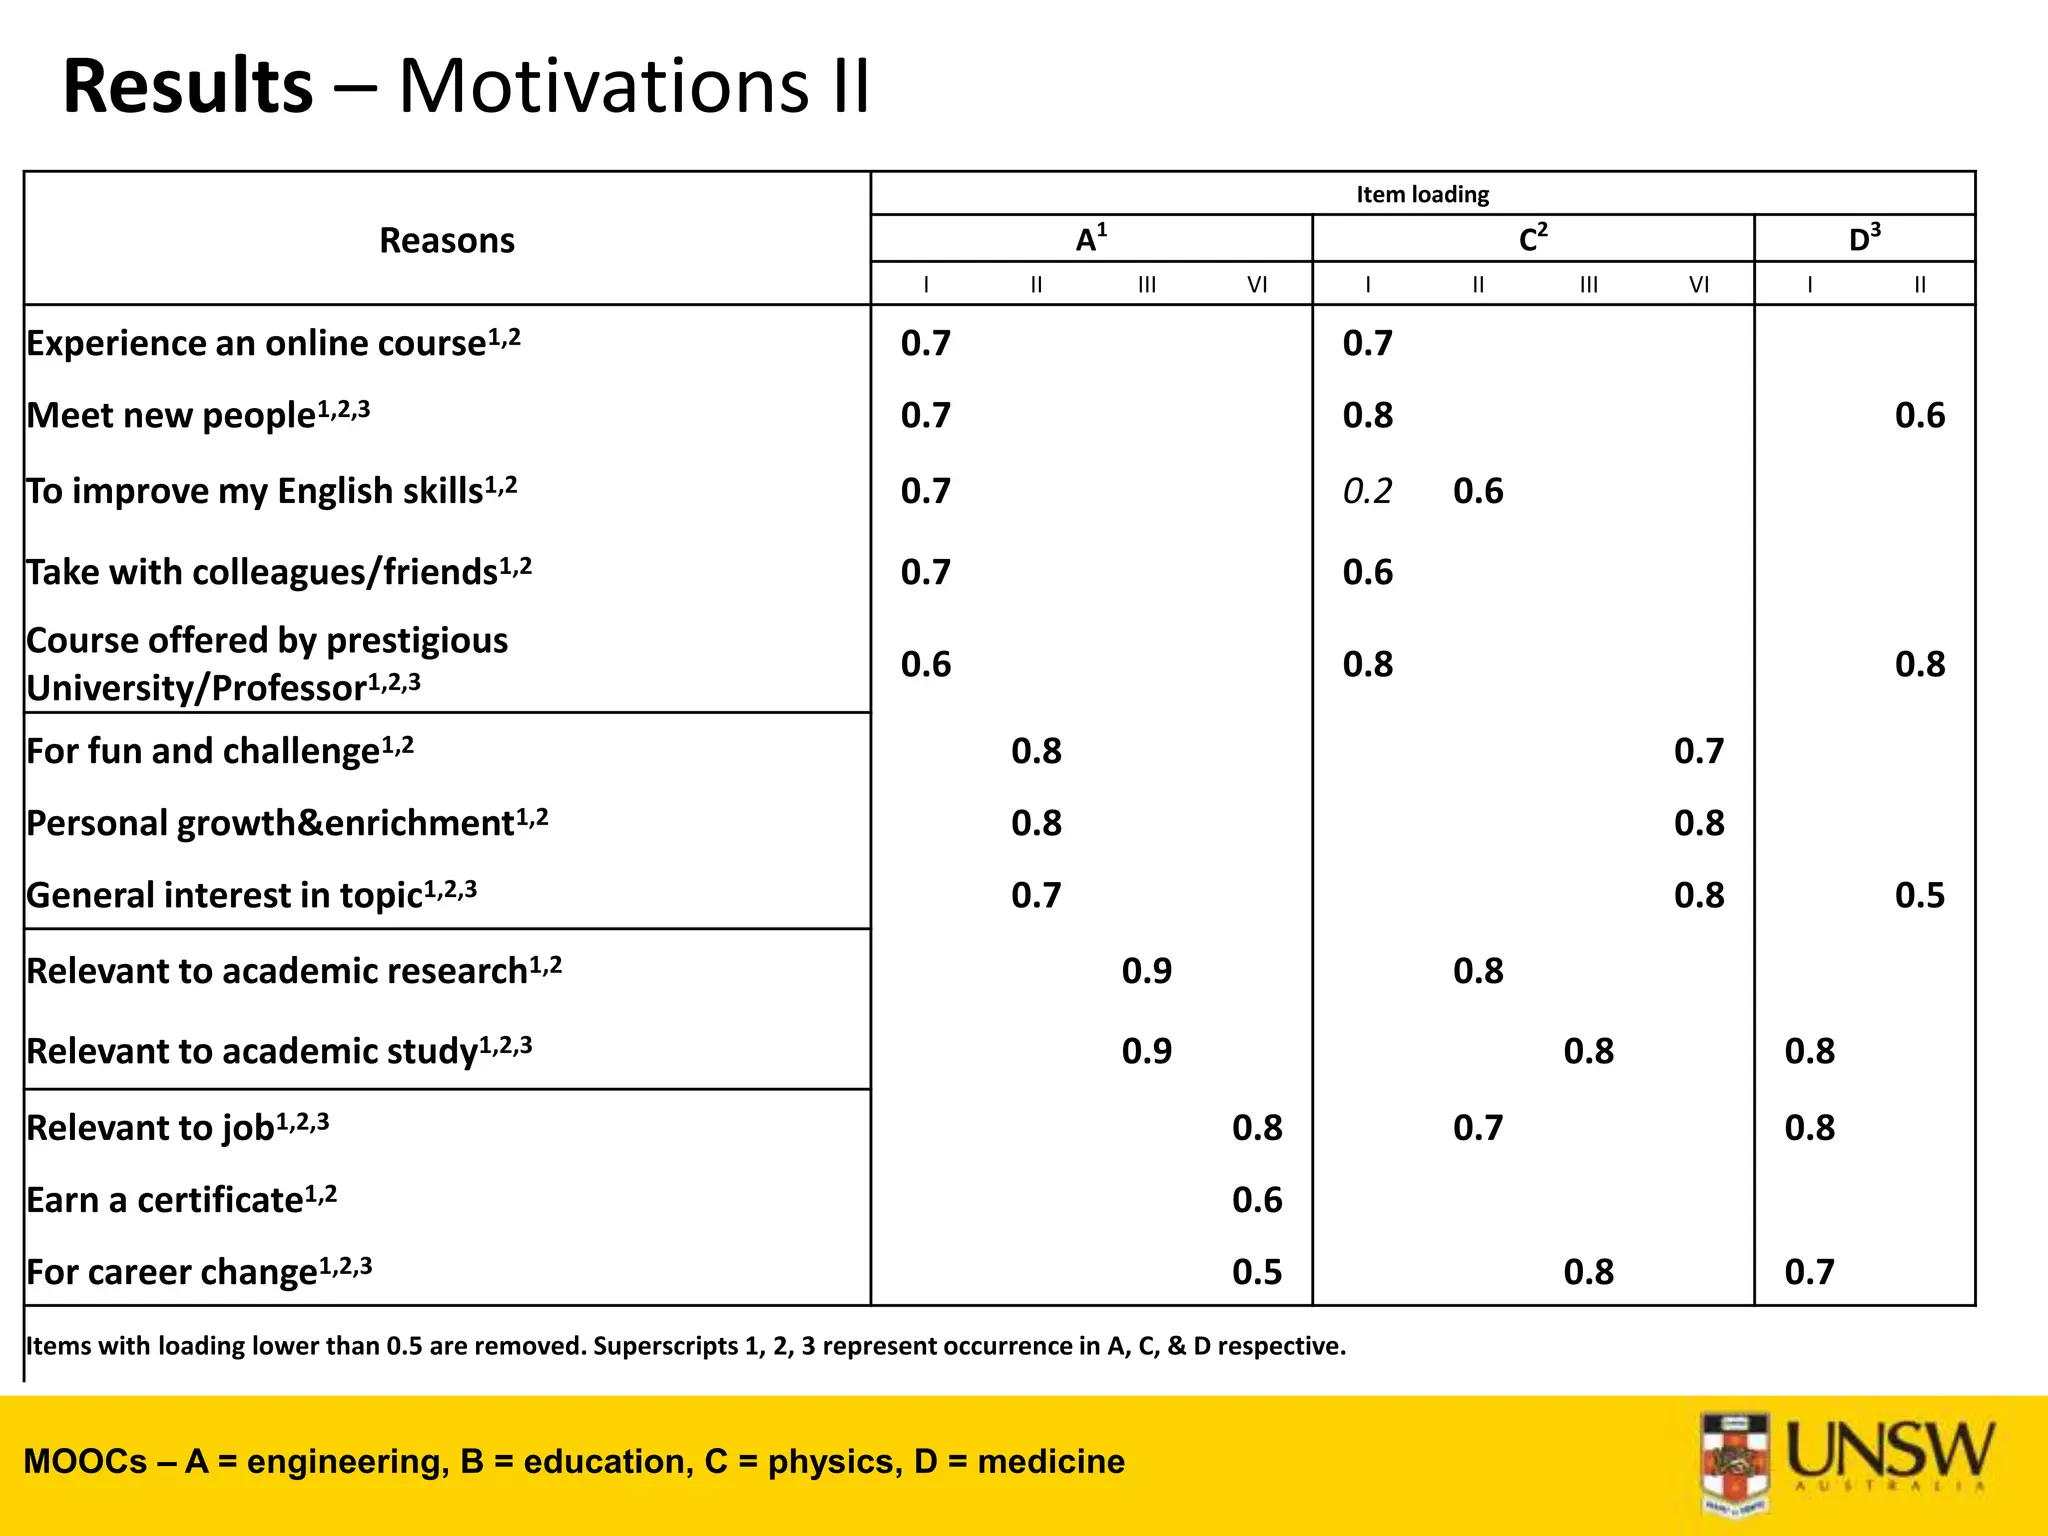
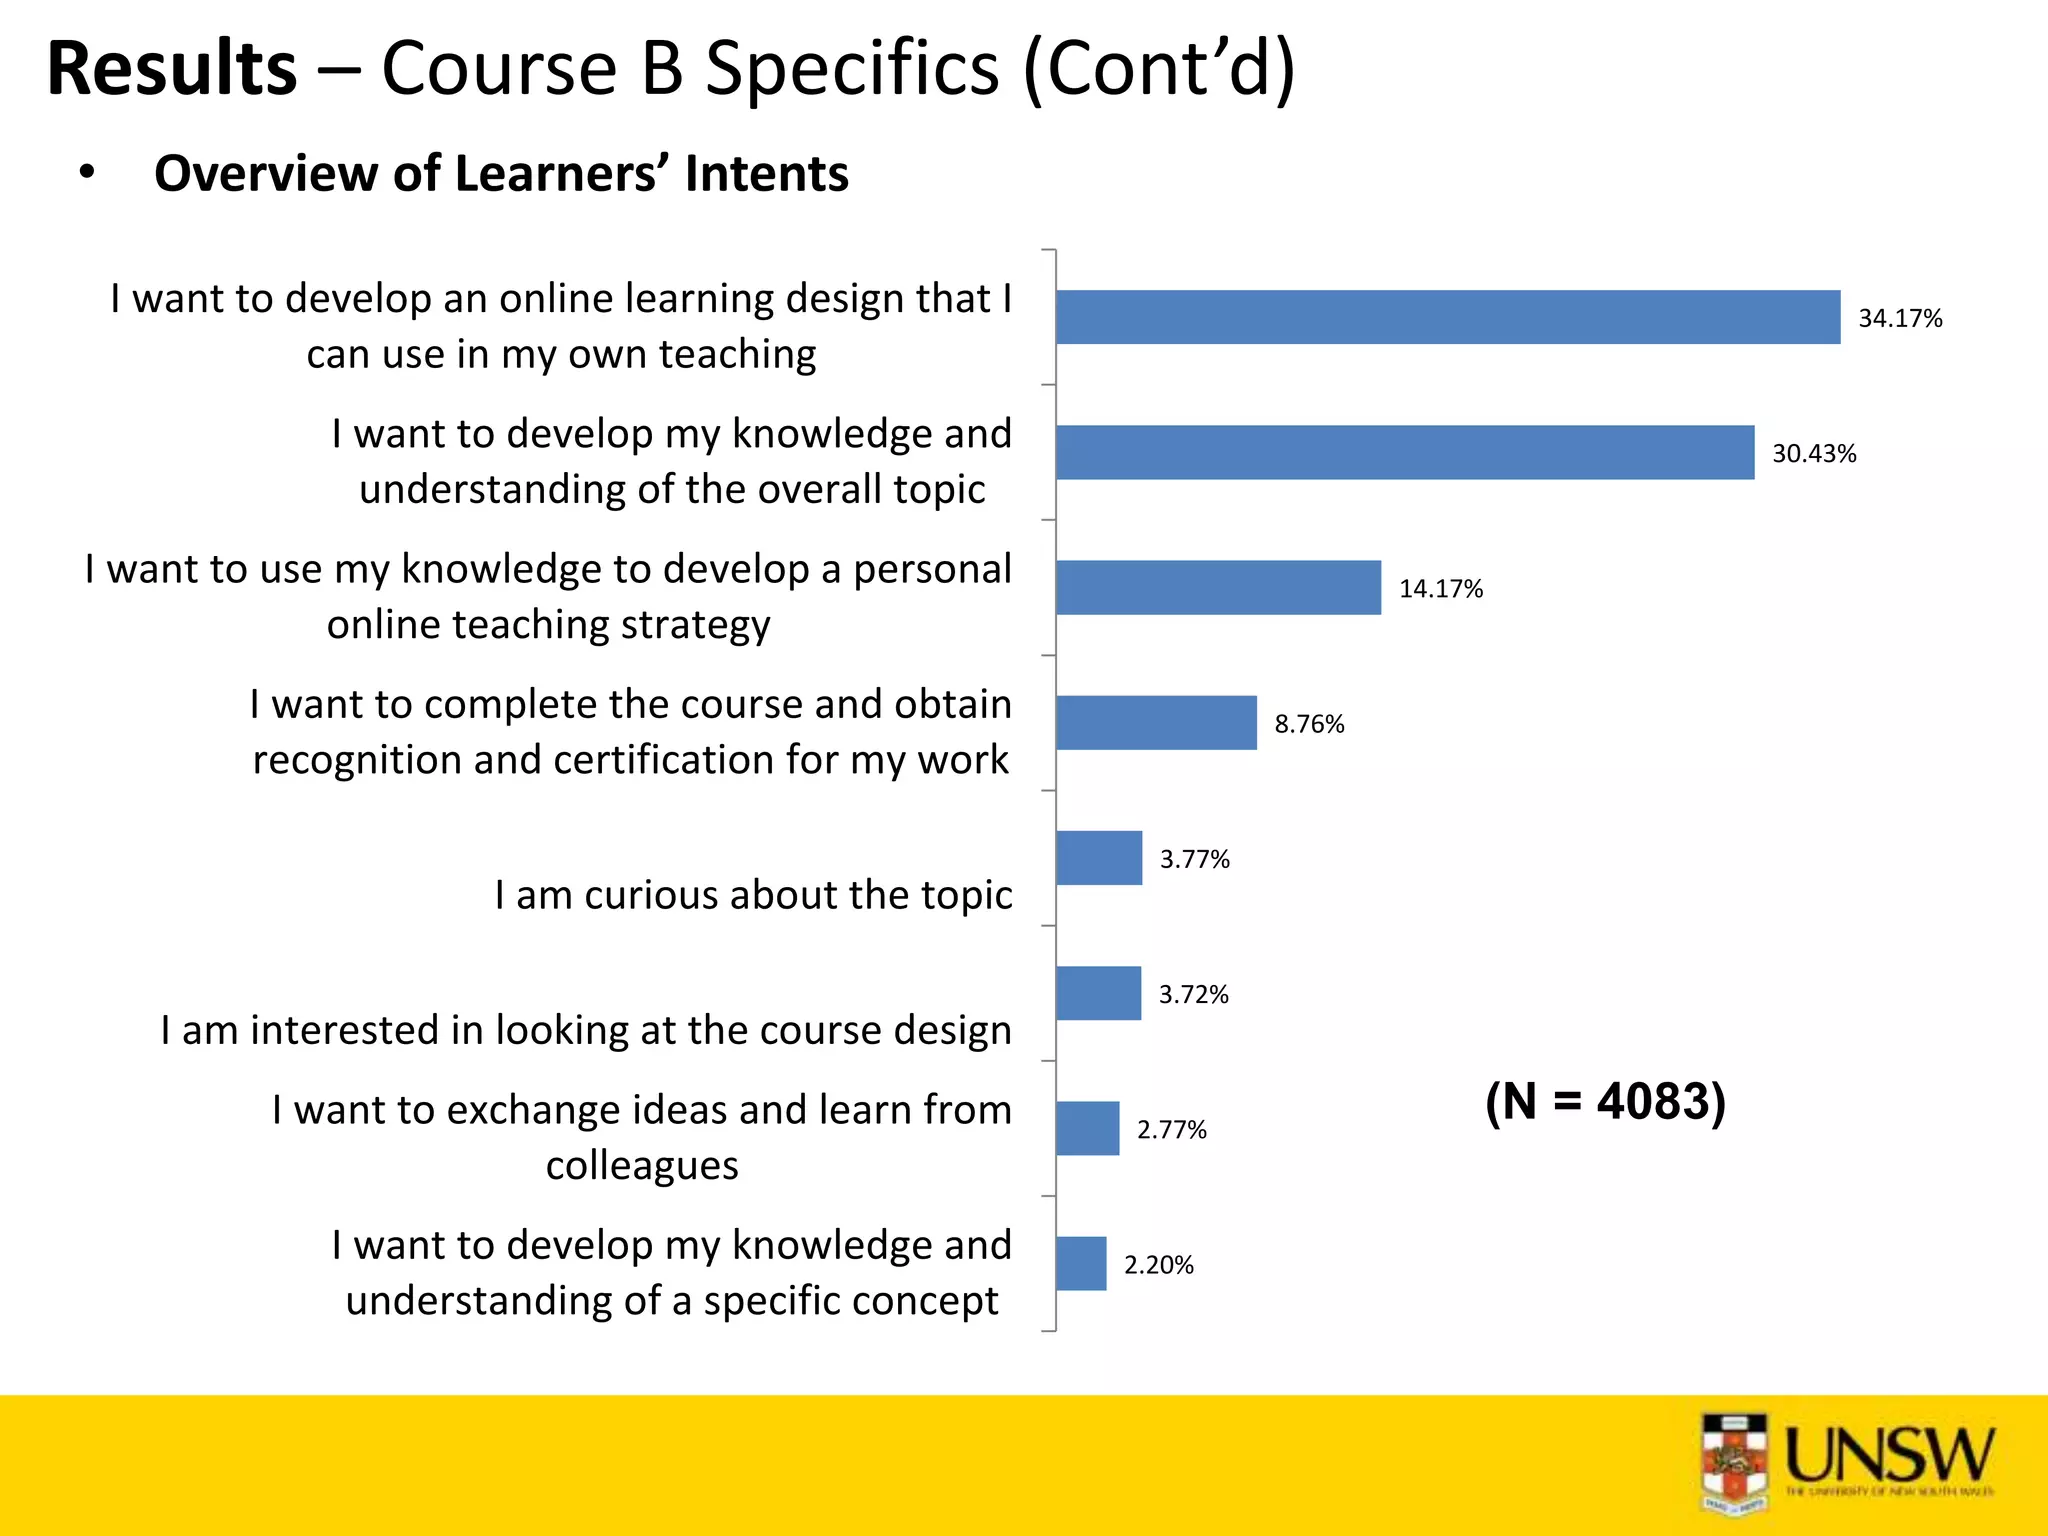
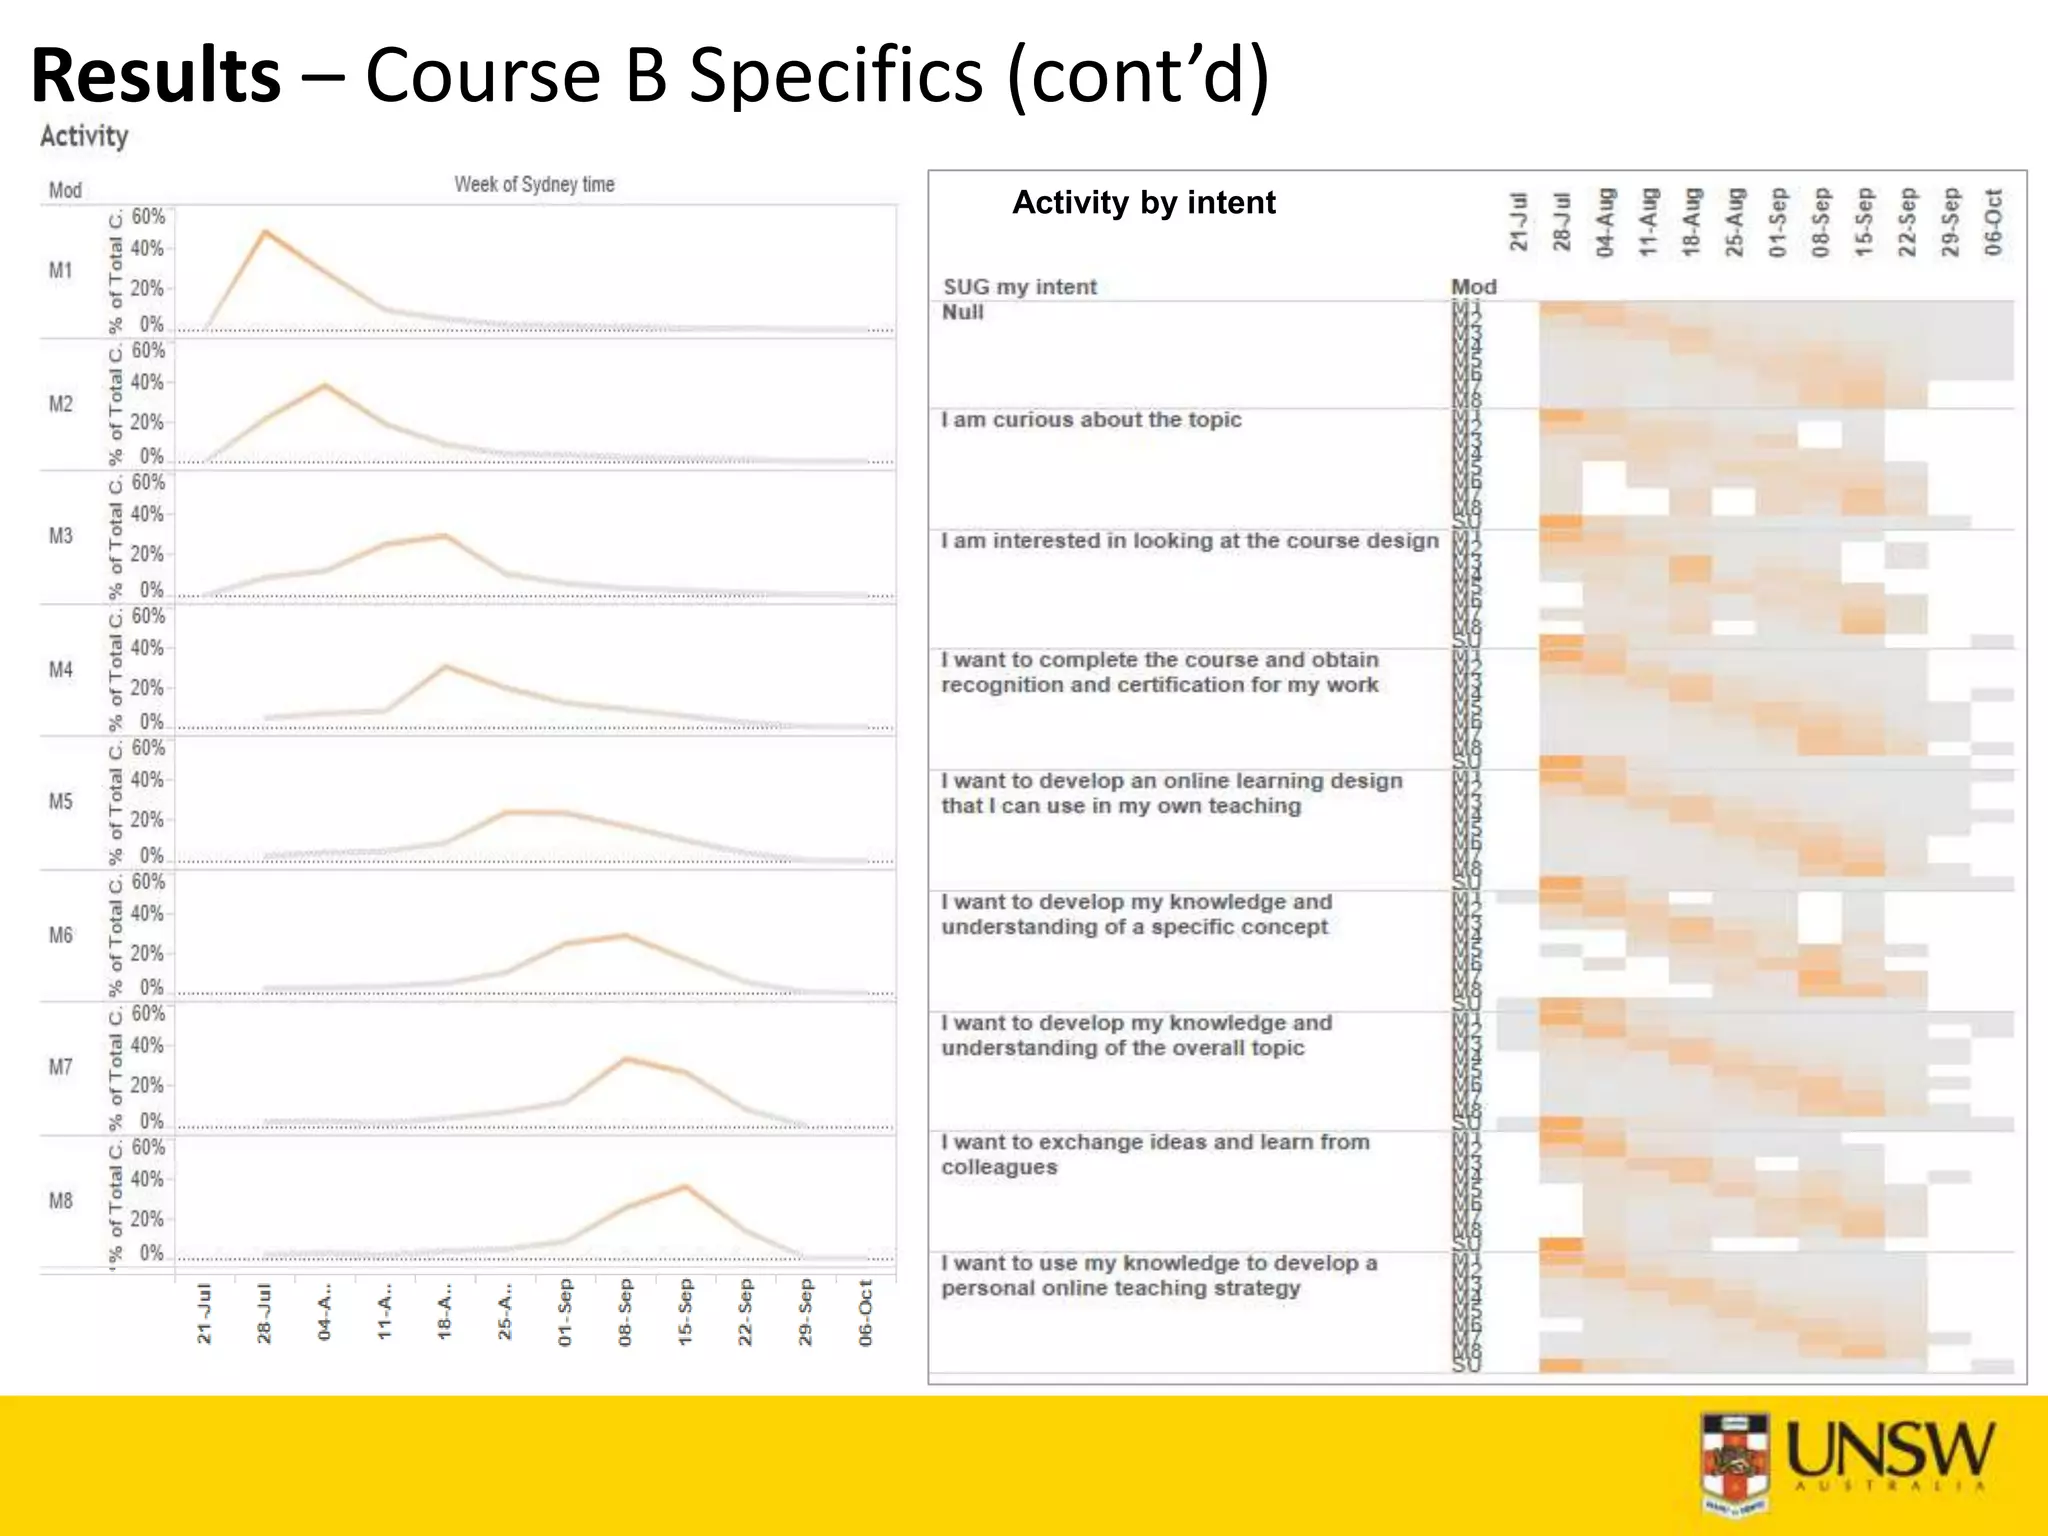
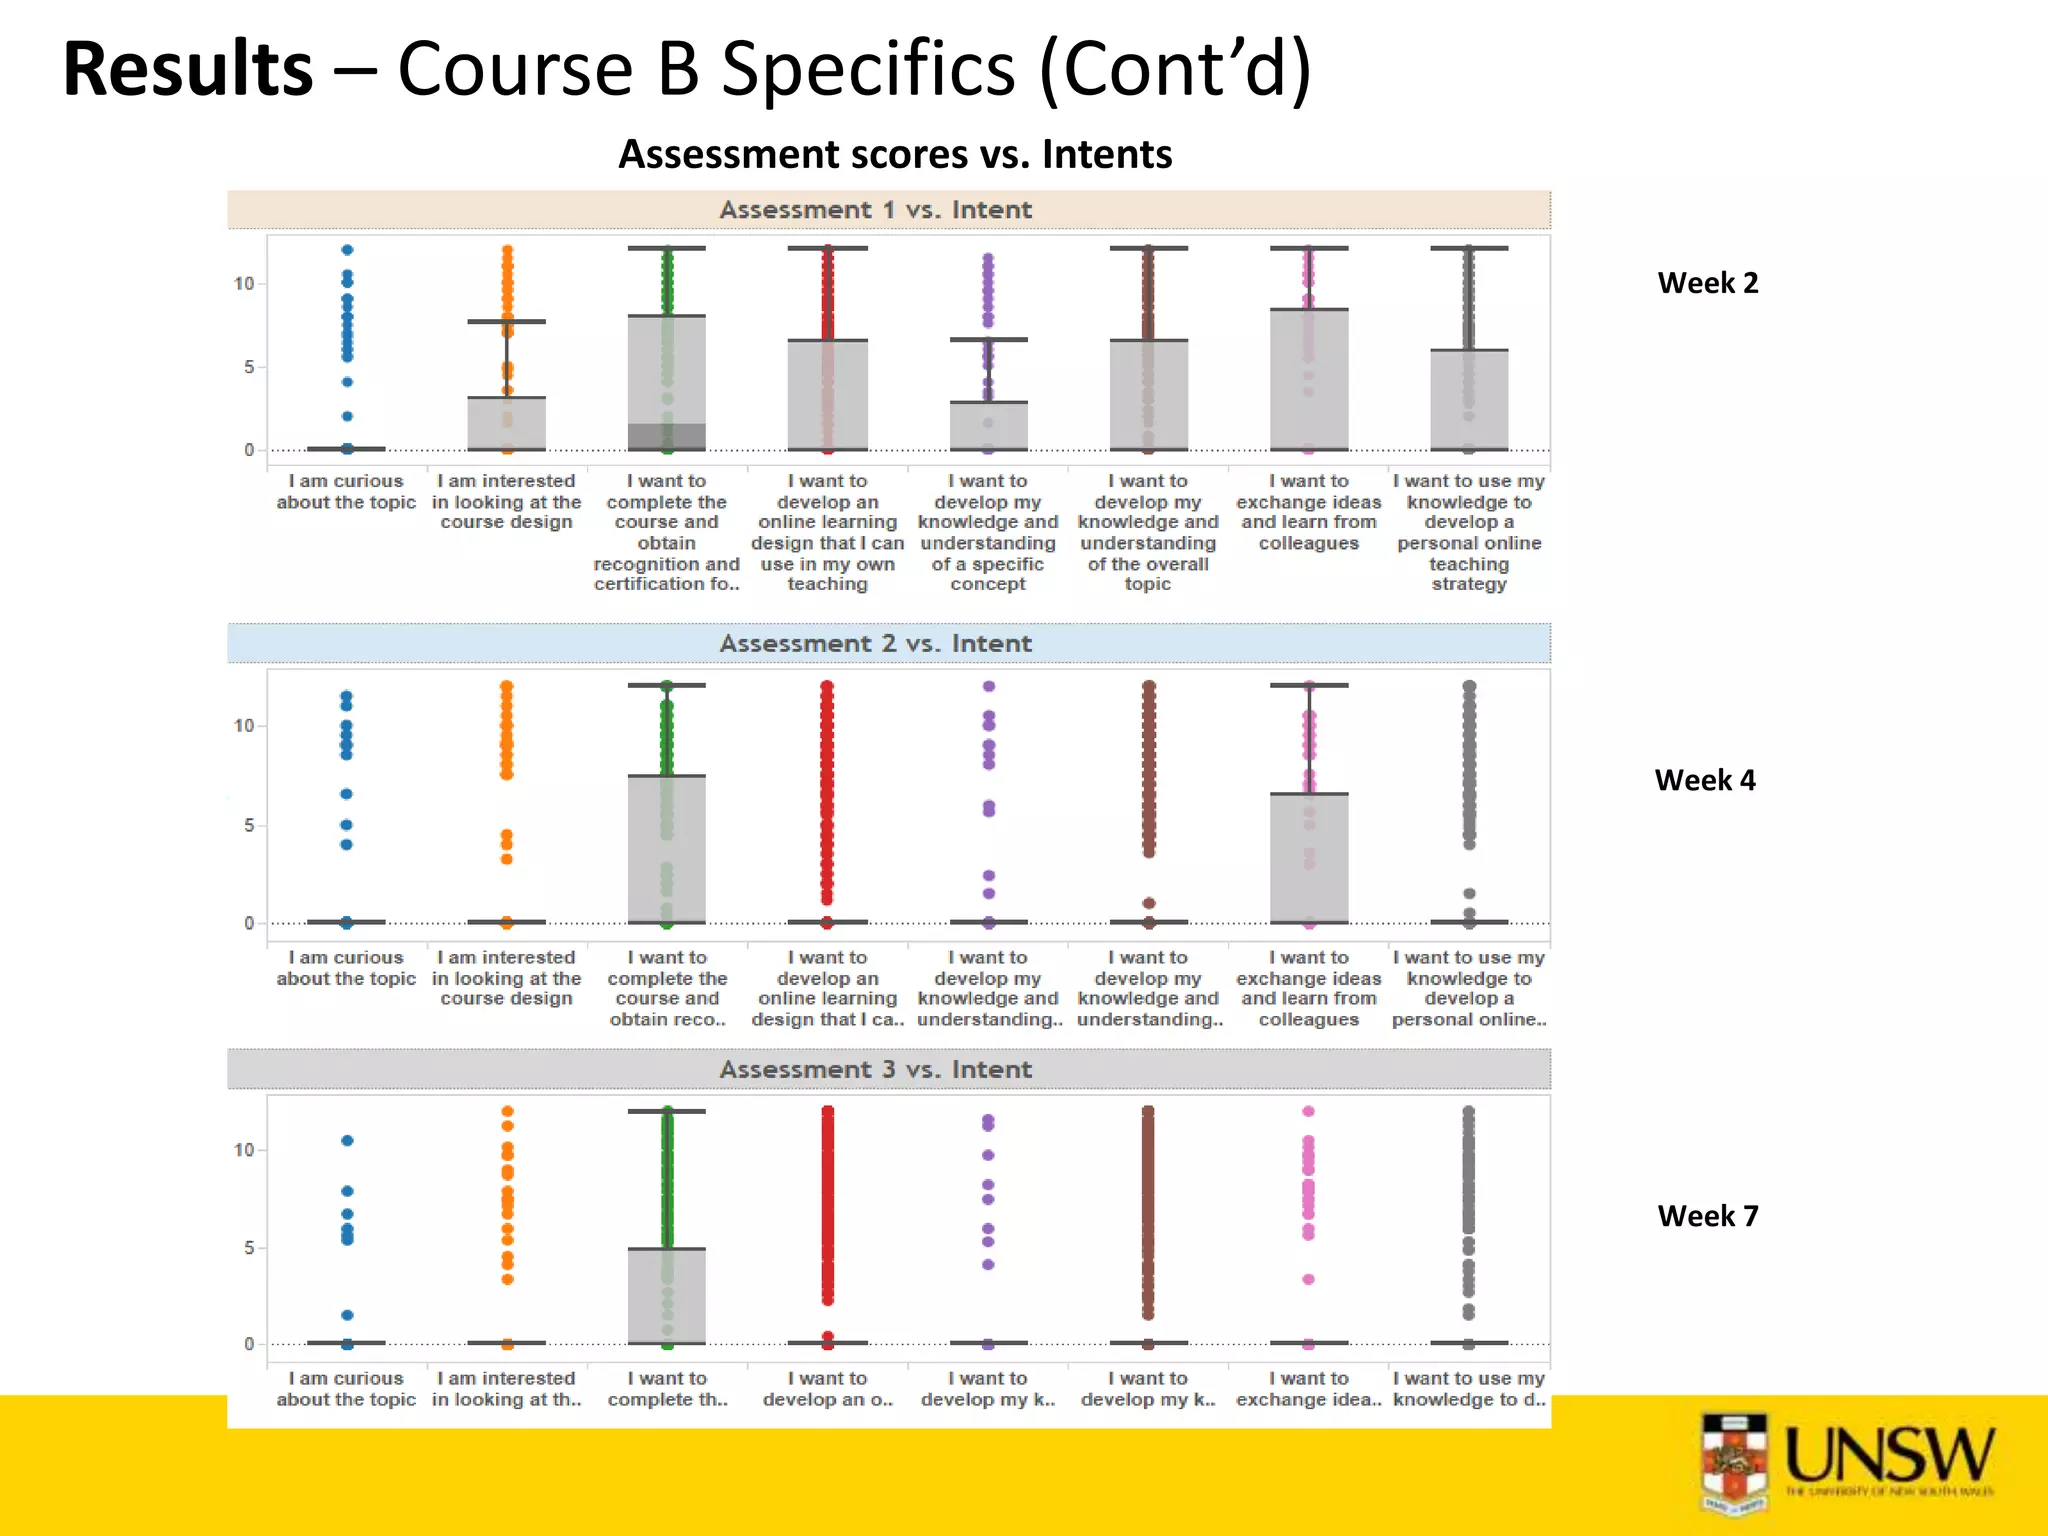
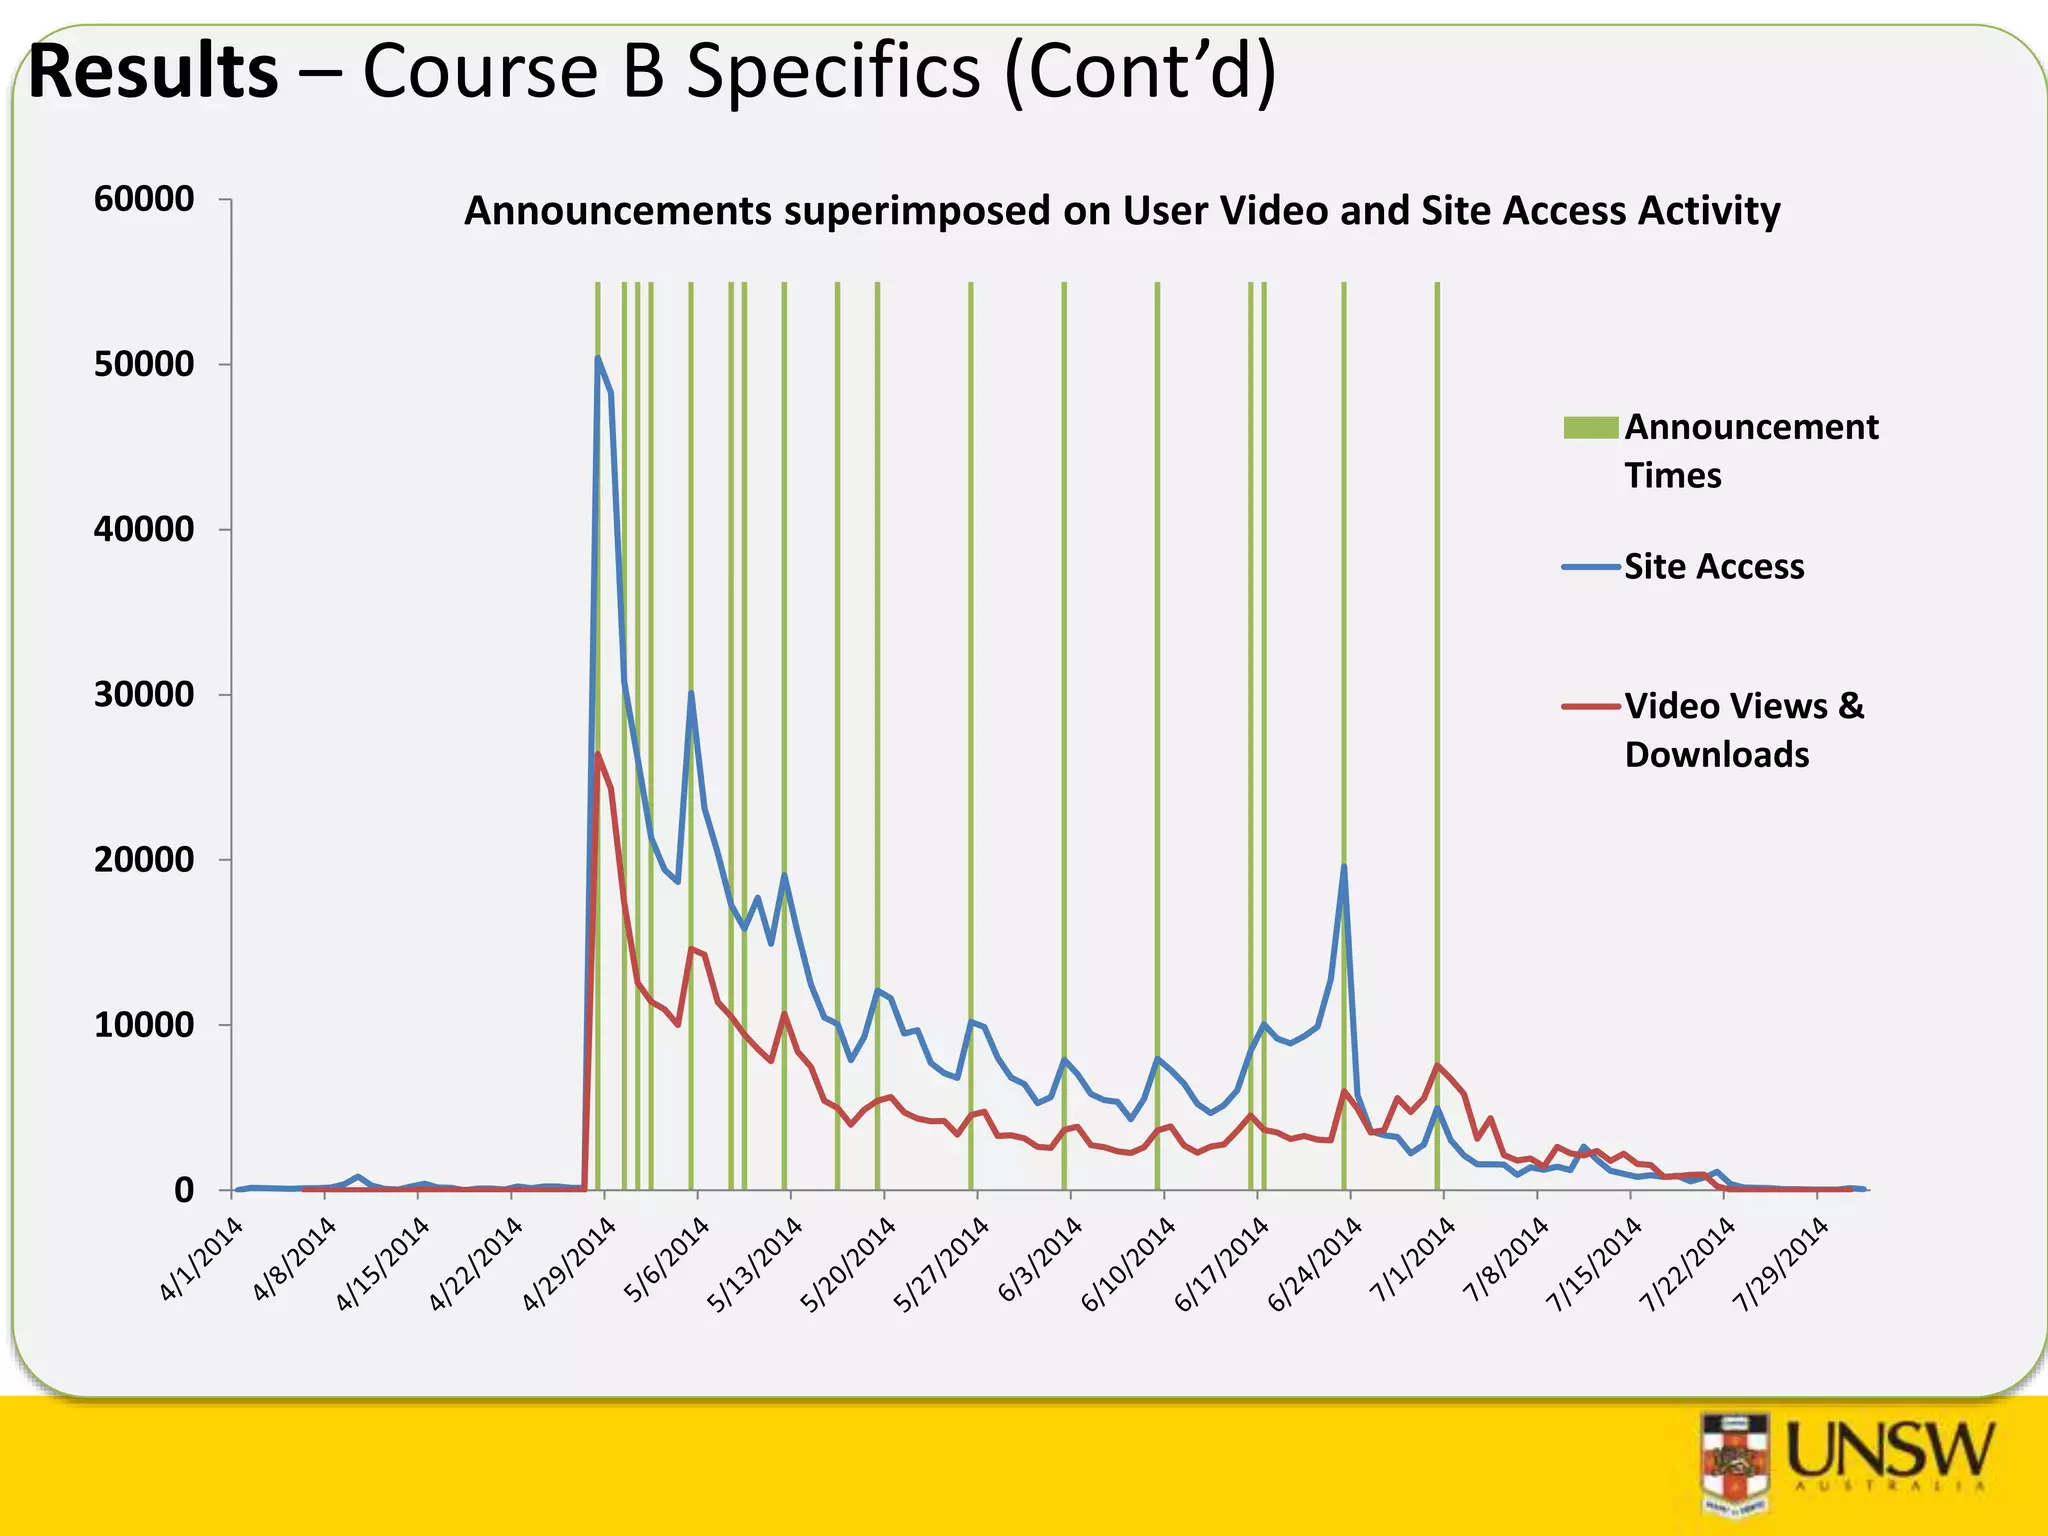
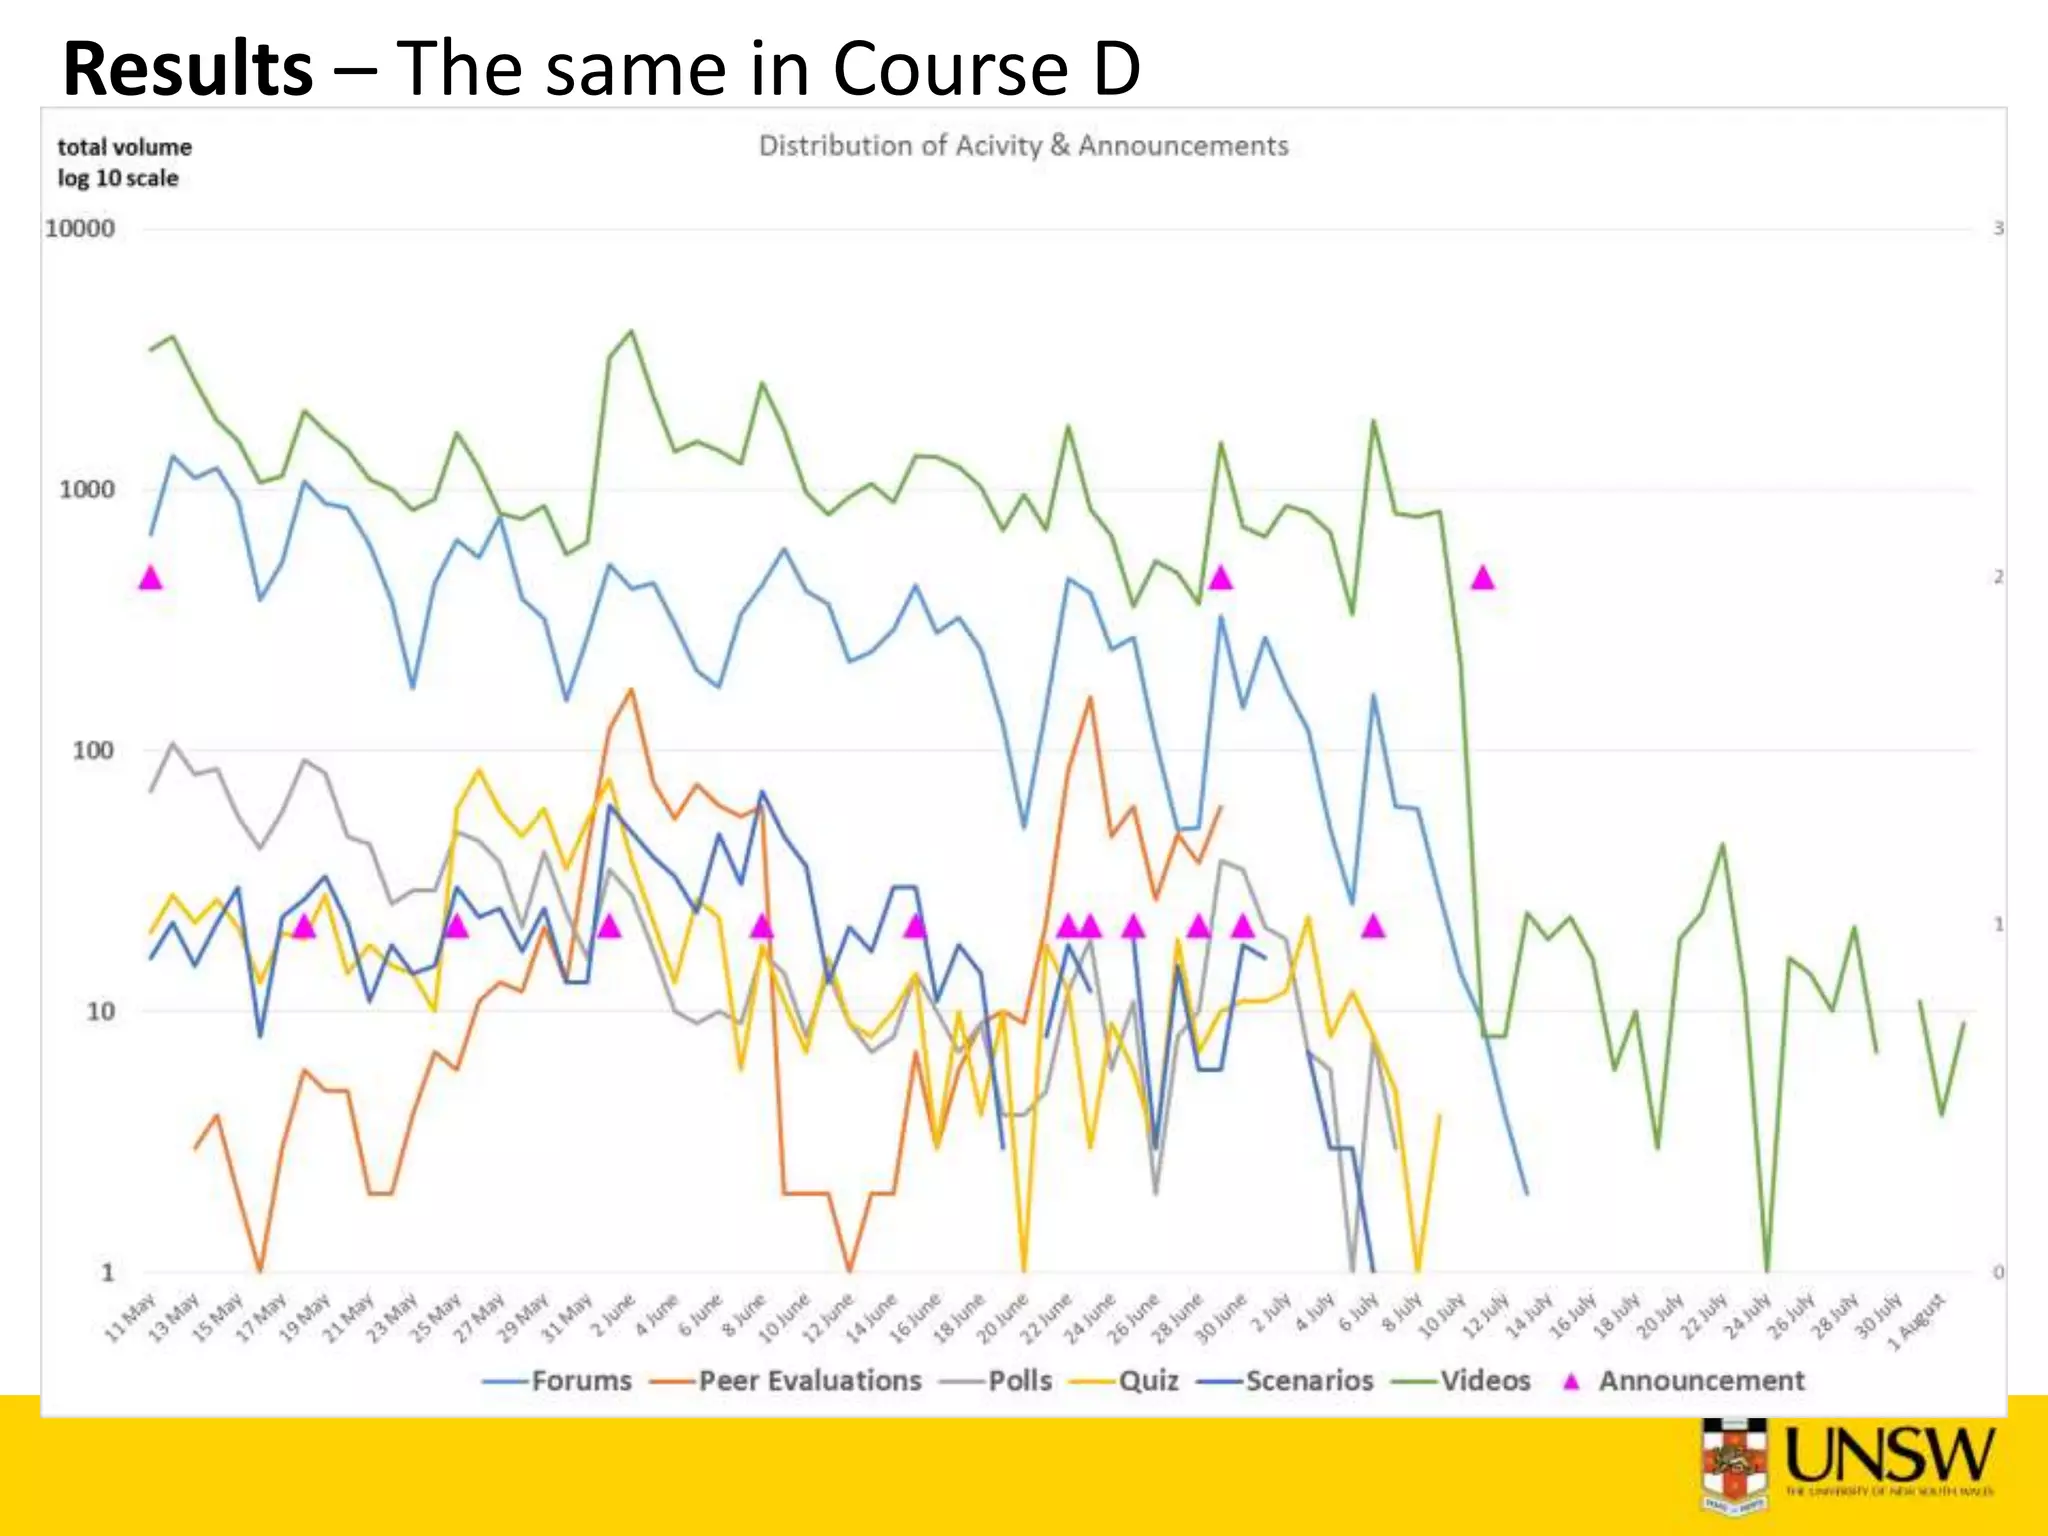
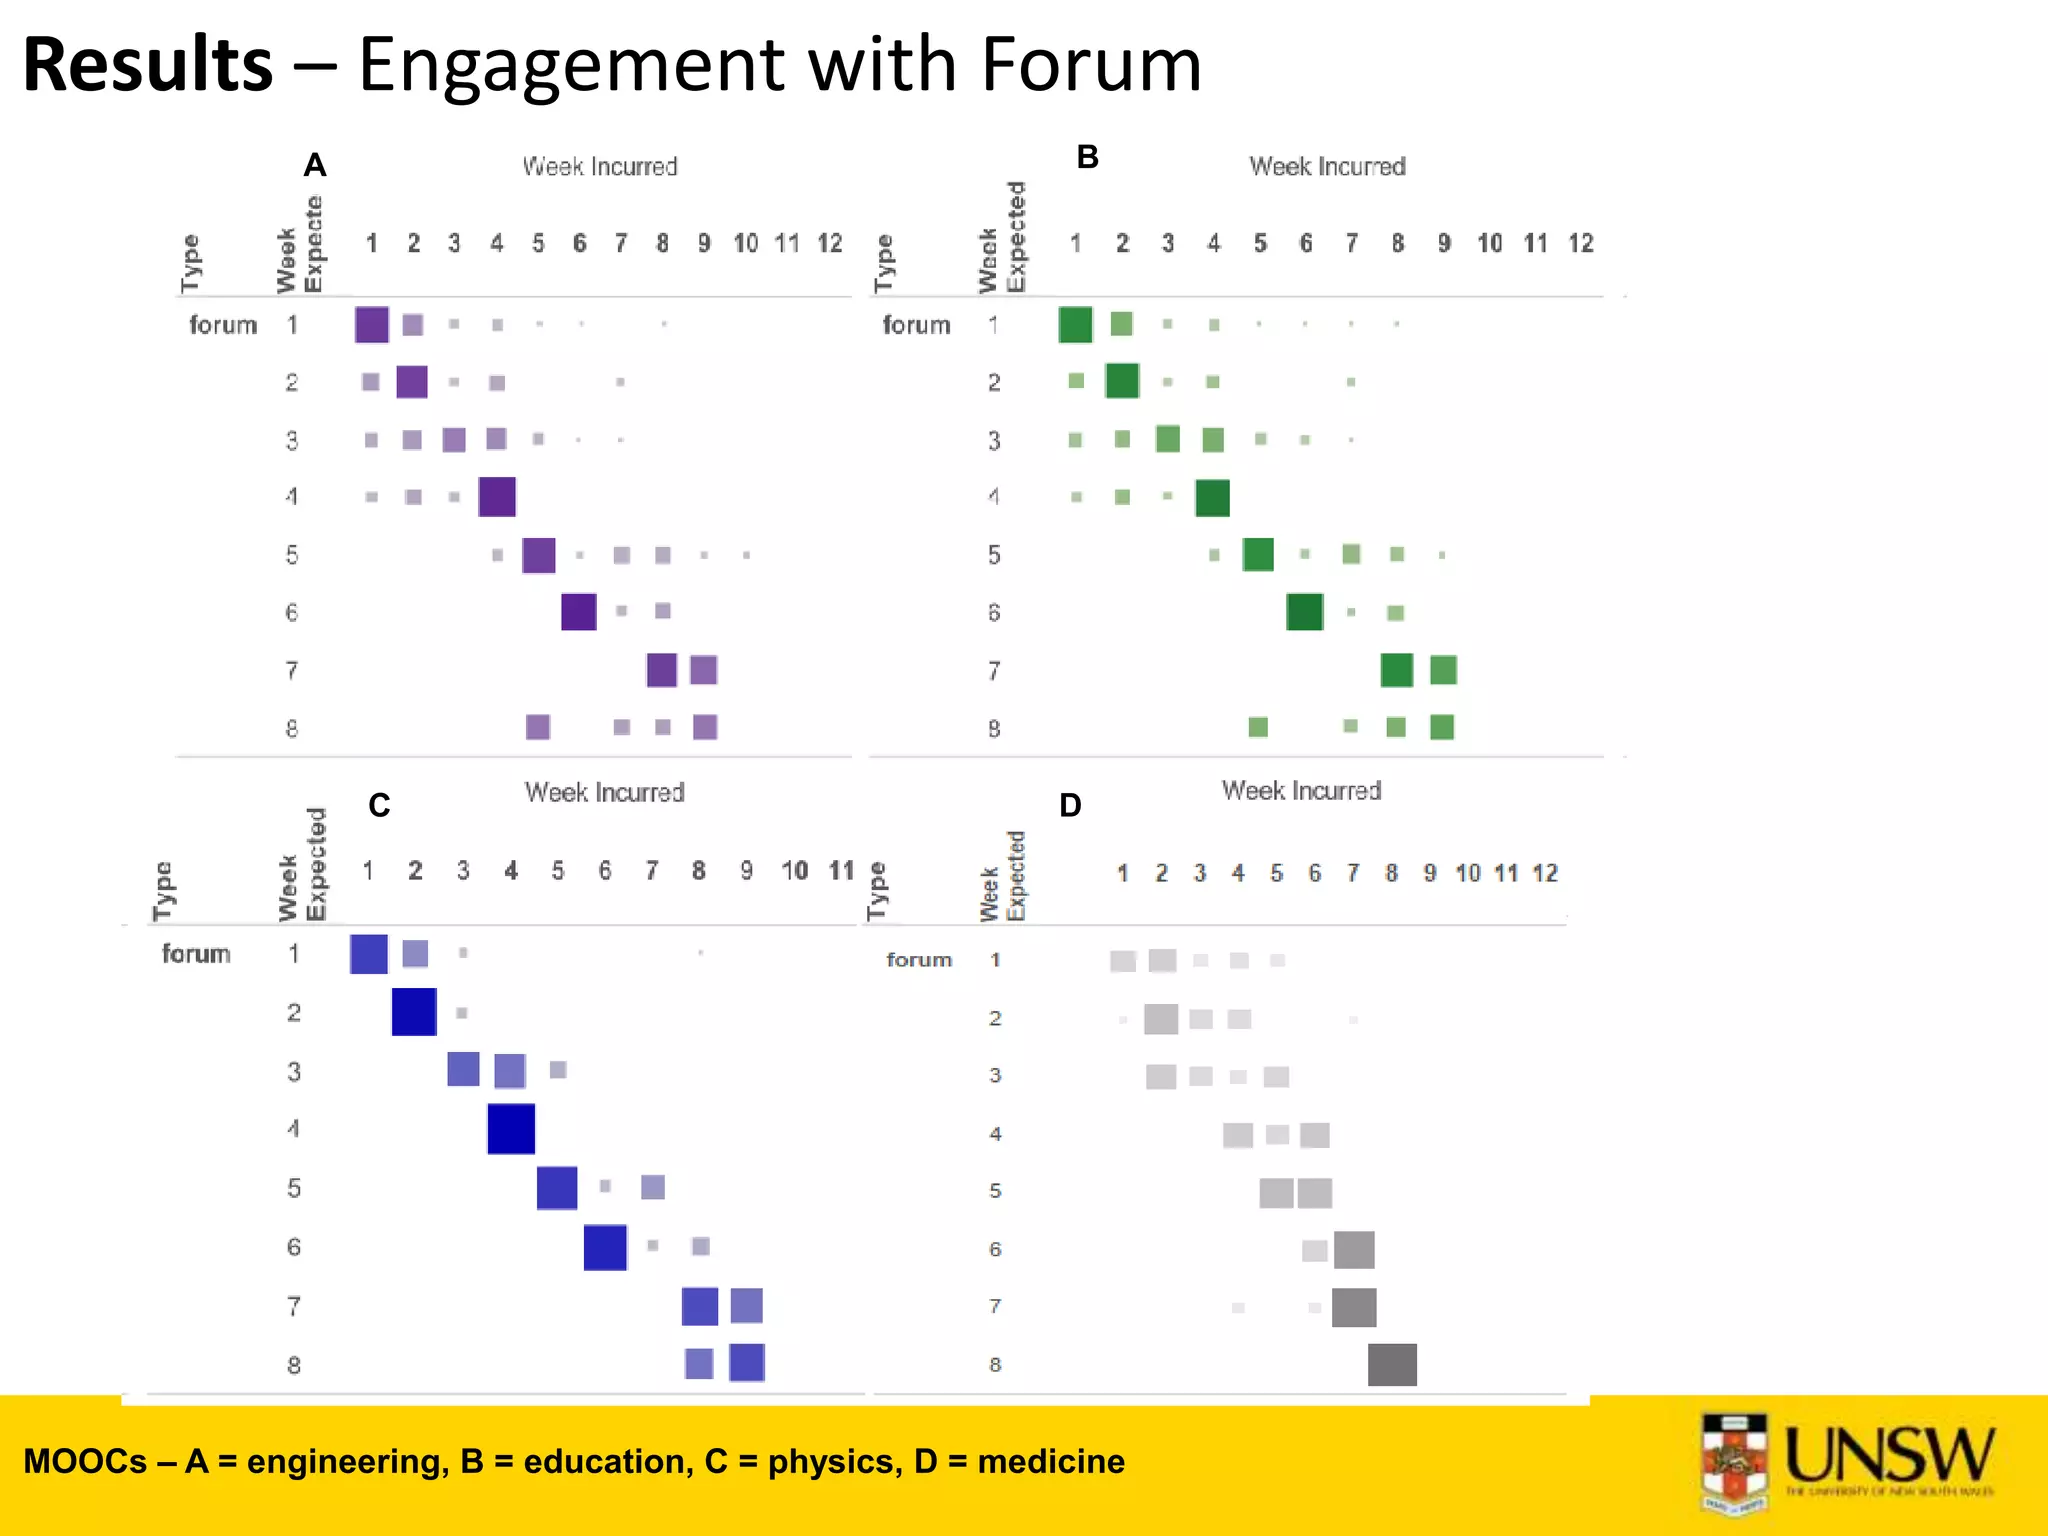
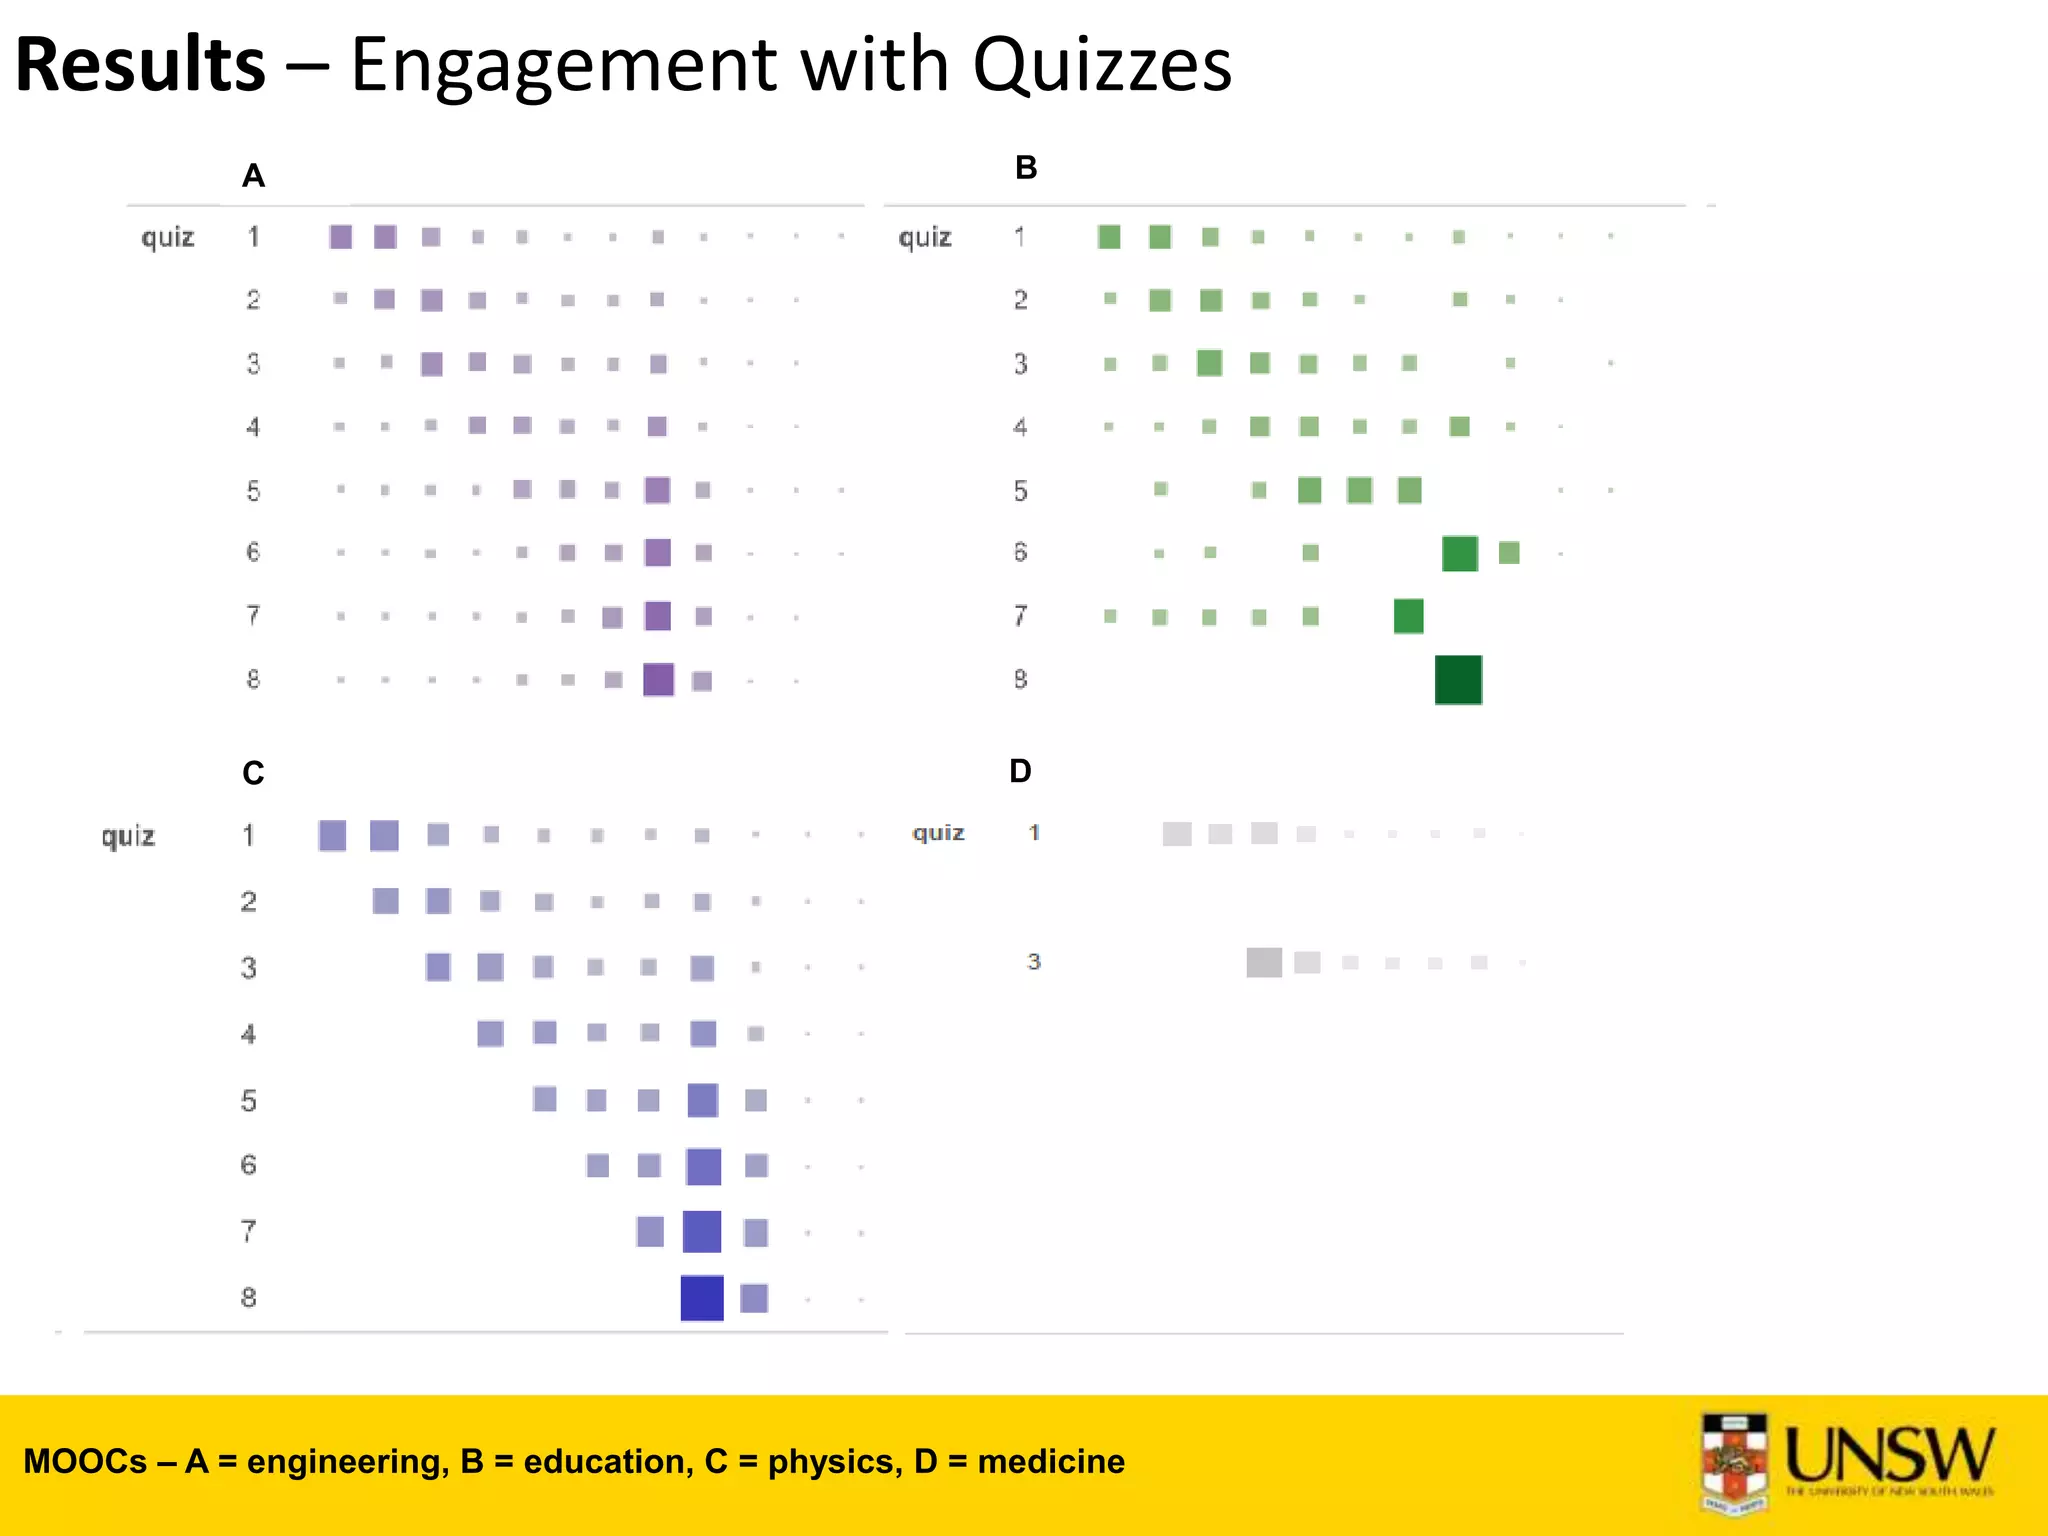
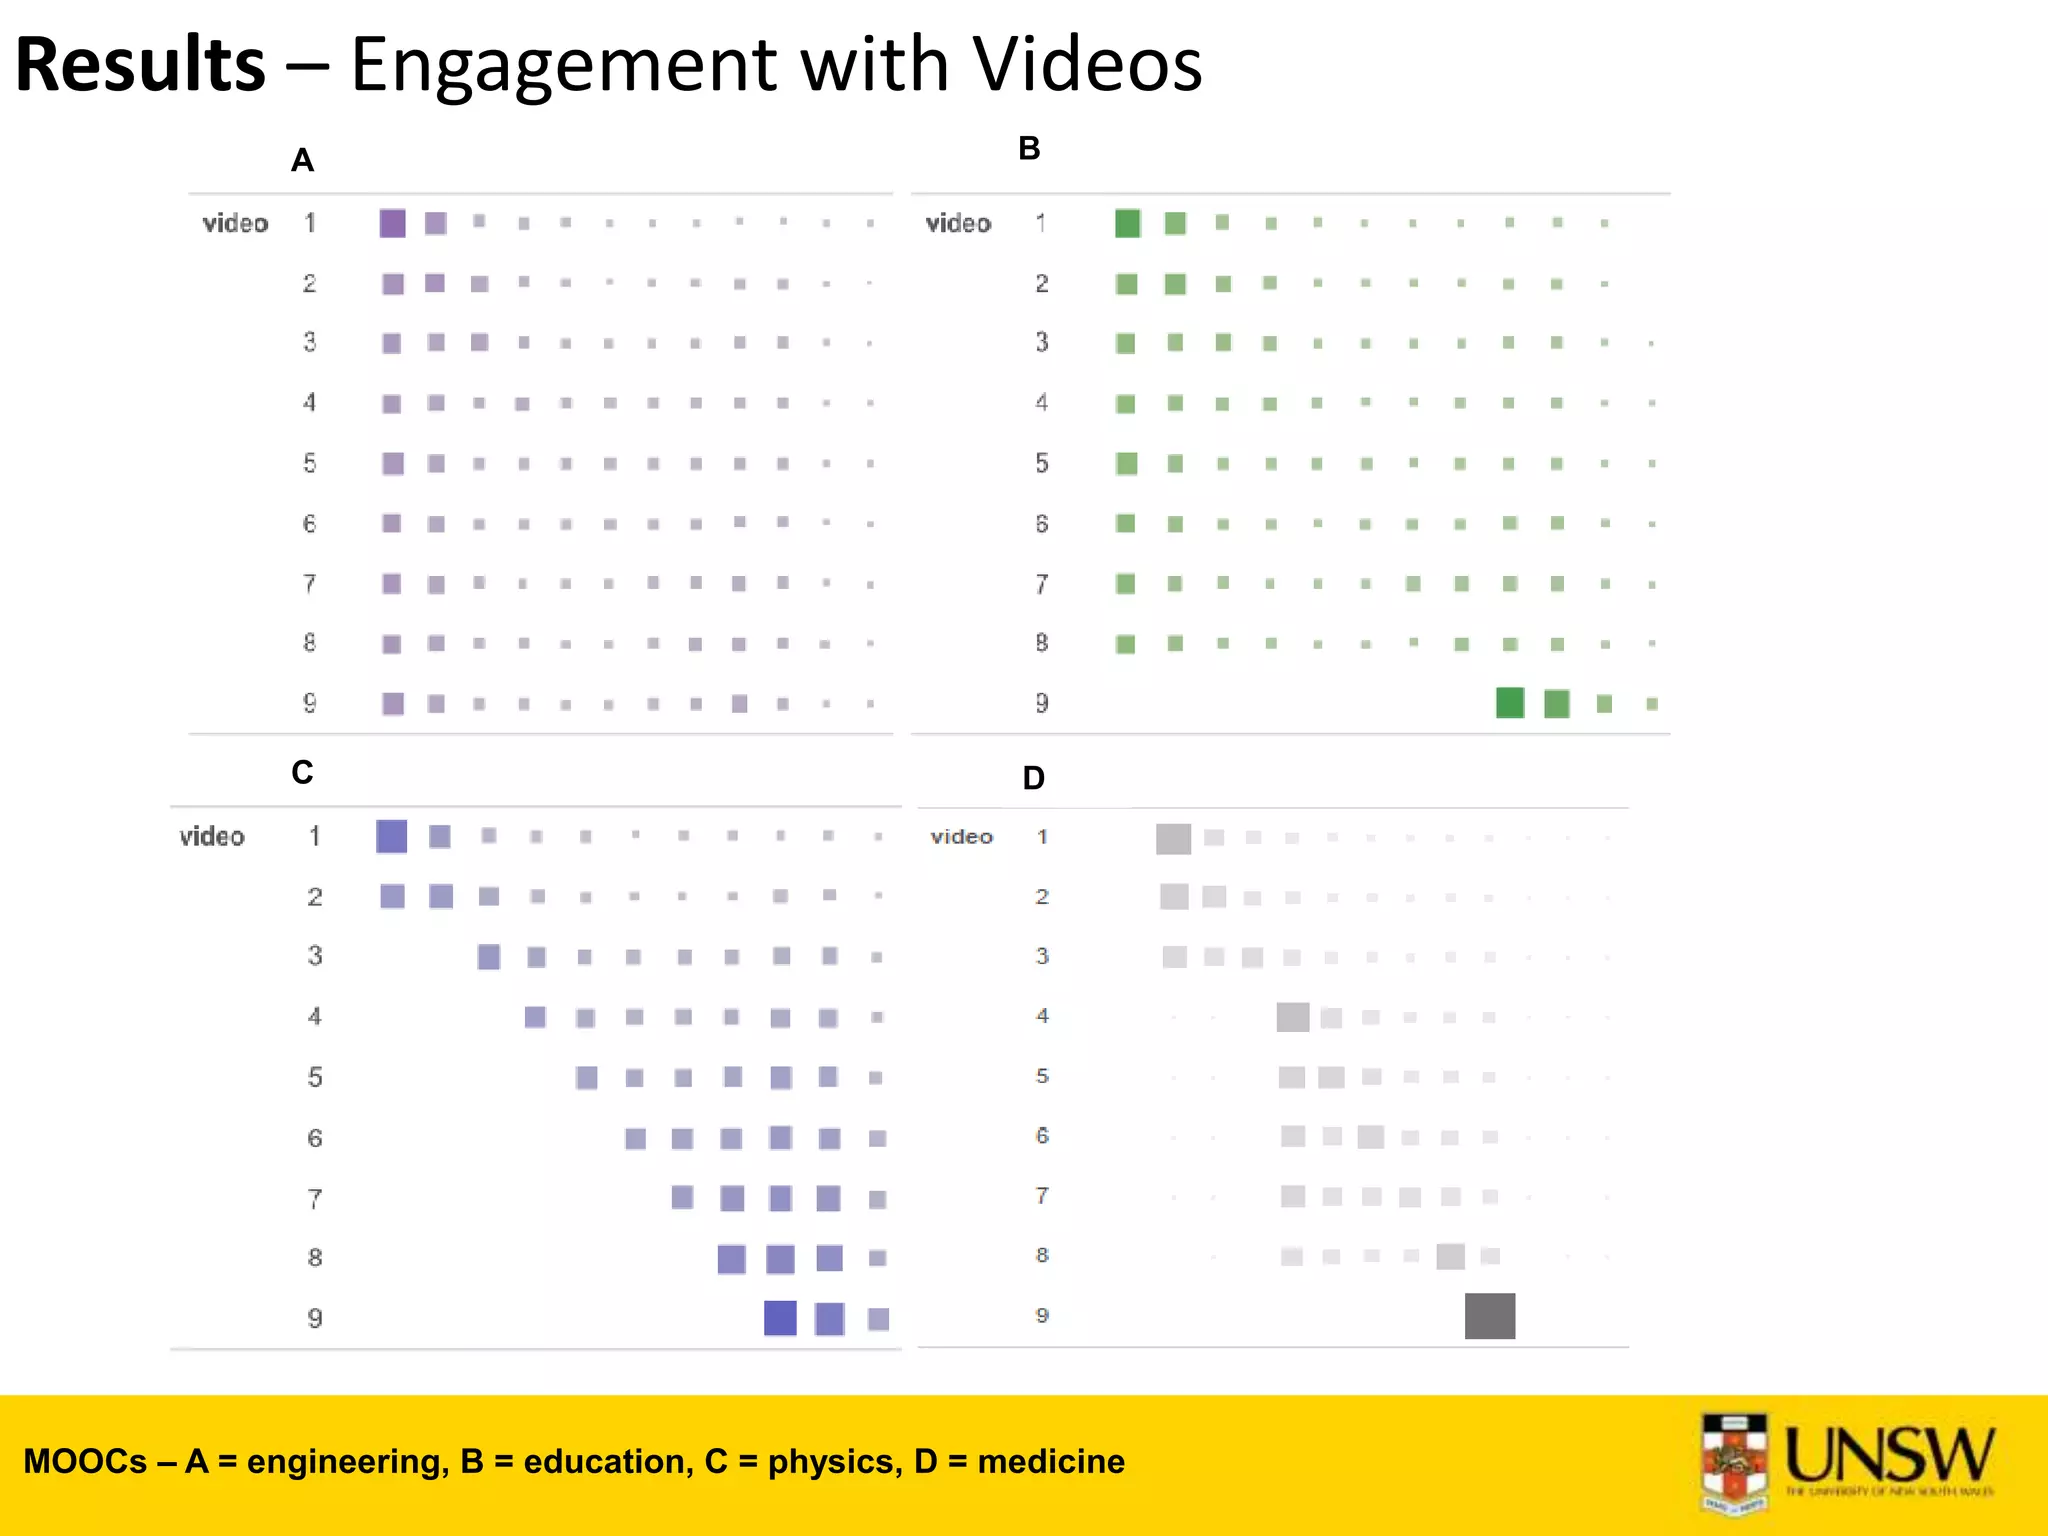
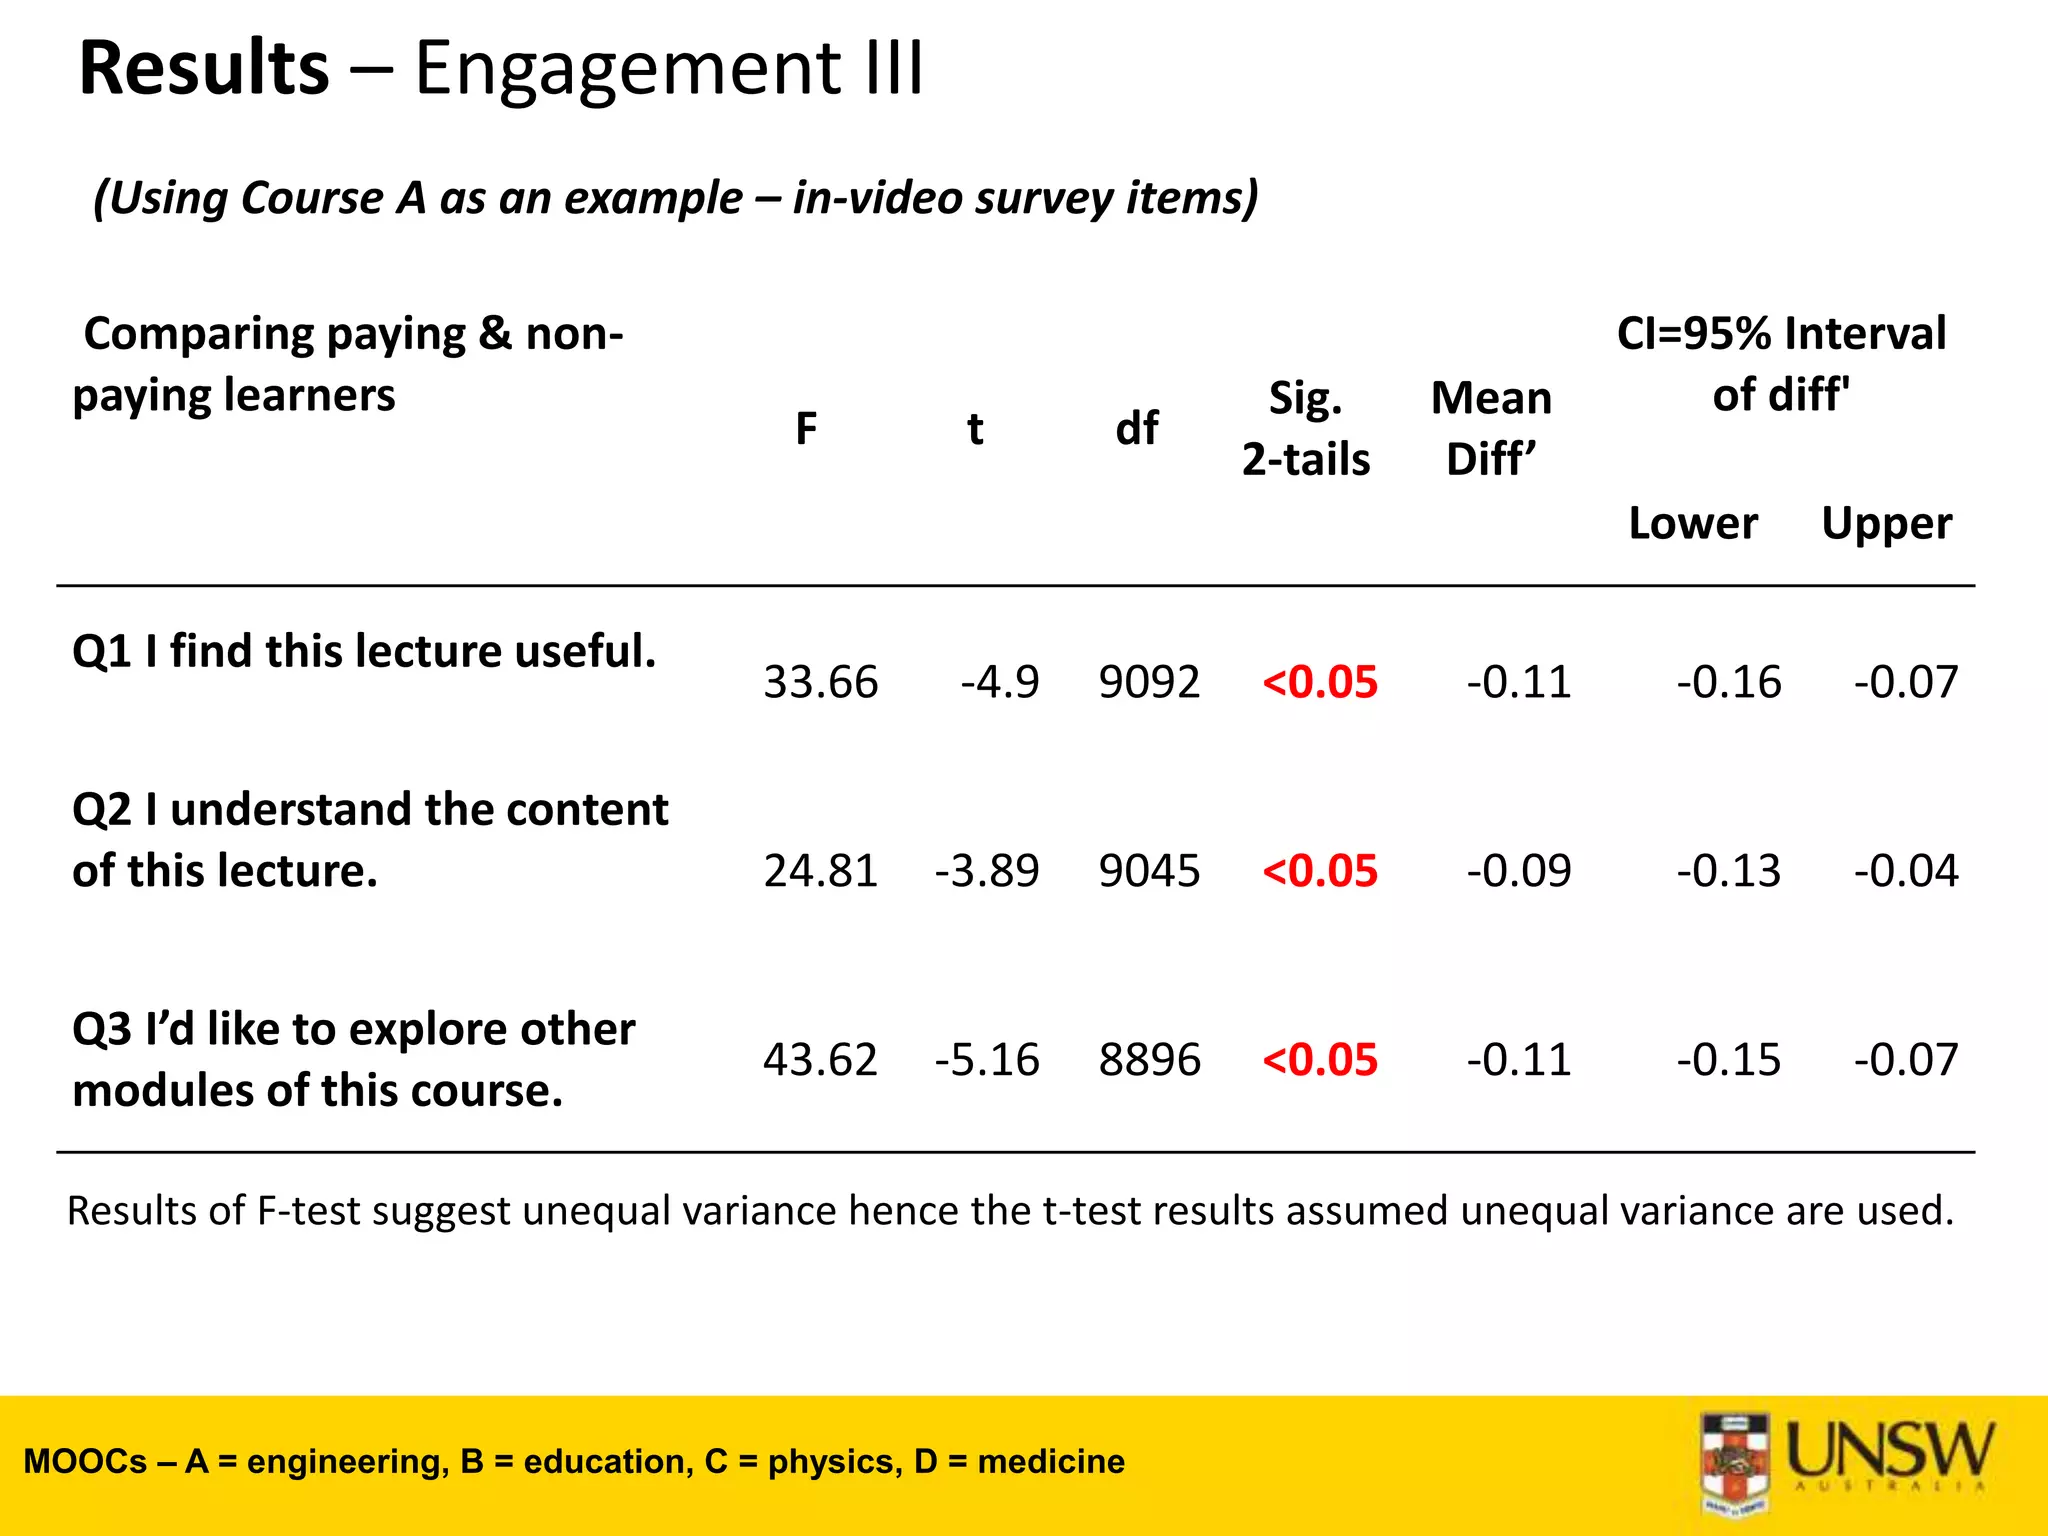

The document discusses surveys conducted to evaluate learners' experiences in MOOCs offered by UNSW Australia. It finds that surveys embedded within course activities, like pre-course surveys, obtain higher response rates than stand-alone surveys. In-video surveys are more effective than those outside videos at capturing engagement. Across four MOOCs, common motivations were personal growth, topic interest, and job relevance. Course B learners primarily aimed to develop teaching strategies. Engagement varied across activities, with videos and forums most used. Paying learners reported higher perceptions of video usefulness than non-paying learners.