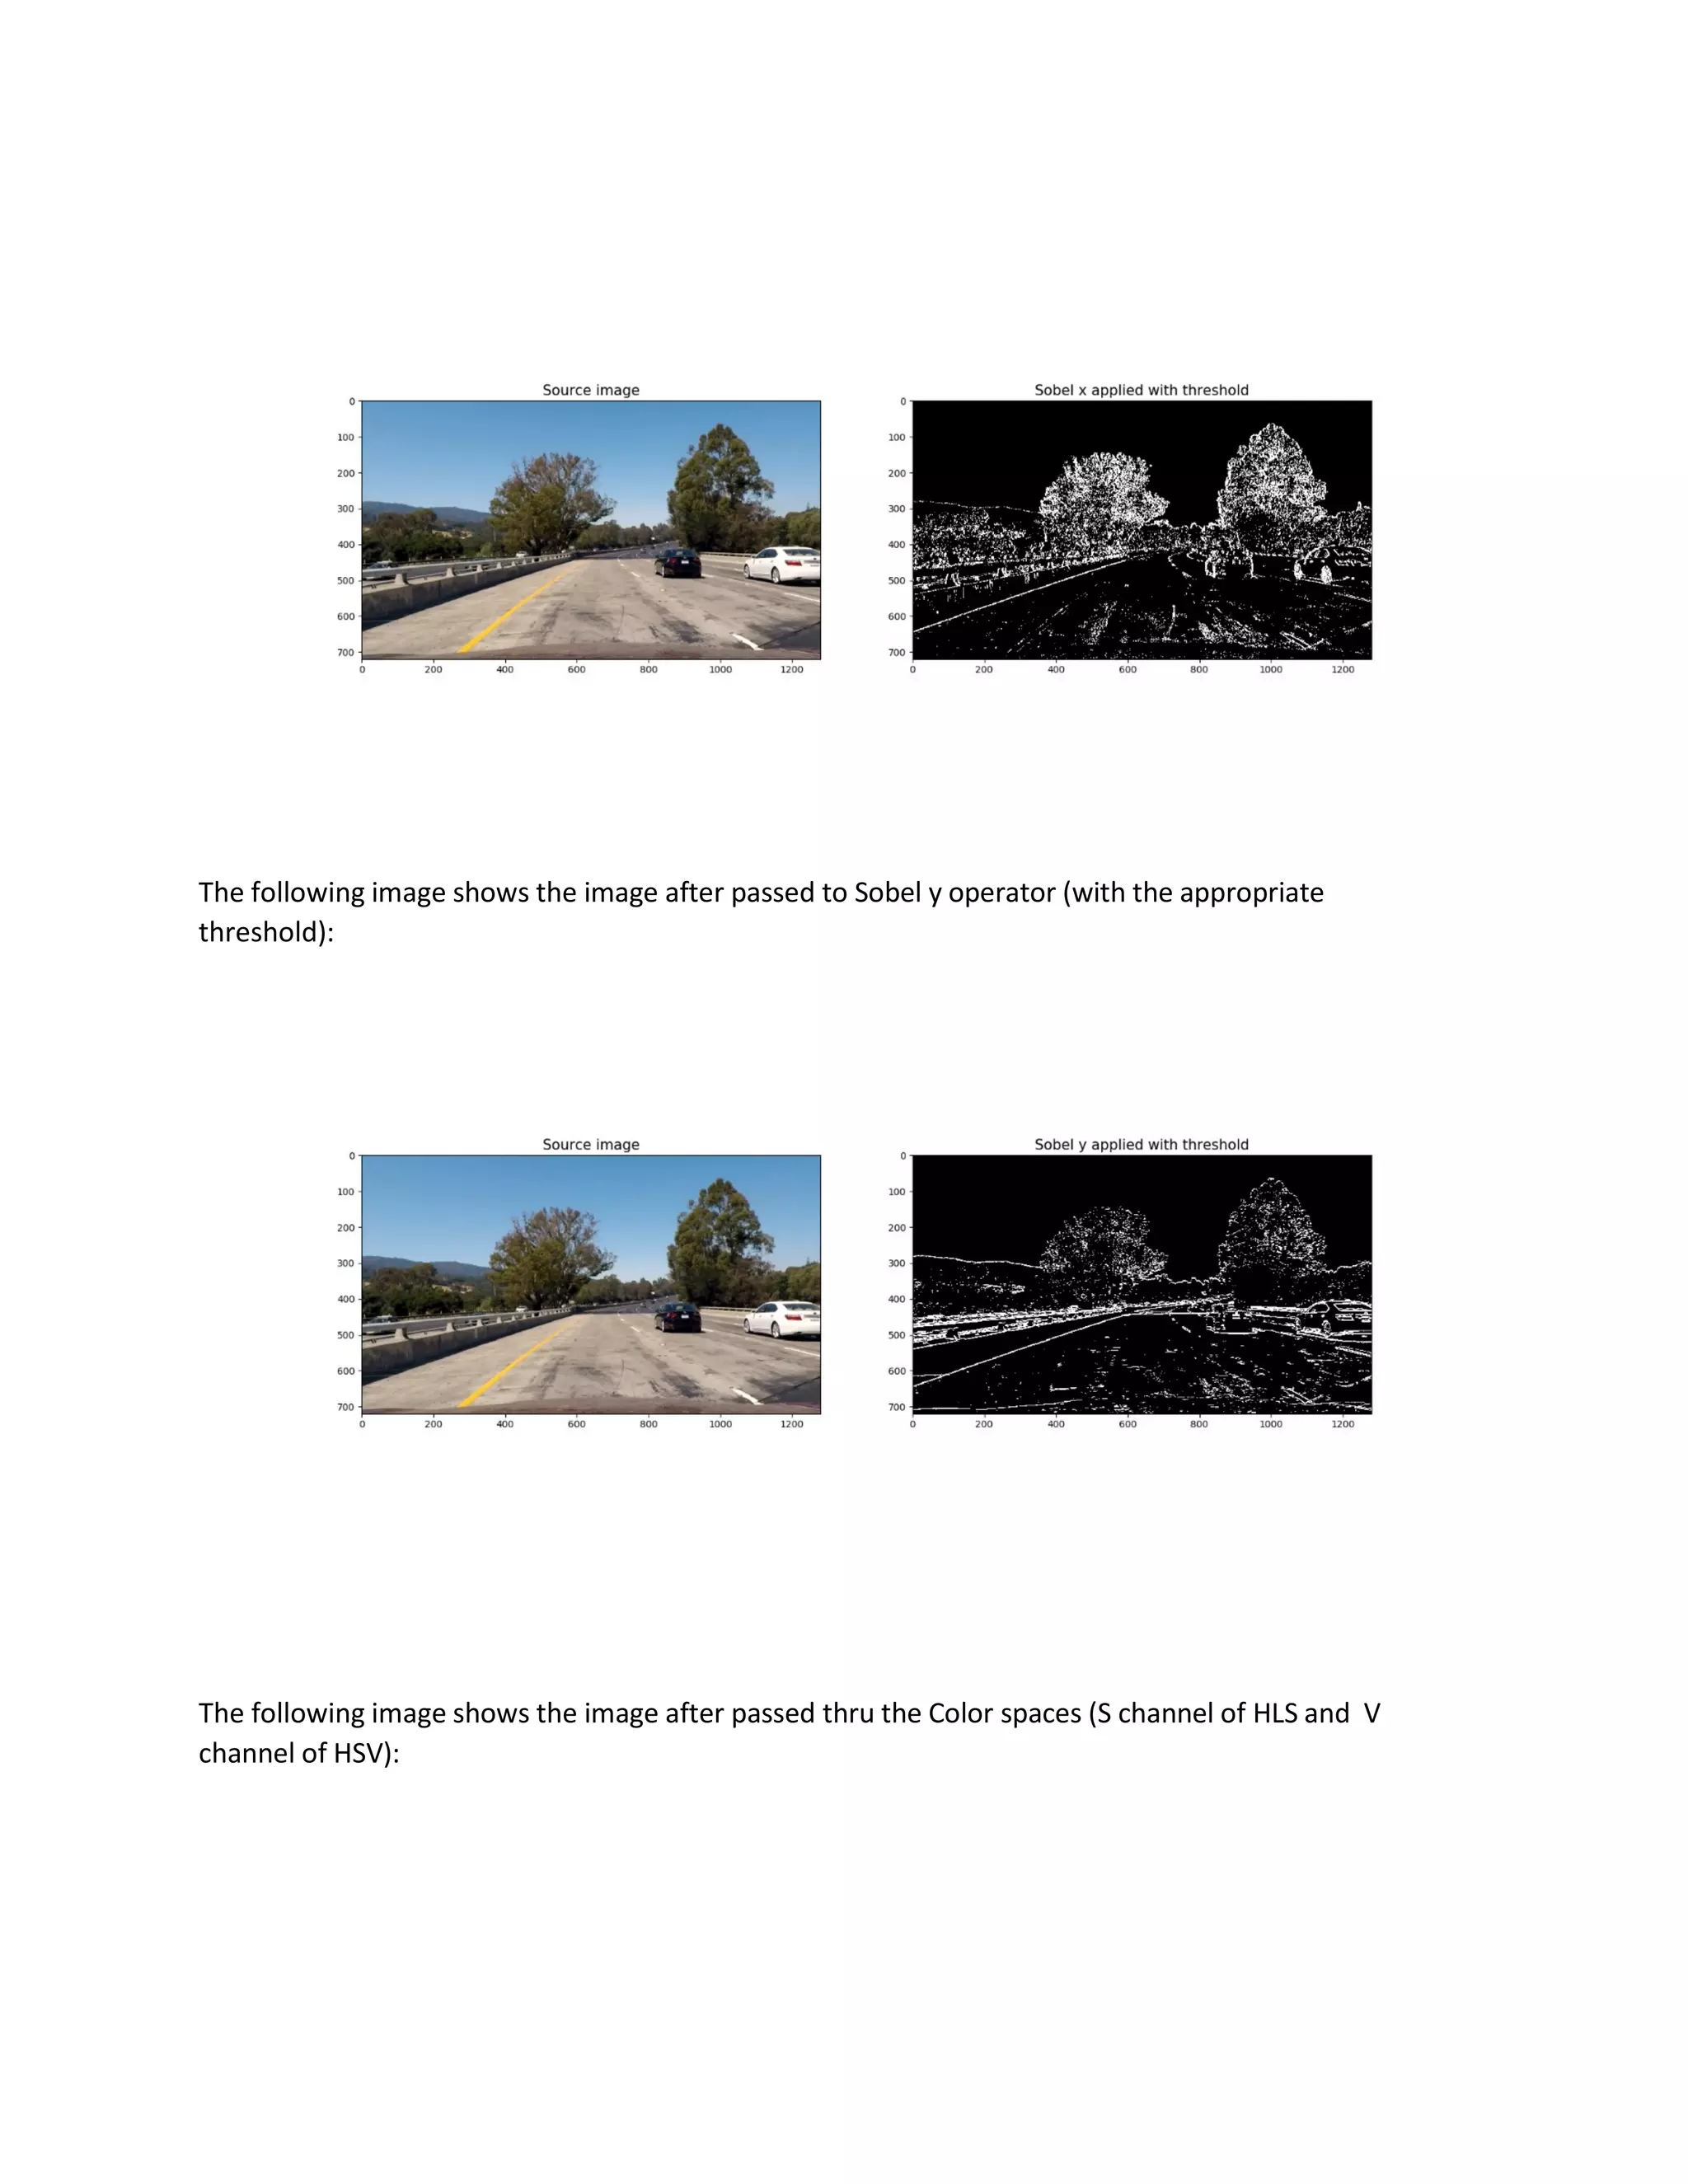
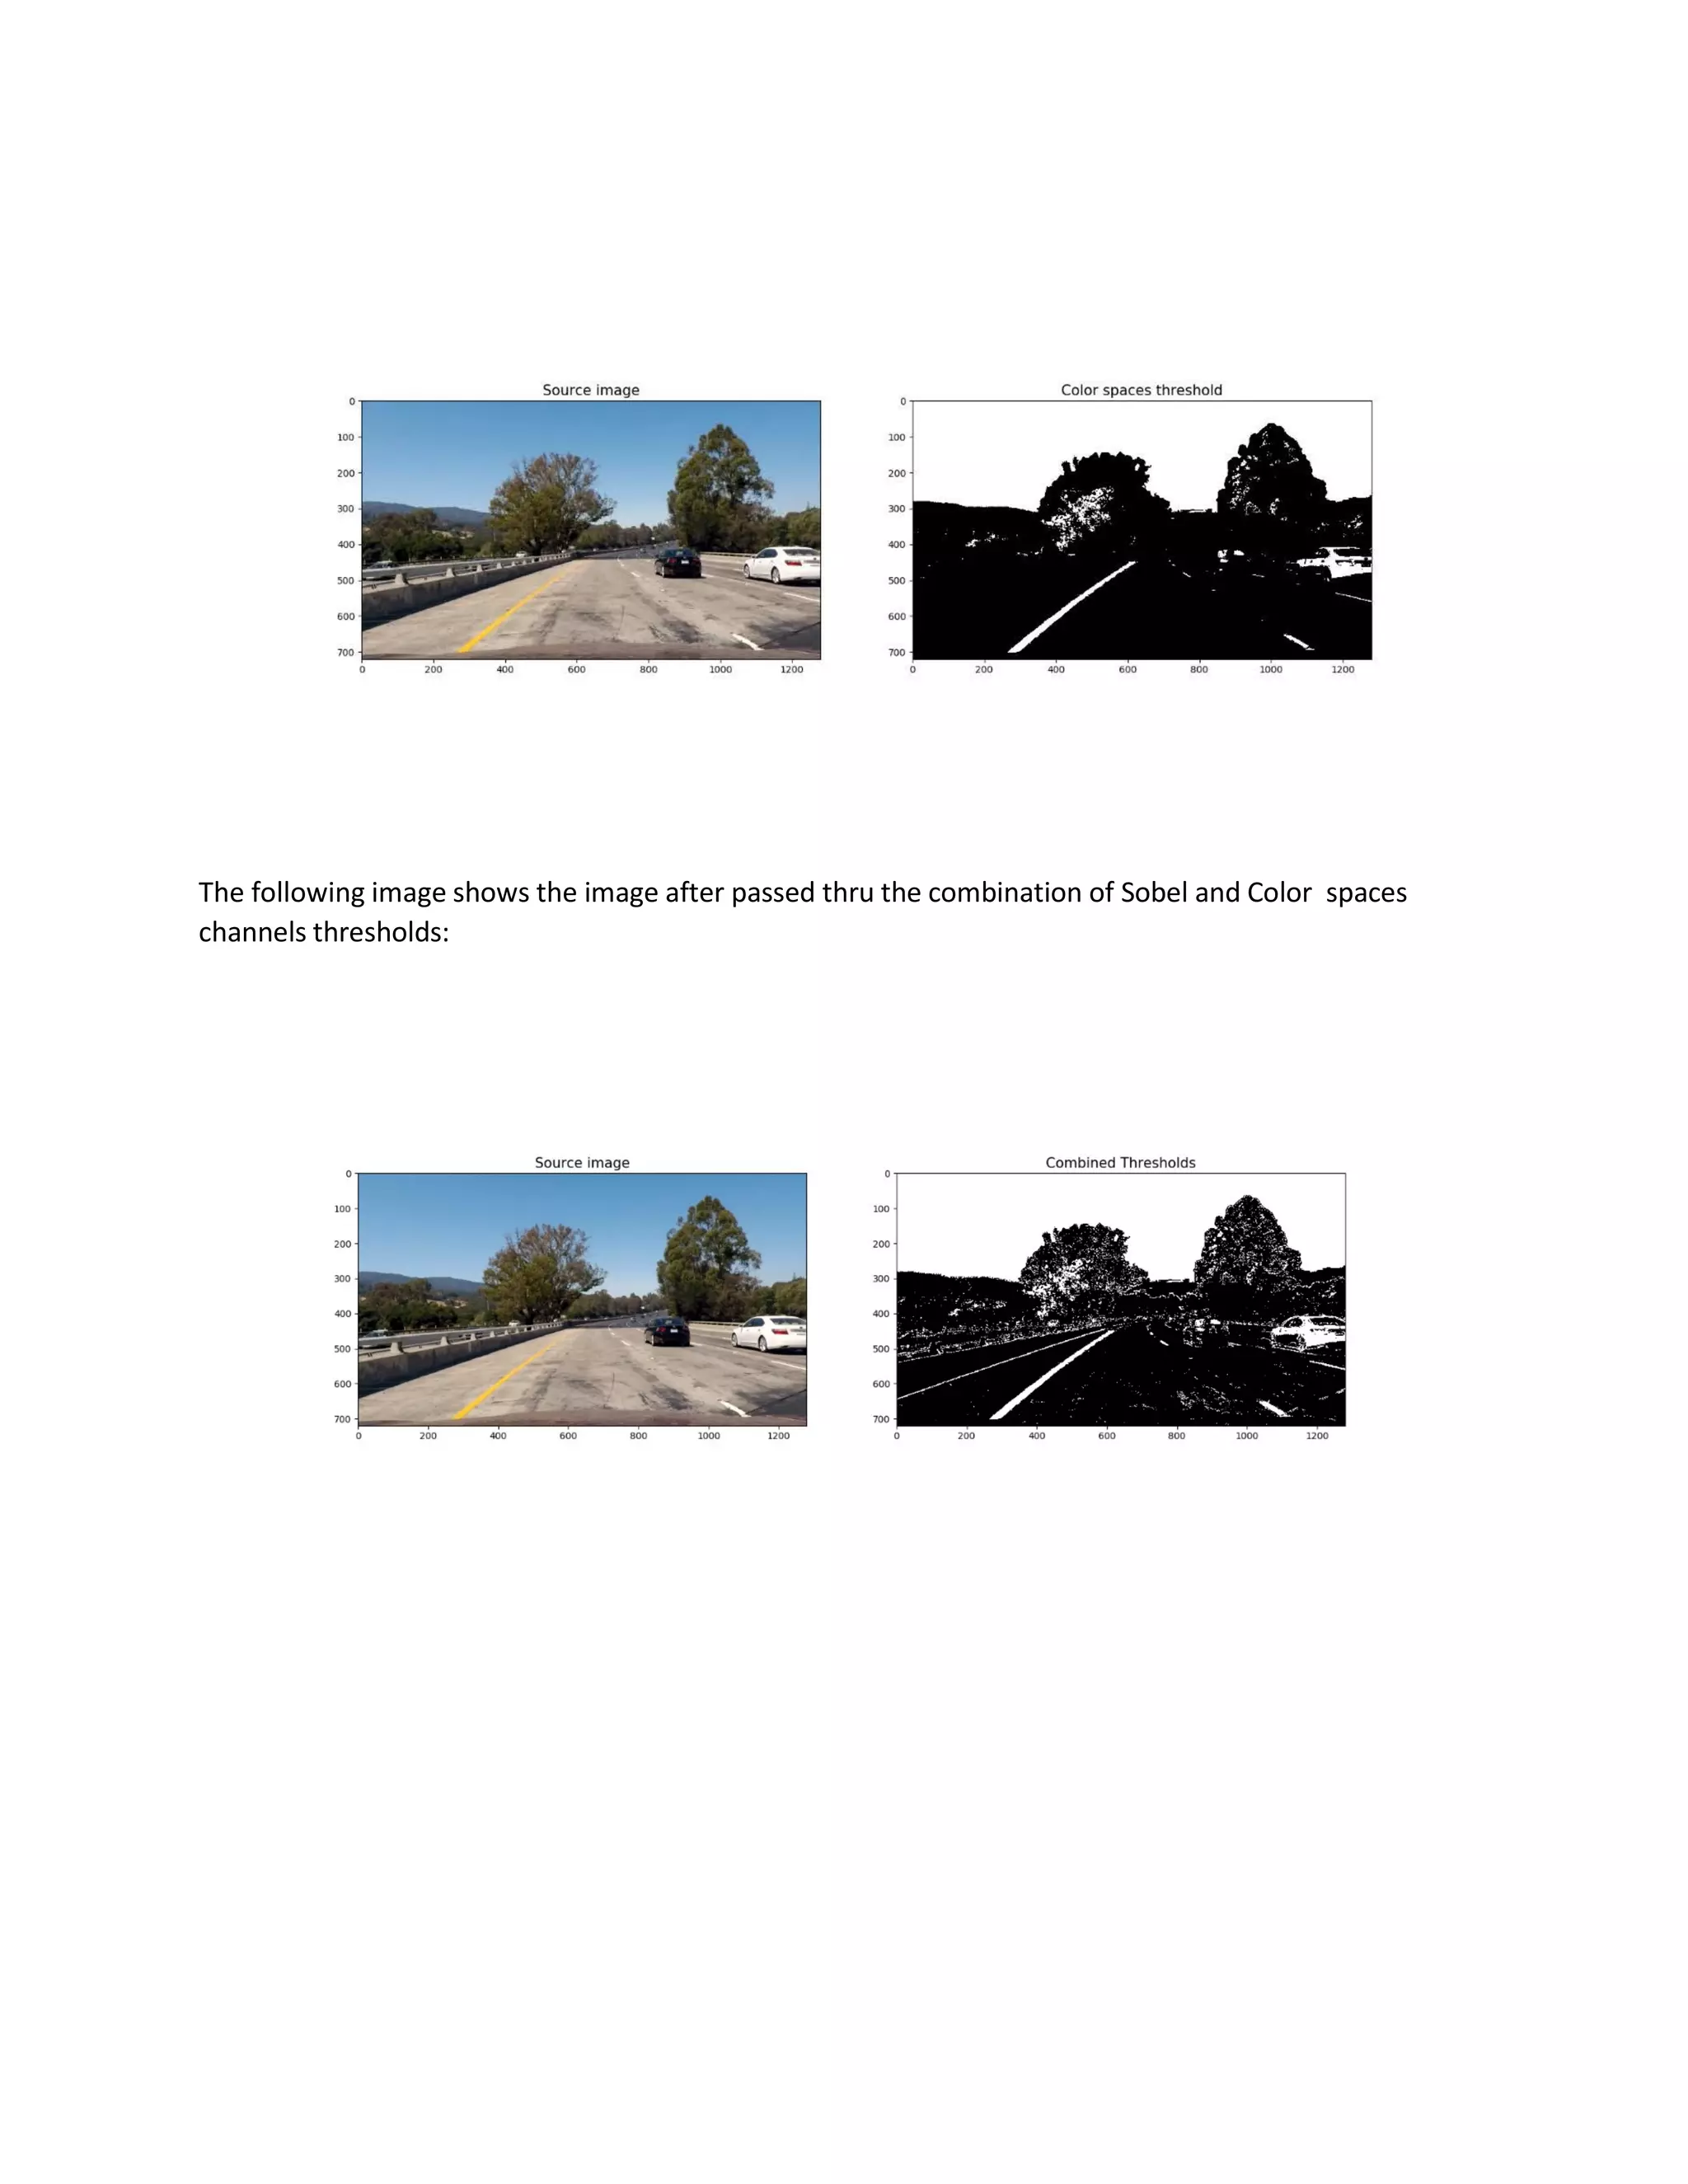
The document describes an Advanced Lane Finding project that uses computer vision techniques to identify lane boundaries in video from a front-facing car camera. The steps include: 1) removing distortion, 2) isolating lanes using color and gradient thresholds, 3) warping the image to a bird's-eye view, 4) fitting curves to the lane pixels, and 5) creating the final output image with lane and radius of curvature information overlaid. Improvement areas include automating parameter selection using machine learning rather than manual tuning.
![Udacity Self Driving Cars Nanodegree- Advanced Lane Finding Project
Objective:
The objective is to write a Python program to identify the lane boundaries in a video from a front-facing
camera on a car. The camera calibration images, test road images, and project videos are provided.
Steps:
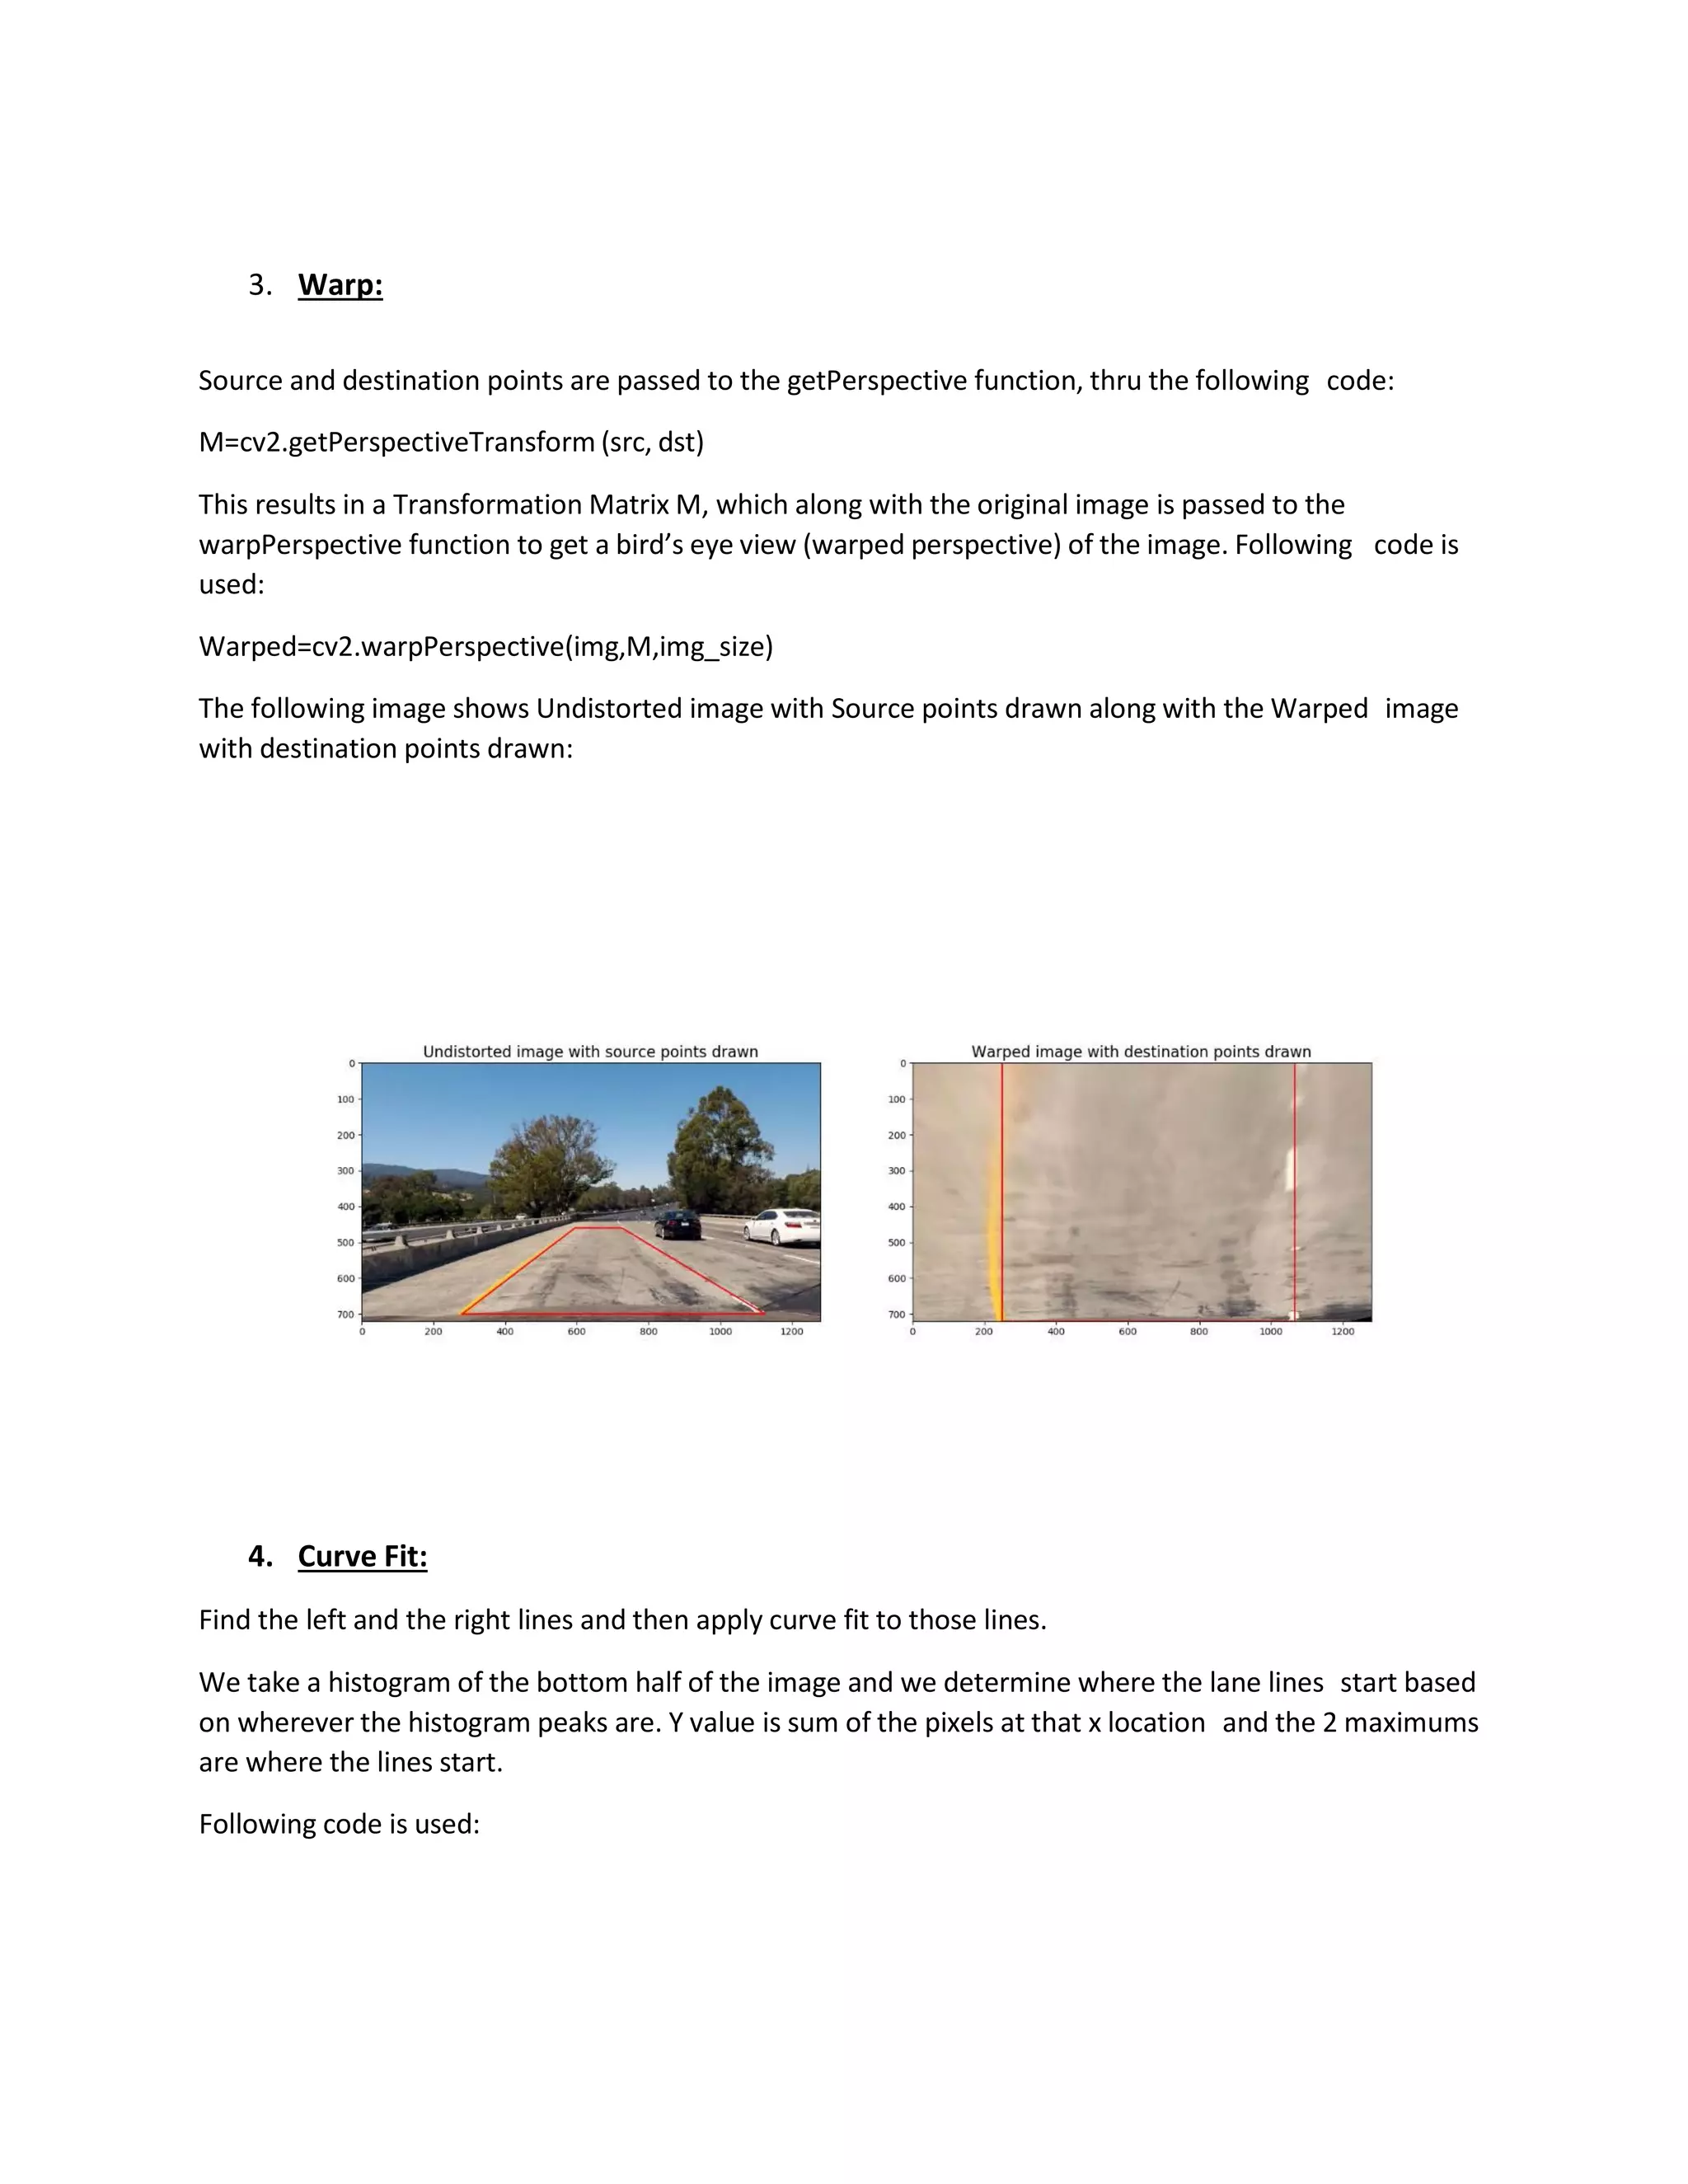
1. Removing Distortion
2. Isolate Lanes
3. Warp
4. Curve Fit
5. Final Image
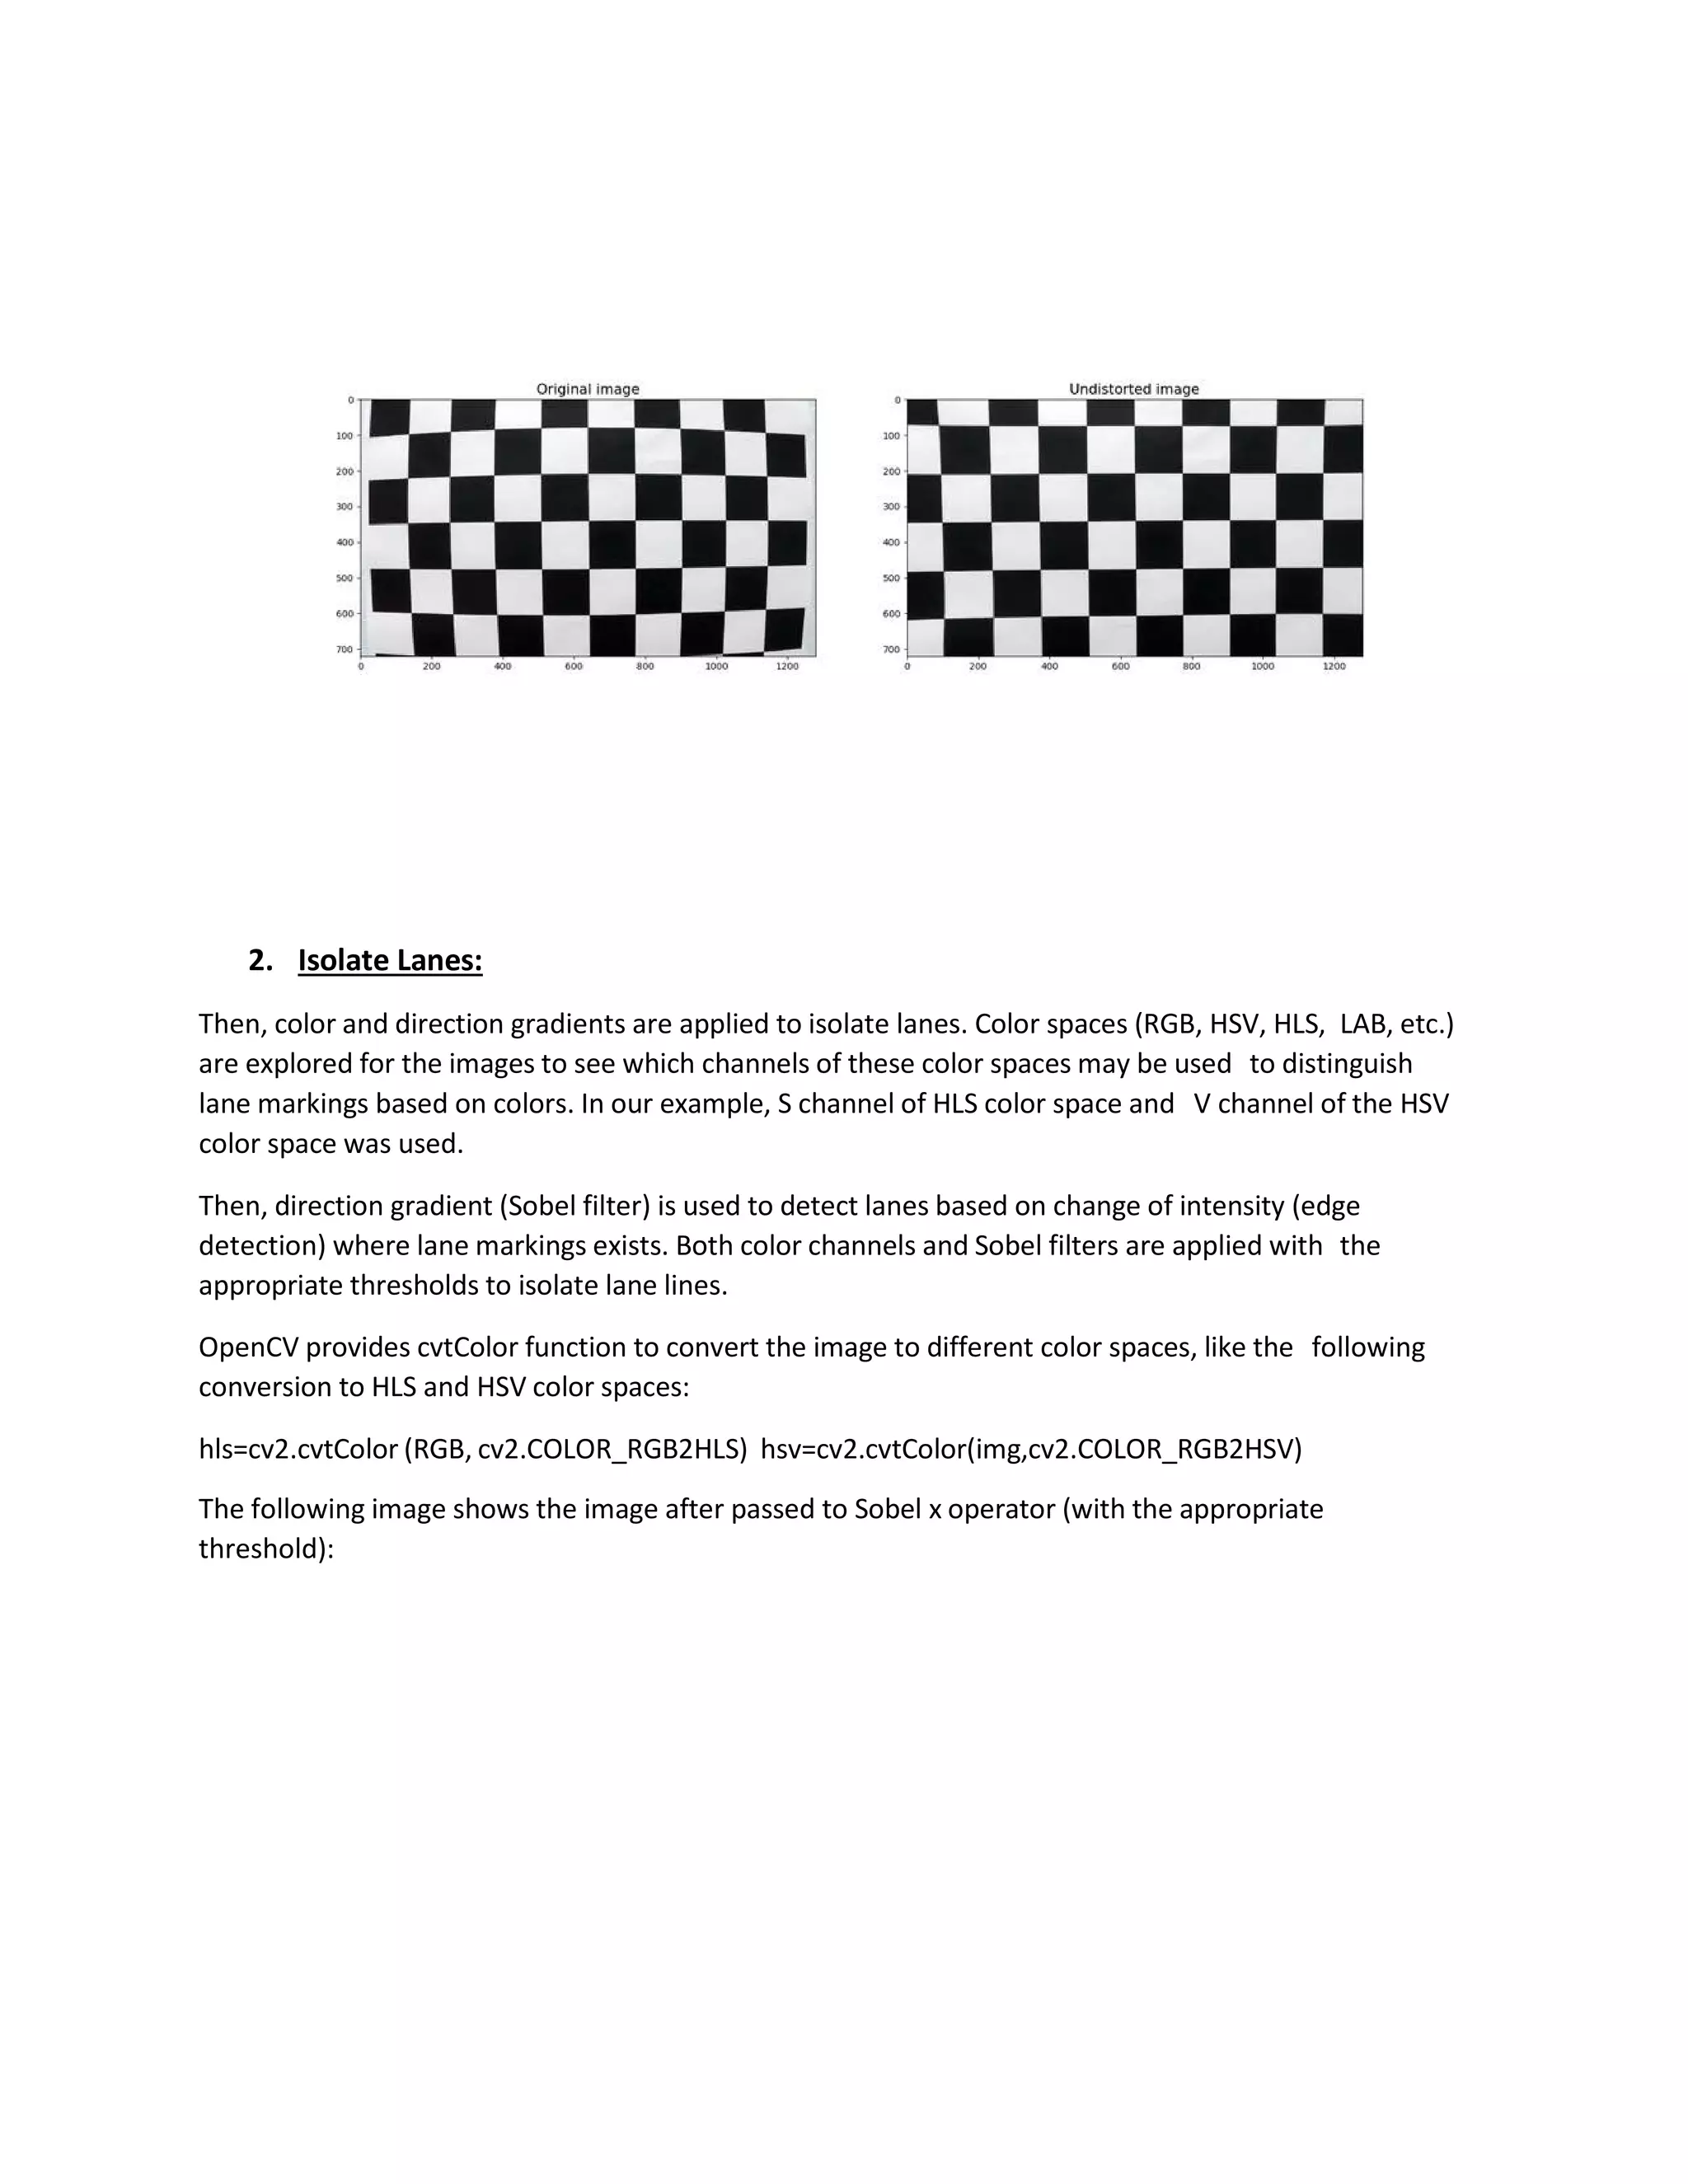
1. Removing distortion:
Cameras use lens which distort image. OpenCV provides function to correct these distortions and to
calibrate the camera.
A set of 20 chess board images were used to calibrate camera.
First, a set of chess board image are passed to findChessboardCorners function to get the corner
points, thru the following code:
Ret, corners=cv2.findChessboardCorners (gray, (9, 6), None)
Then, the corner points discovered are passed to the calibrate Camera function, thru the following
code:
Ret,mtx,dist,rvecs,tvecs=cv2.calibrateCamera(objpoints,imgpoints,gray.shape[::-1],None,None)
This function returns the camera matrix and the distortion coefficients which are then passed to
undistort function to correct the distortion of the images, thru the following code:
undist=cv2.undistort(img,mtx,dist,None,mtx)
The following image shows the Original image and the undistorted image side by side:](https://image.slidesharecdn.com/writeupadvancedlanelinesproject-200127192214/75/Writeup-advanced-lane_lines_project-1-2048.jpg)
![Histogram=np.sum(img[img.shape[0]//2:,:],axis=0]
Leftx_base=np.argmax(histogram[:midpoint])
Rightx_base=np.argmax(histogram[midpoint:]+midpoint Following
image shows histogram output:
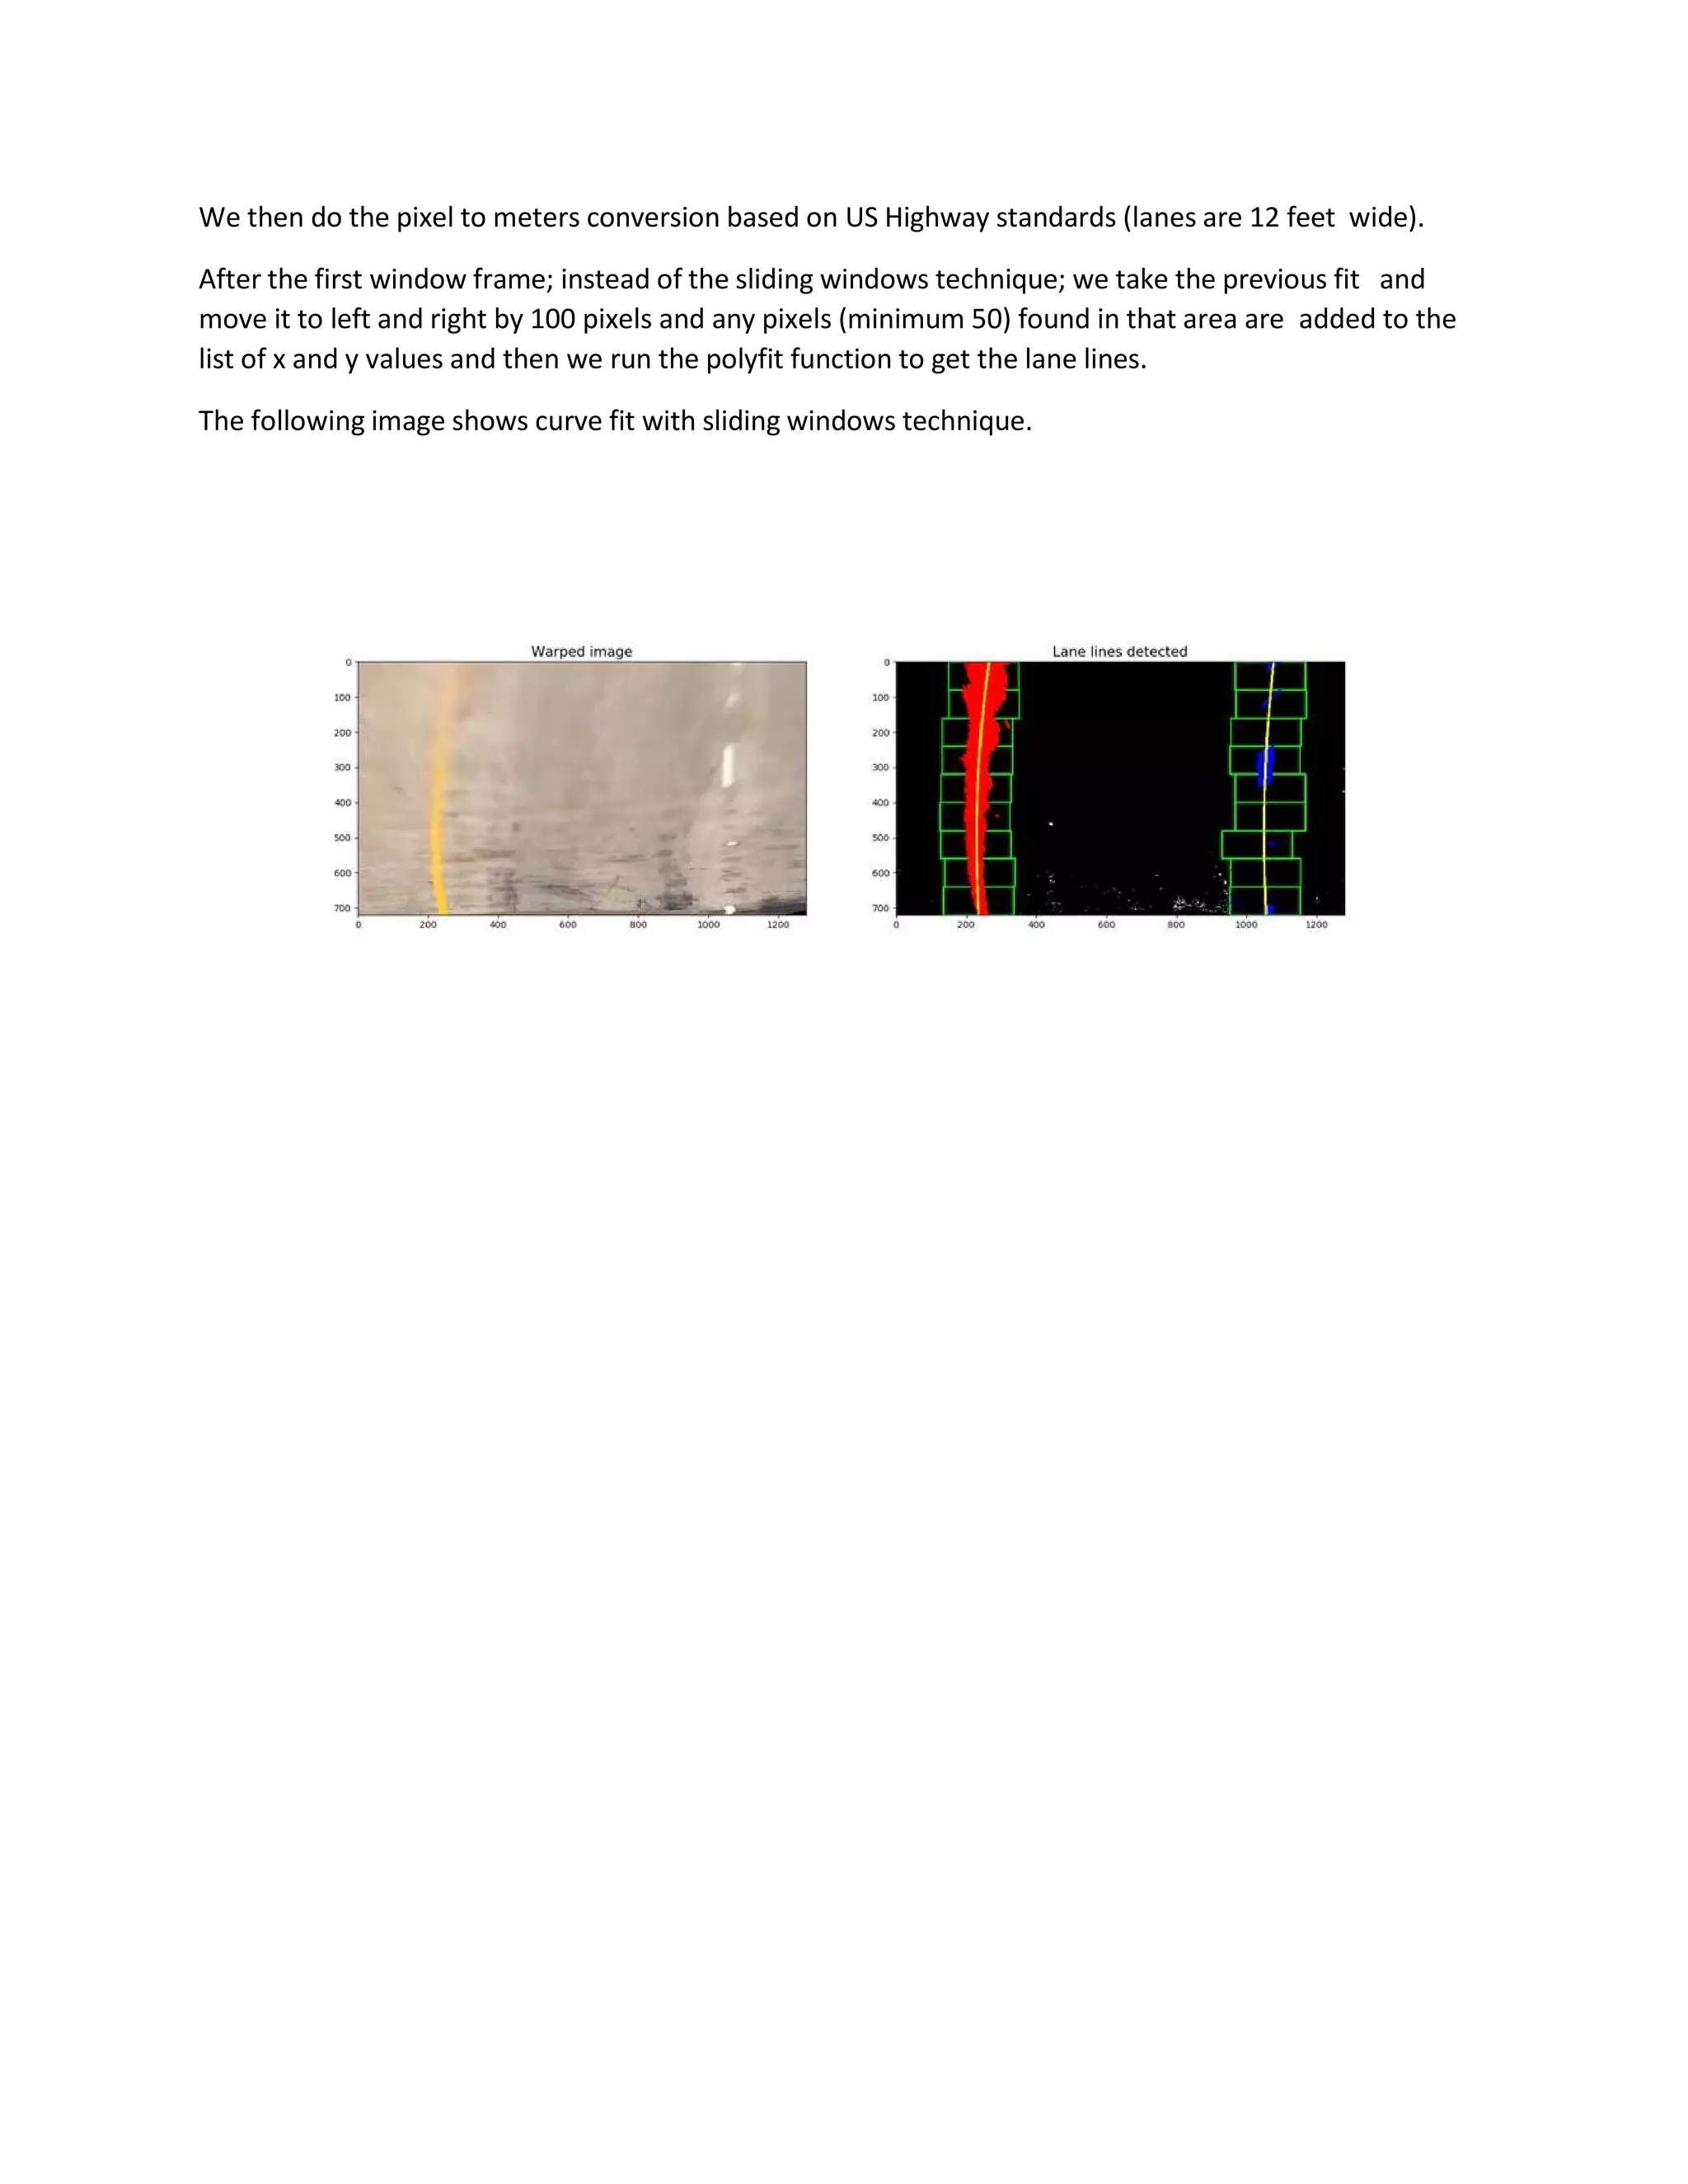
Then, we use a sliding windows technique described as follows: we draw a box around the lane starting
points and any of the white pixels from the binary image that fall into that box; we put them in a list of
x and y values. Then, we add a box on top of that and do the same thing and as we move up the lane
line; we will move the boxes to the left or right based on the average of the previous line. At the end of
this; we will have lists of x and y values of the pixels that are in the line and then we run the 2nd order
numpy polyfit to those pixels to get the curve fit in the pixel space. Following code is used:
Left_fit=np.polyfit(lefty,leftx,2) Right_fit=np.polyfit(righty,rightx,2)](https://image.slidesharecdn.com/writeupadvancedlanelinesproject-200127192214/75/Writeup-advanced-lane_lines_project-6-2048.jpg)
![The following image shows curve fit where the program looks for the next lane point within 100 pixels of
the previous fit.
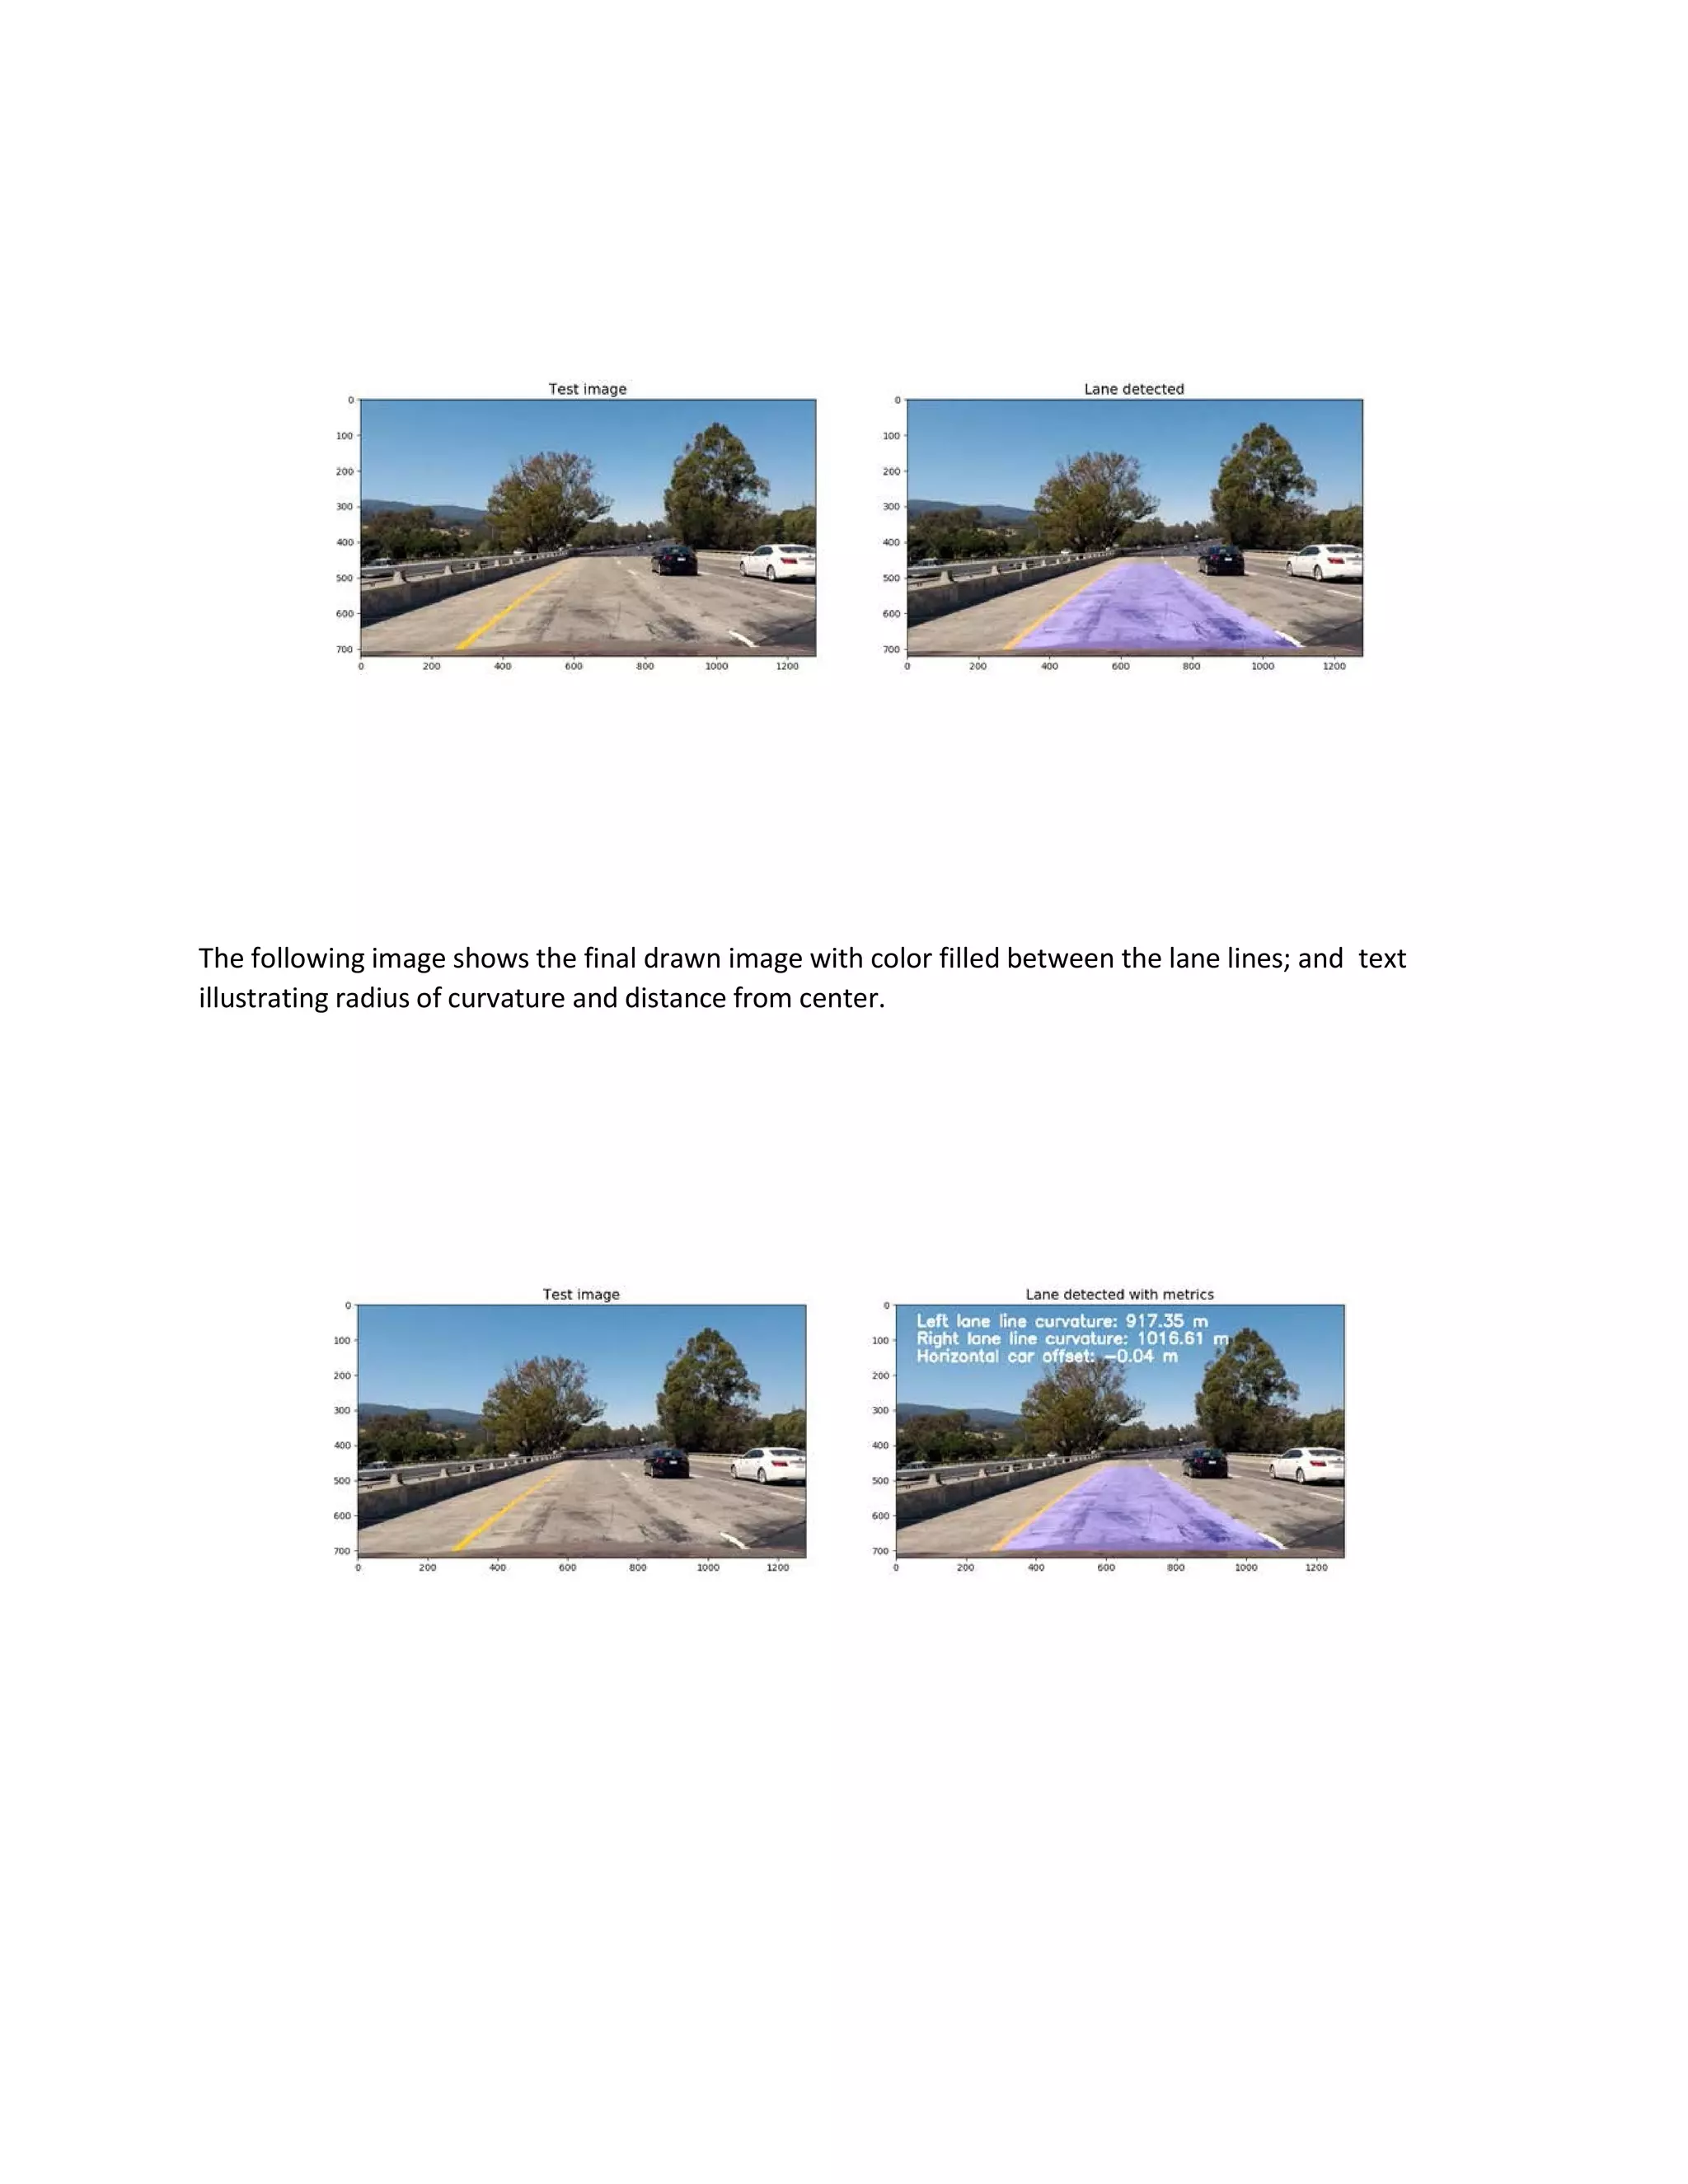
5. Final Image:
Then, we create the final image and put text (using putText function) on the image for the Radius of
curvature and the Distance to lane center; which are calculated using the following formulae:
Radius of curvature=([1+(dy/dx)^2]^3/2)/(d^2y/dx^2)
laneCenter=(rigthPos-leftPos)/2+leftPOs
distancetoCenter=laneCenter-imageCenter
Then, we plot the curve fits and green color the drive area onto the image using fillPoly and polylines
function as shown below:
Cv2.fillPoly(color_warp,np.int_([pts]),(0,255,0))
We want to overlay on the original image and not the warped image. So we need to unwarp the image
(using undistort function reversing the source and destination points) and then add to the original
(using addWeighted function) as below.
Result=cv2.addWeighted(img,1,newwarp,0.5,0)
The following image shows the final drawn image with color filled between the lane lines.](https://image.slidesharecdn.com/writeupadvancedlanelinesproject-200127192214/75/Writeup-advanced-lane_lines_project-8-2048.jpg)