
Download as PDF, PPTX
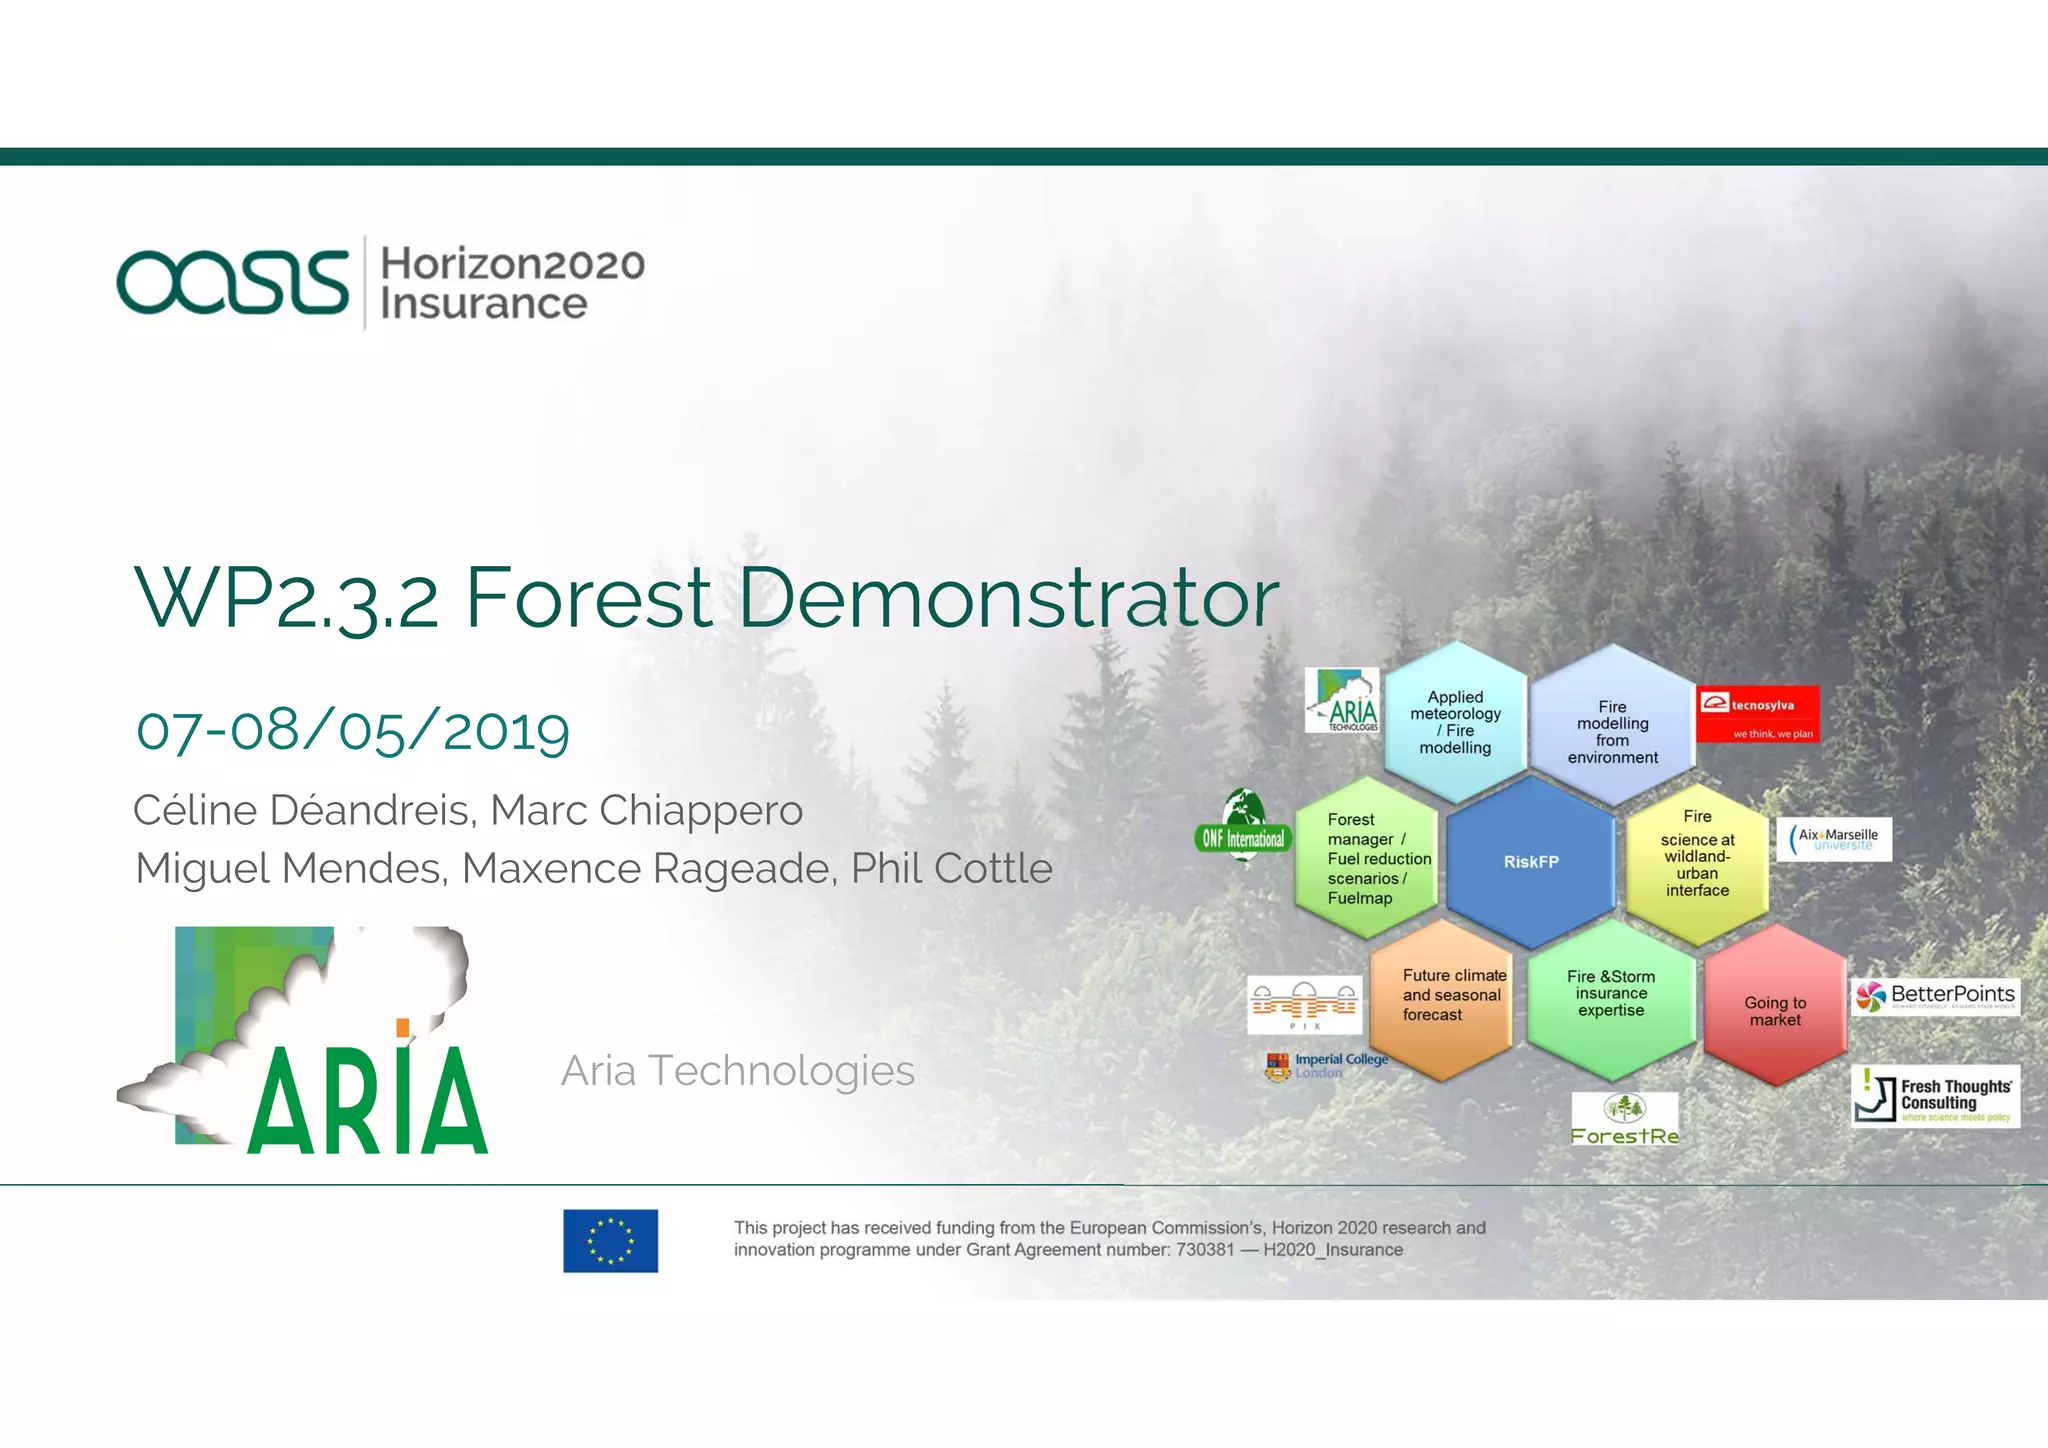
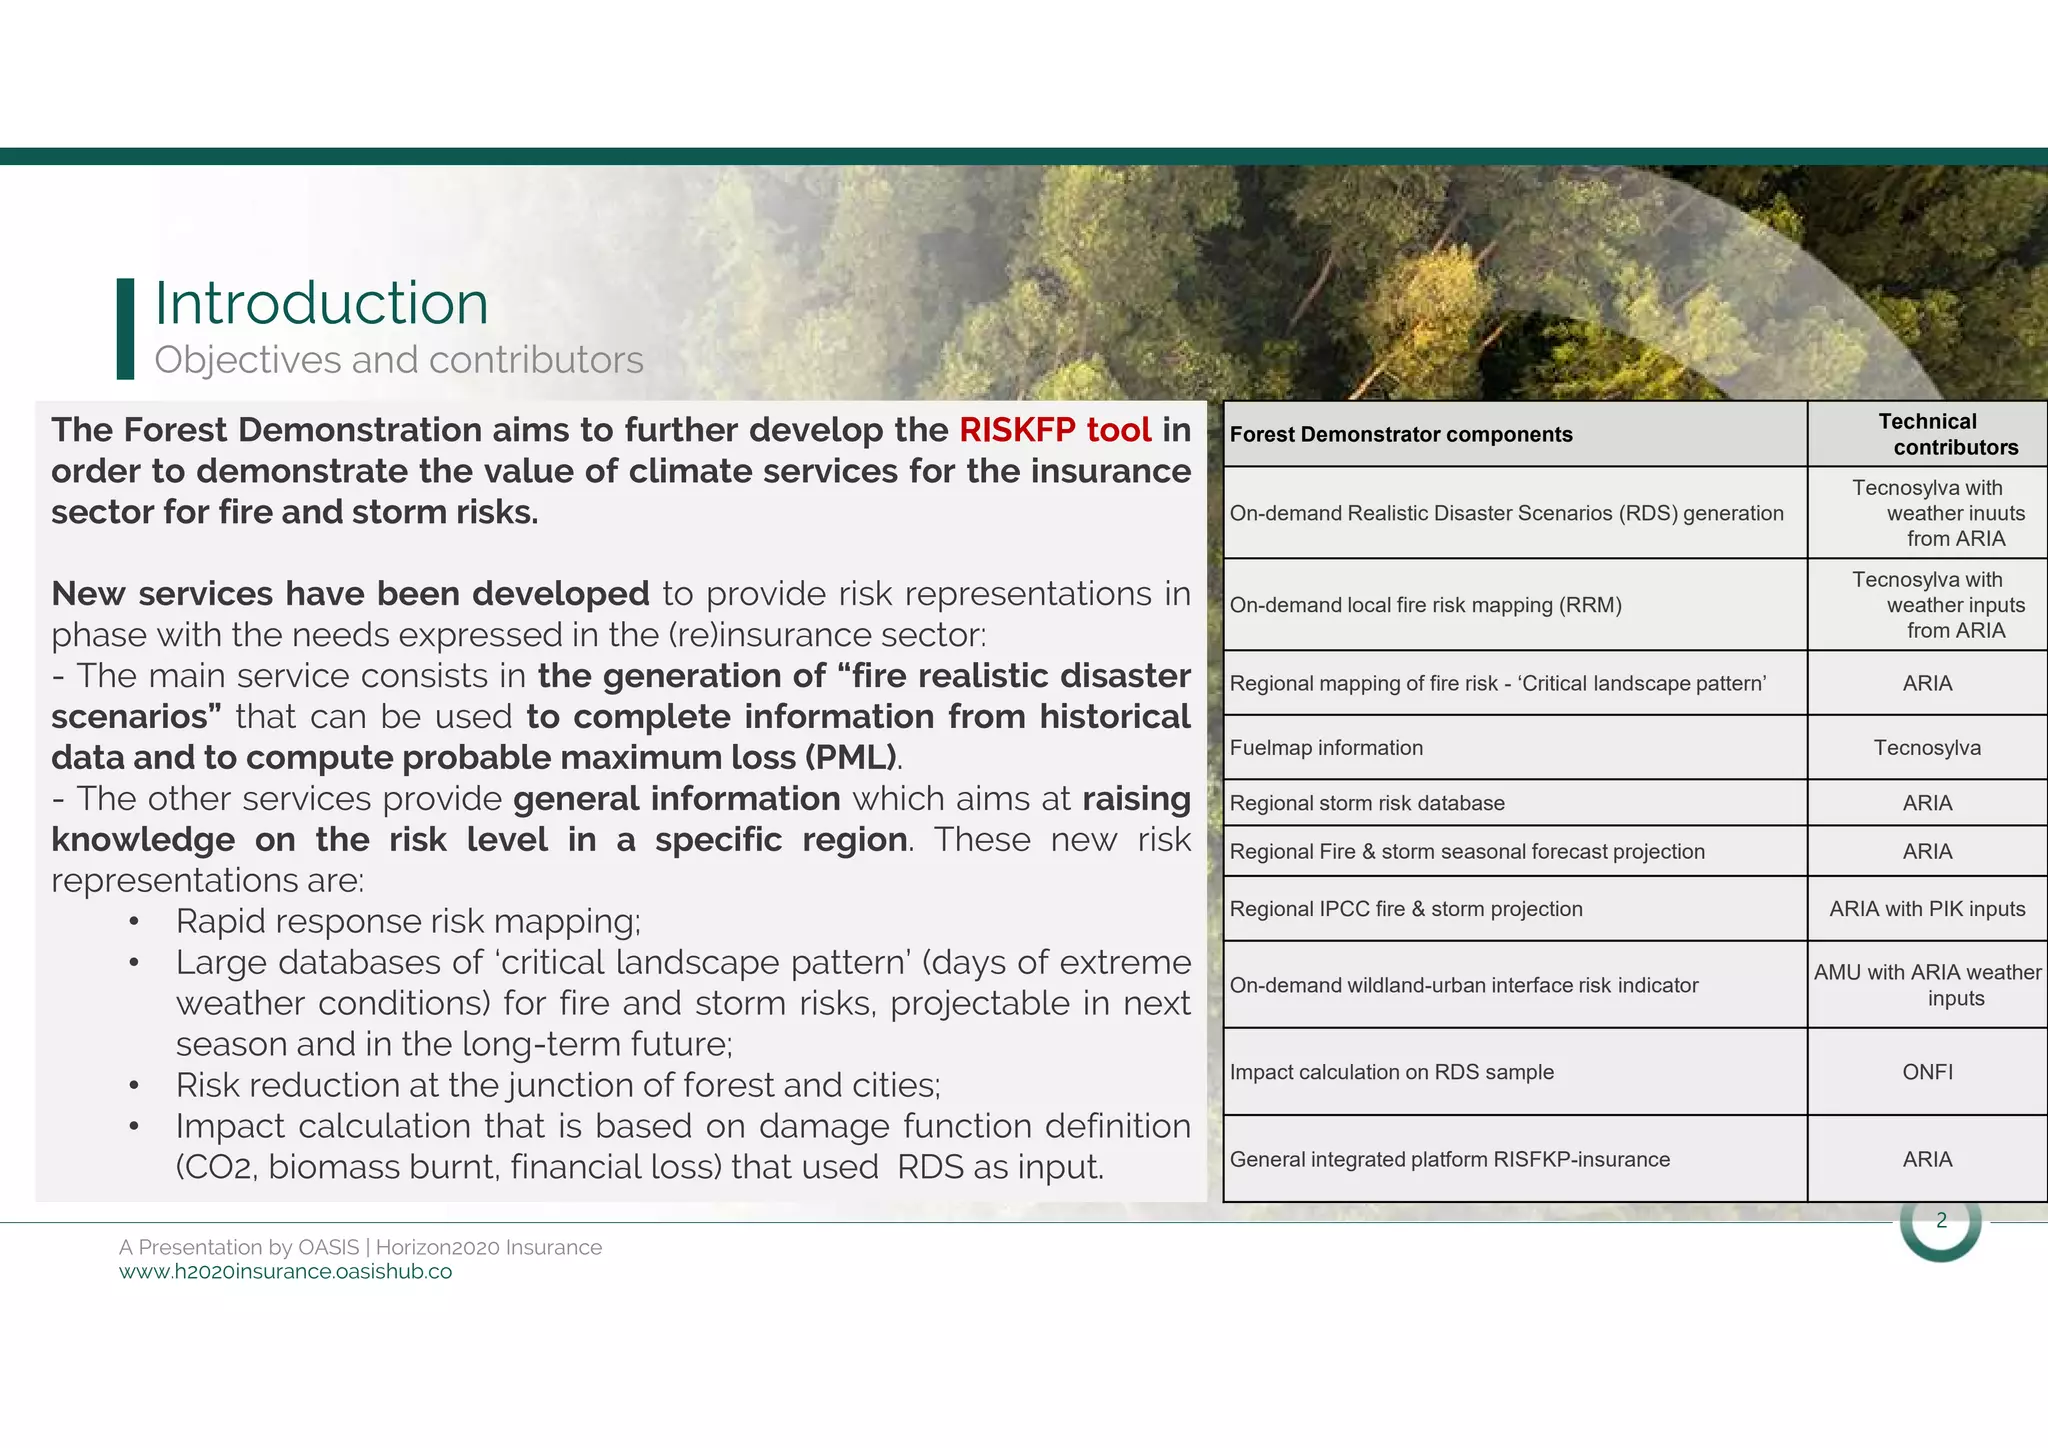
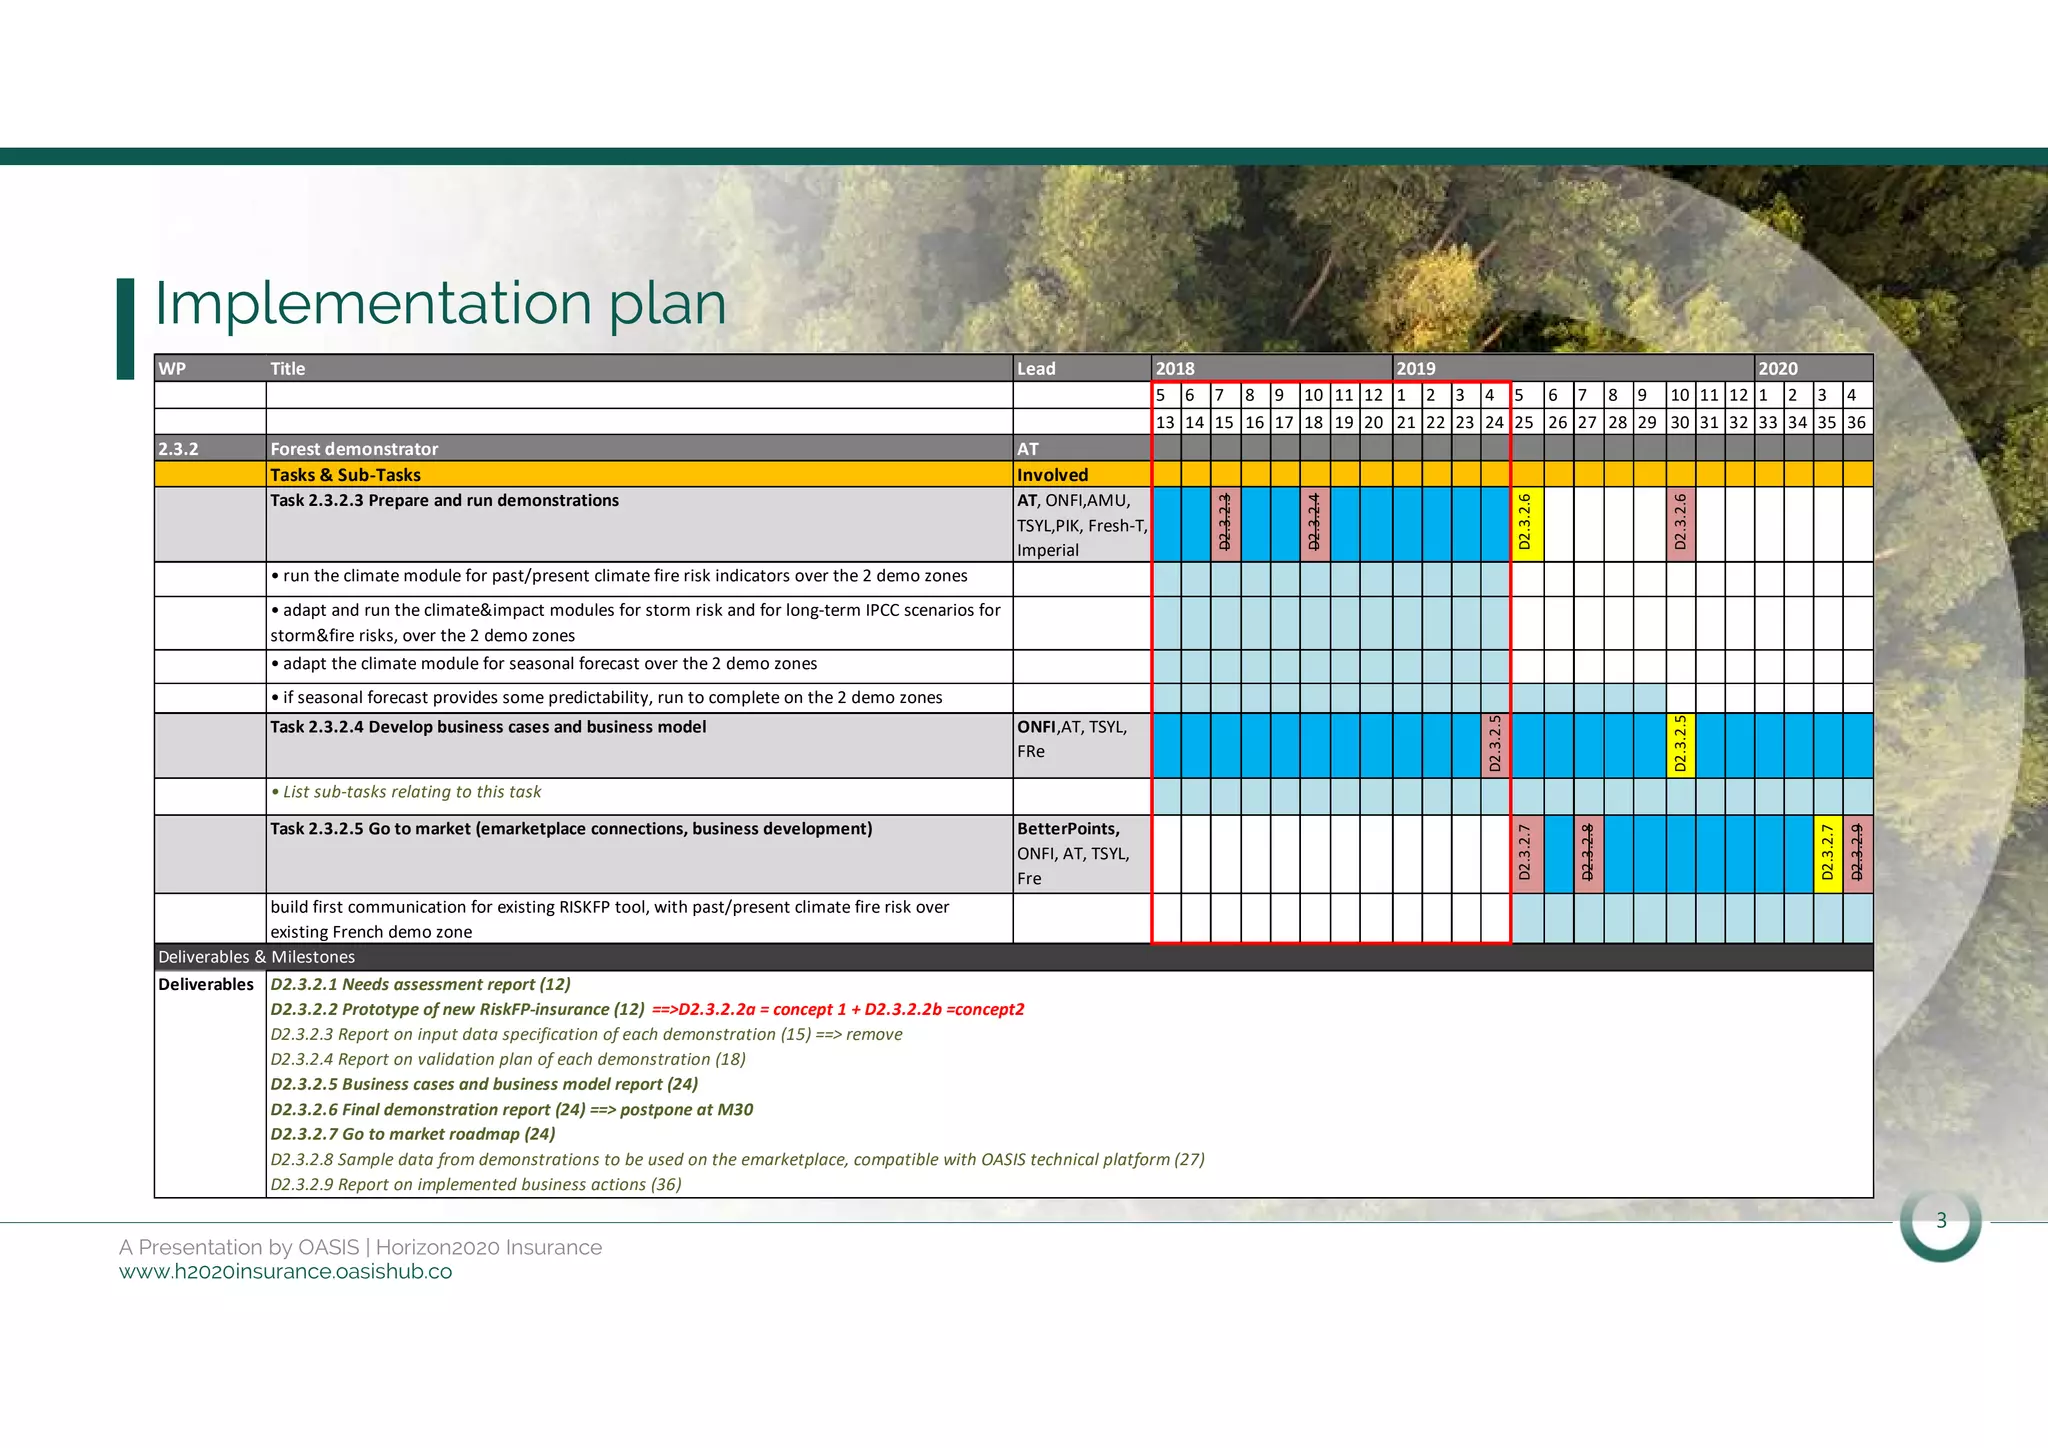
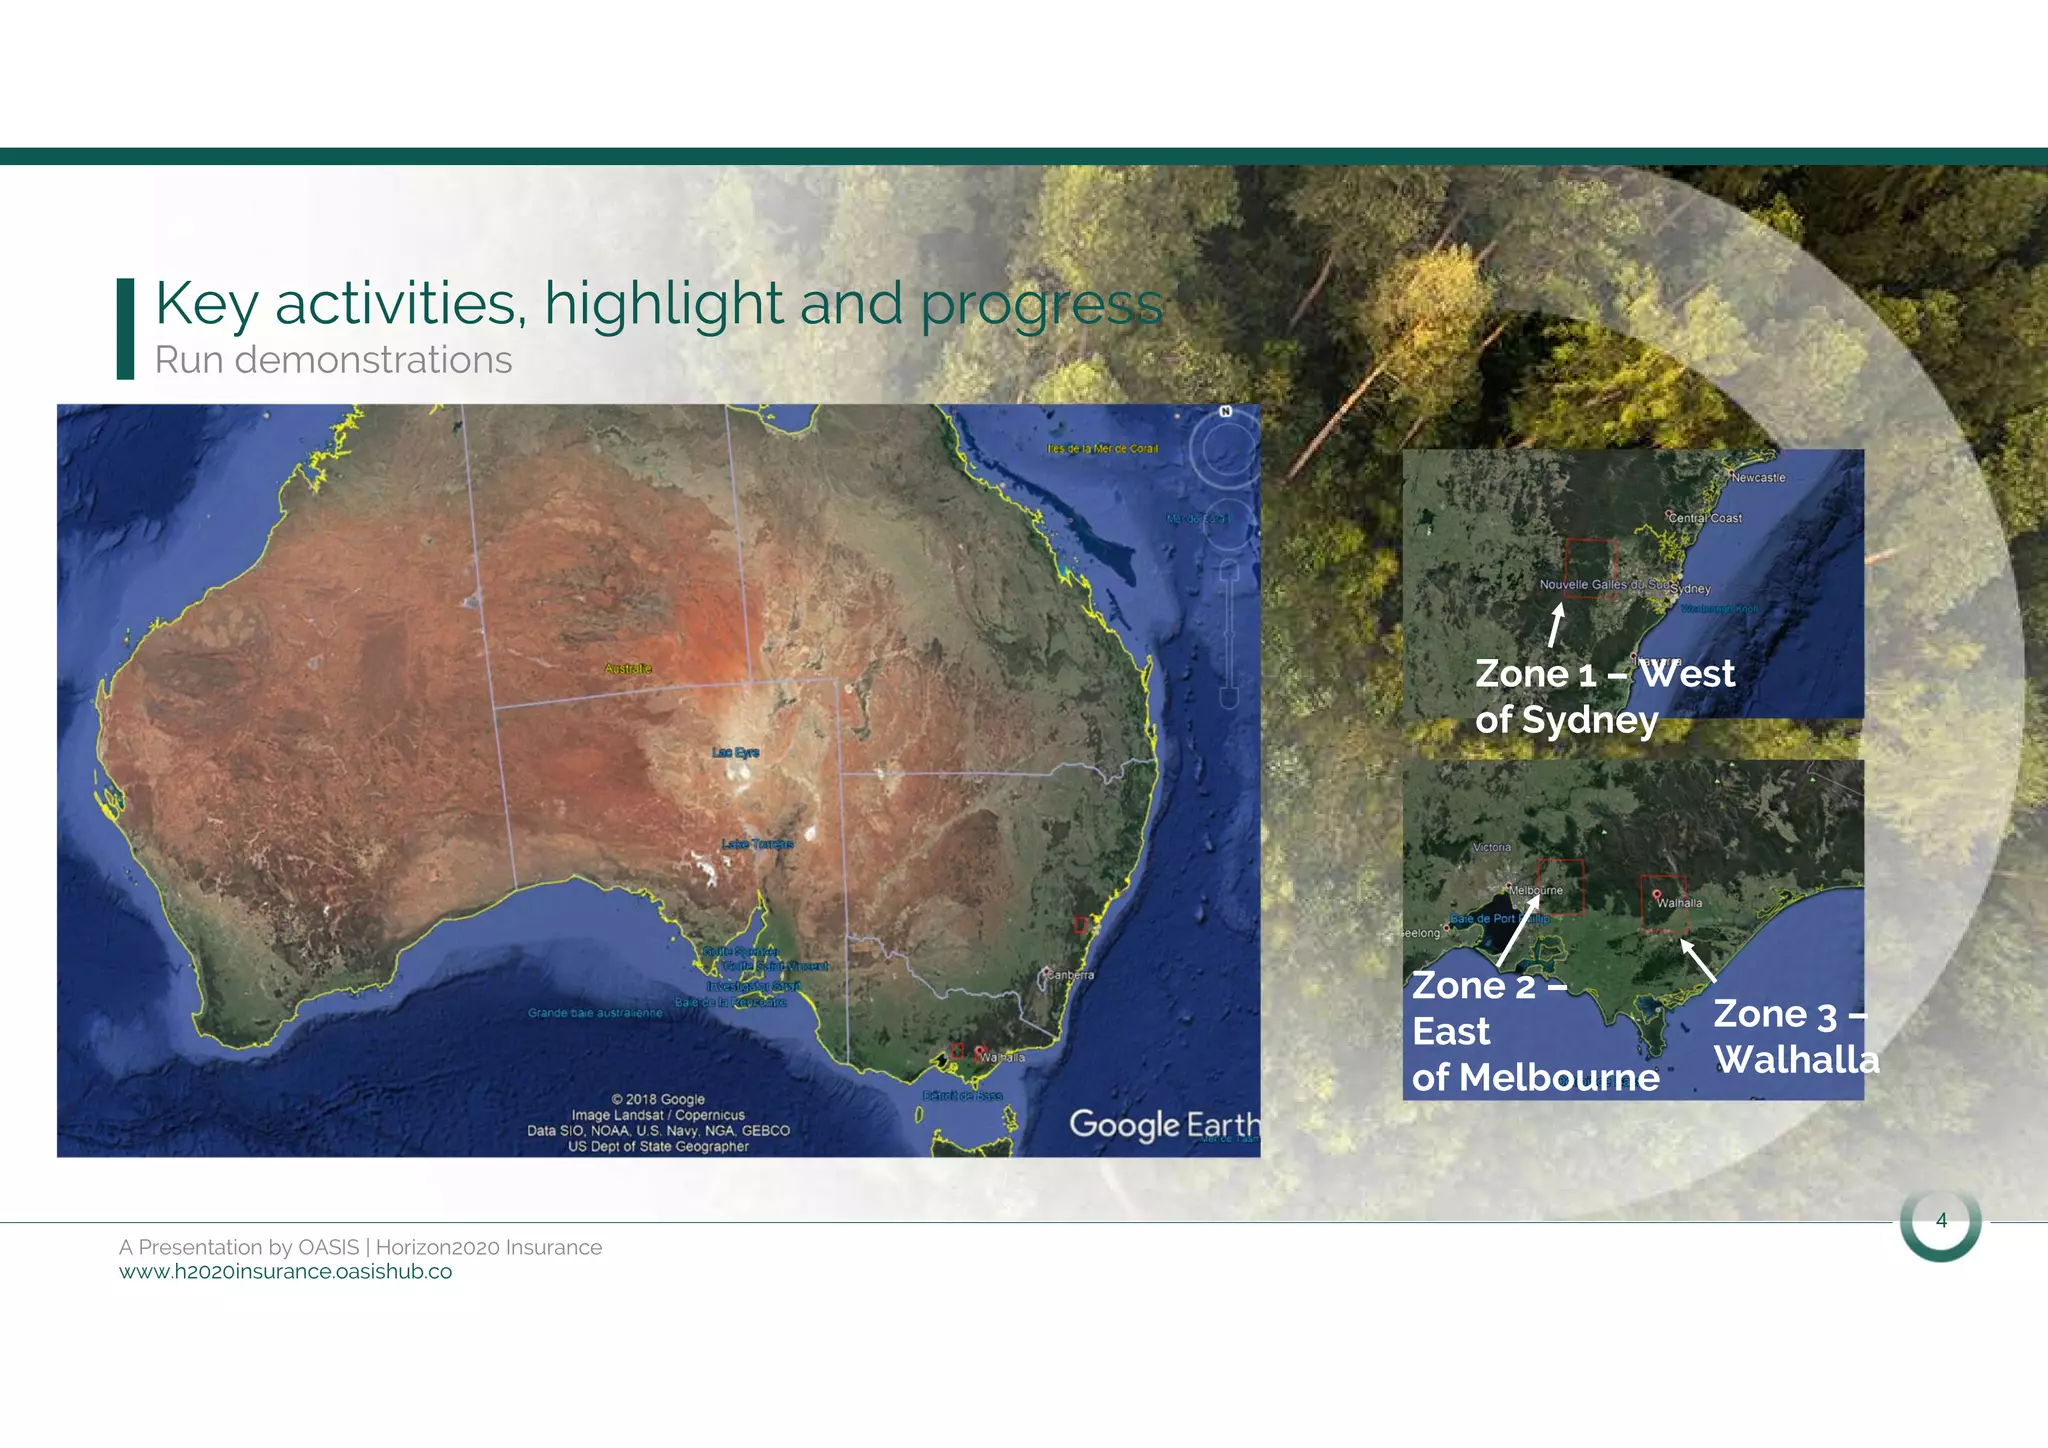
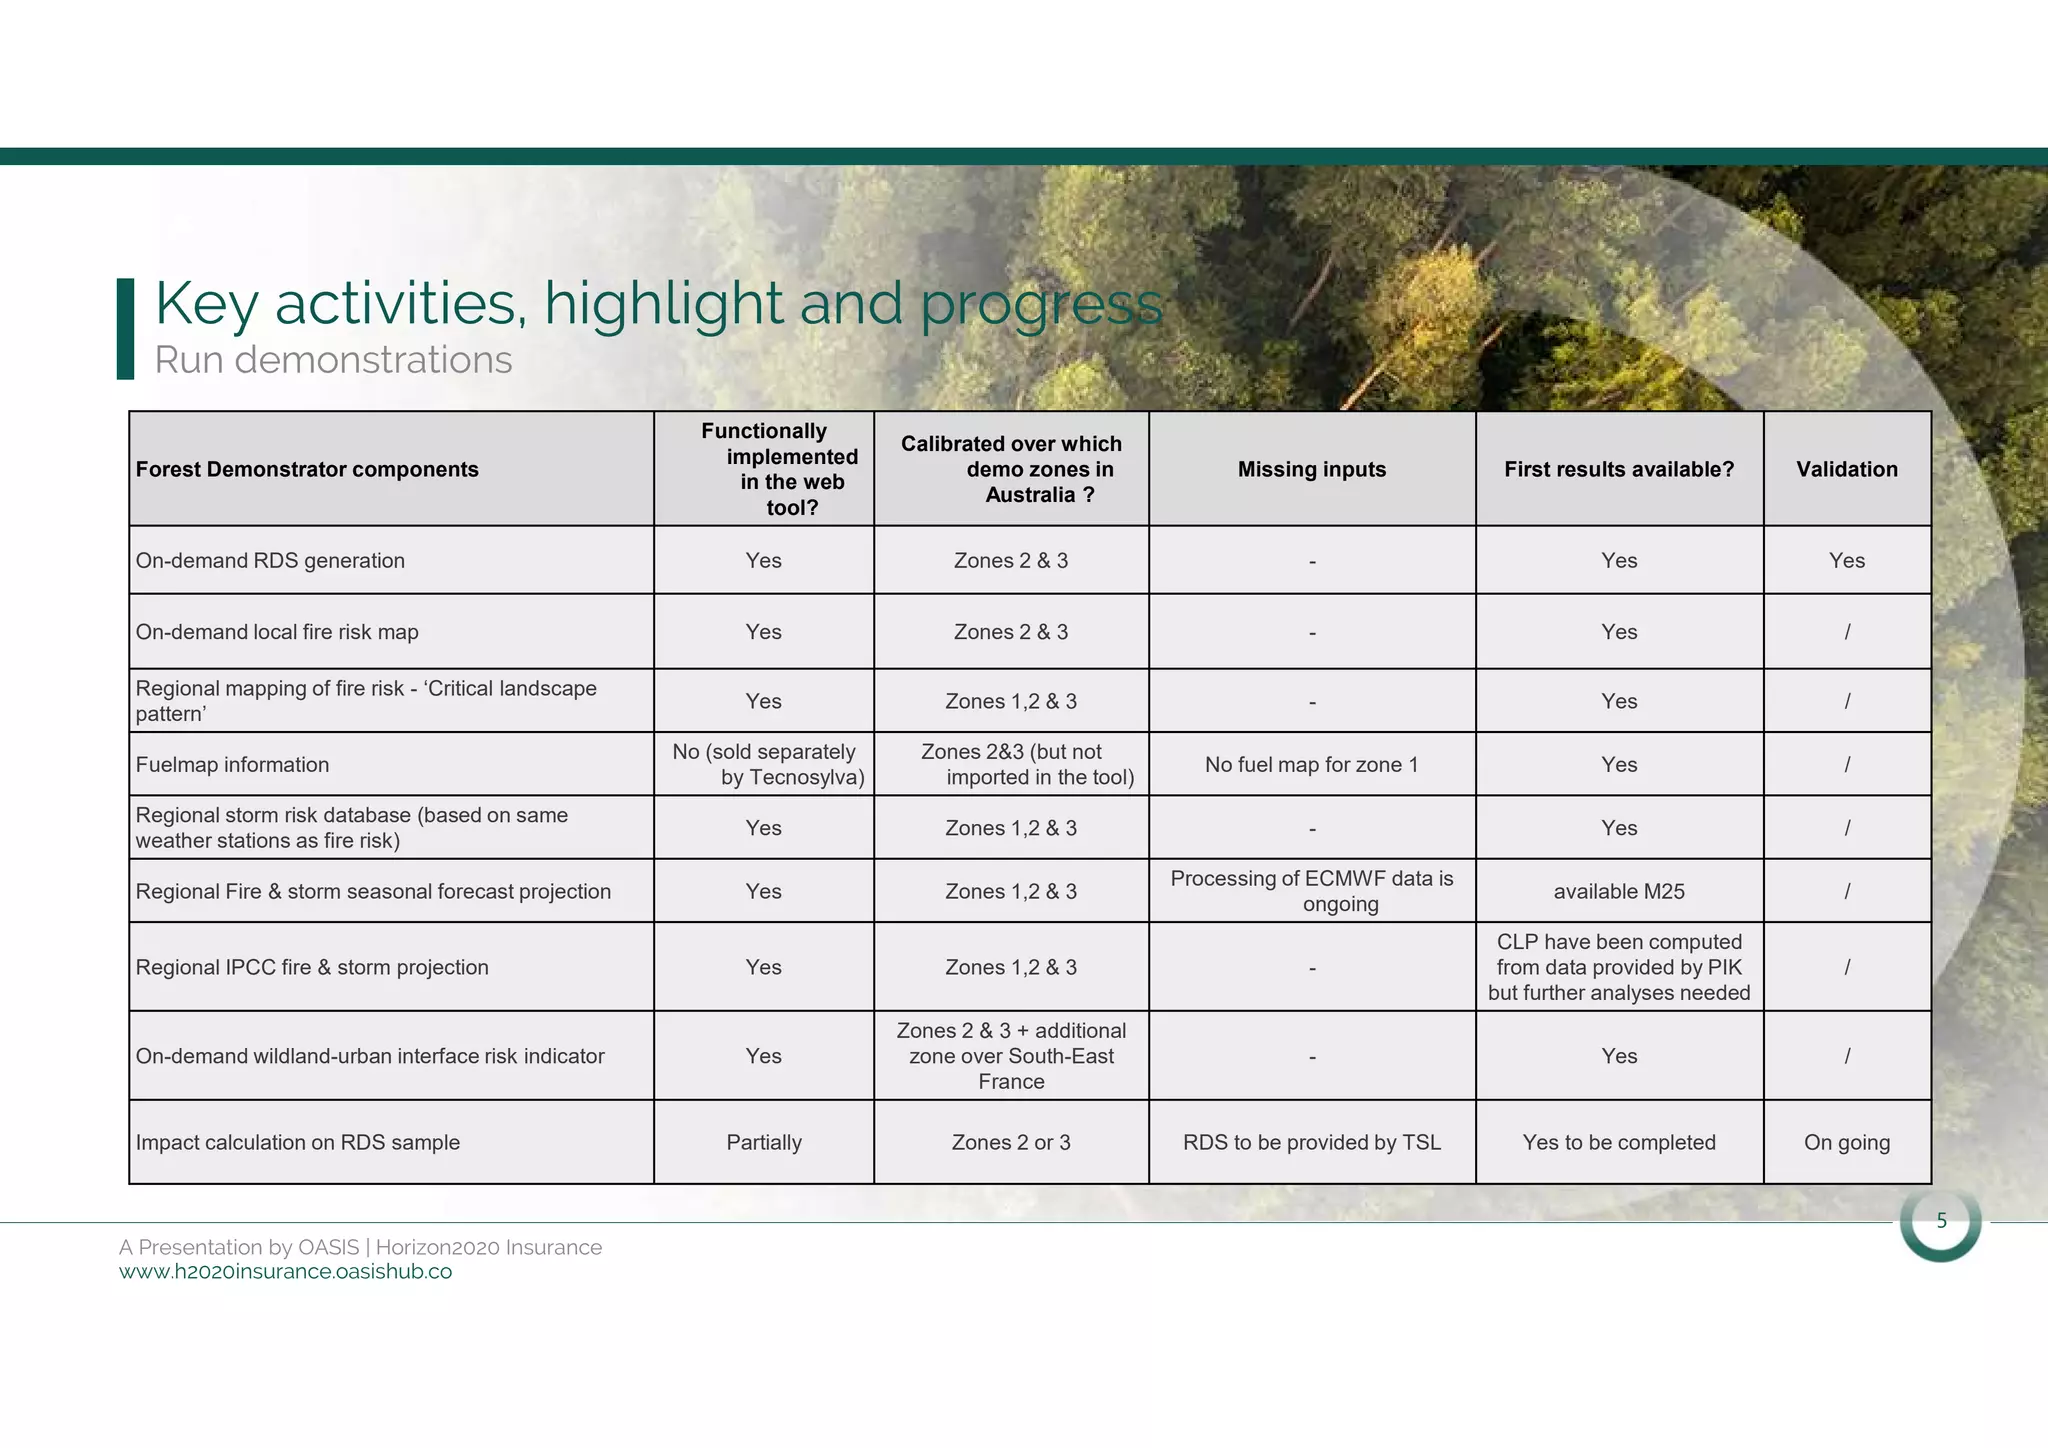

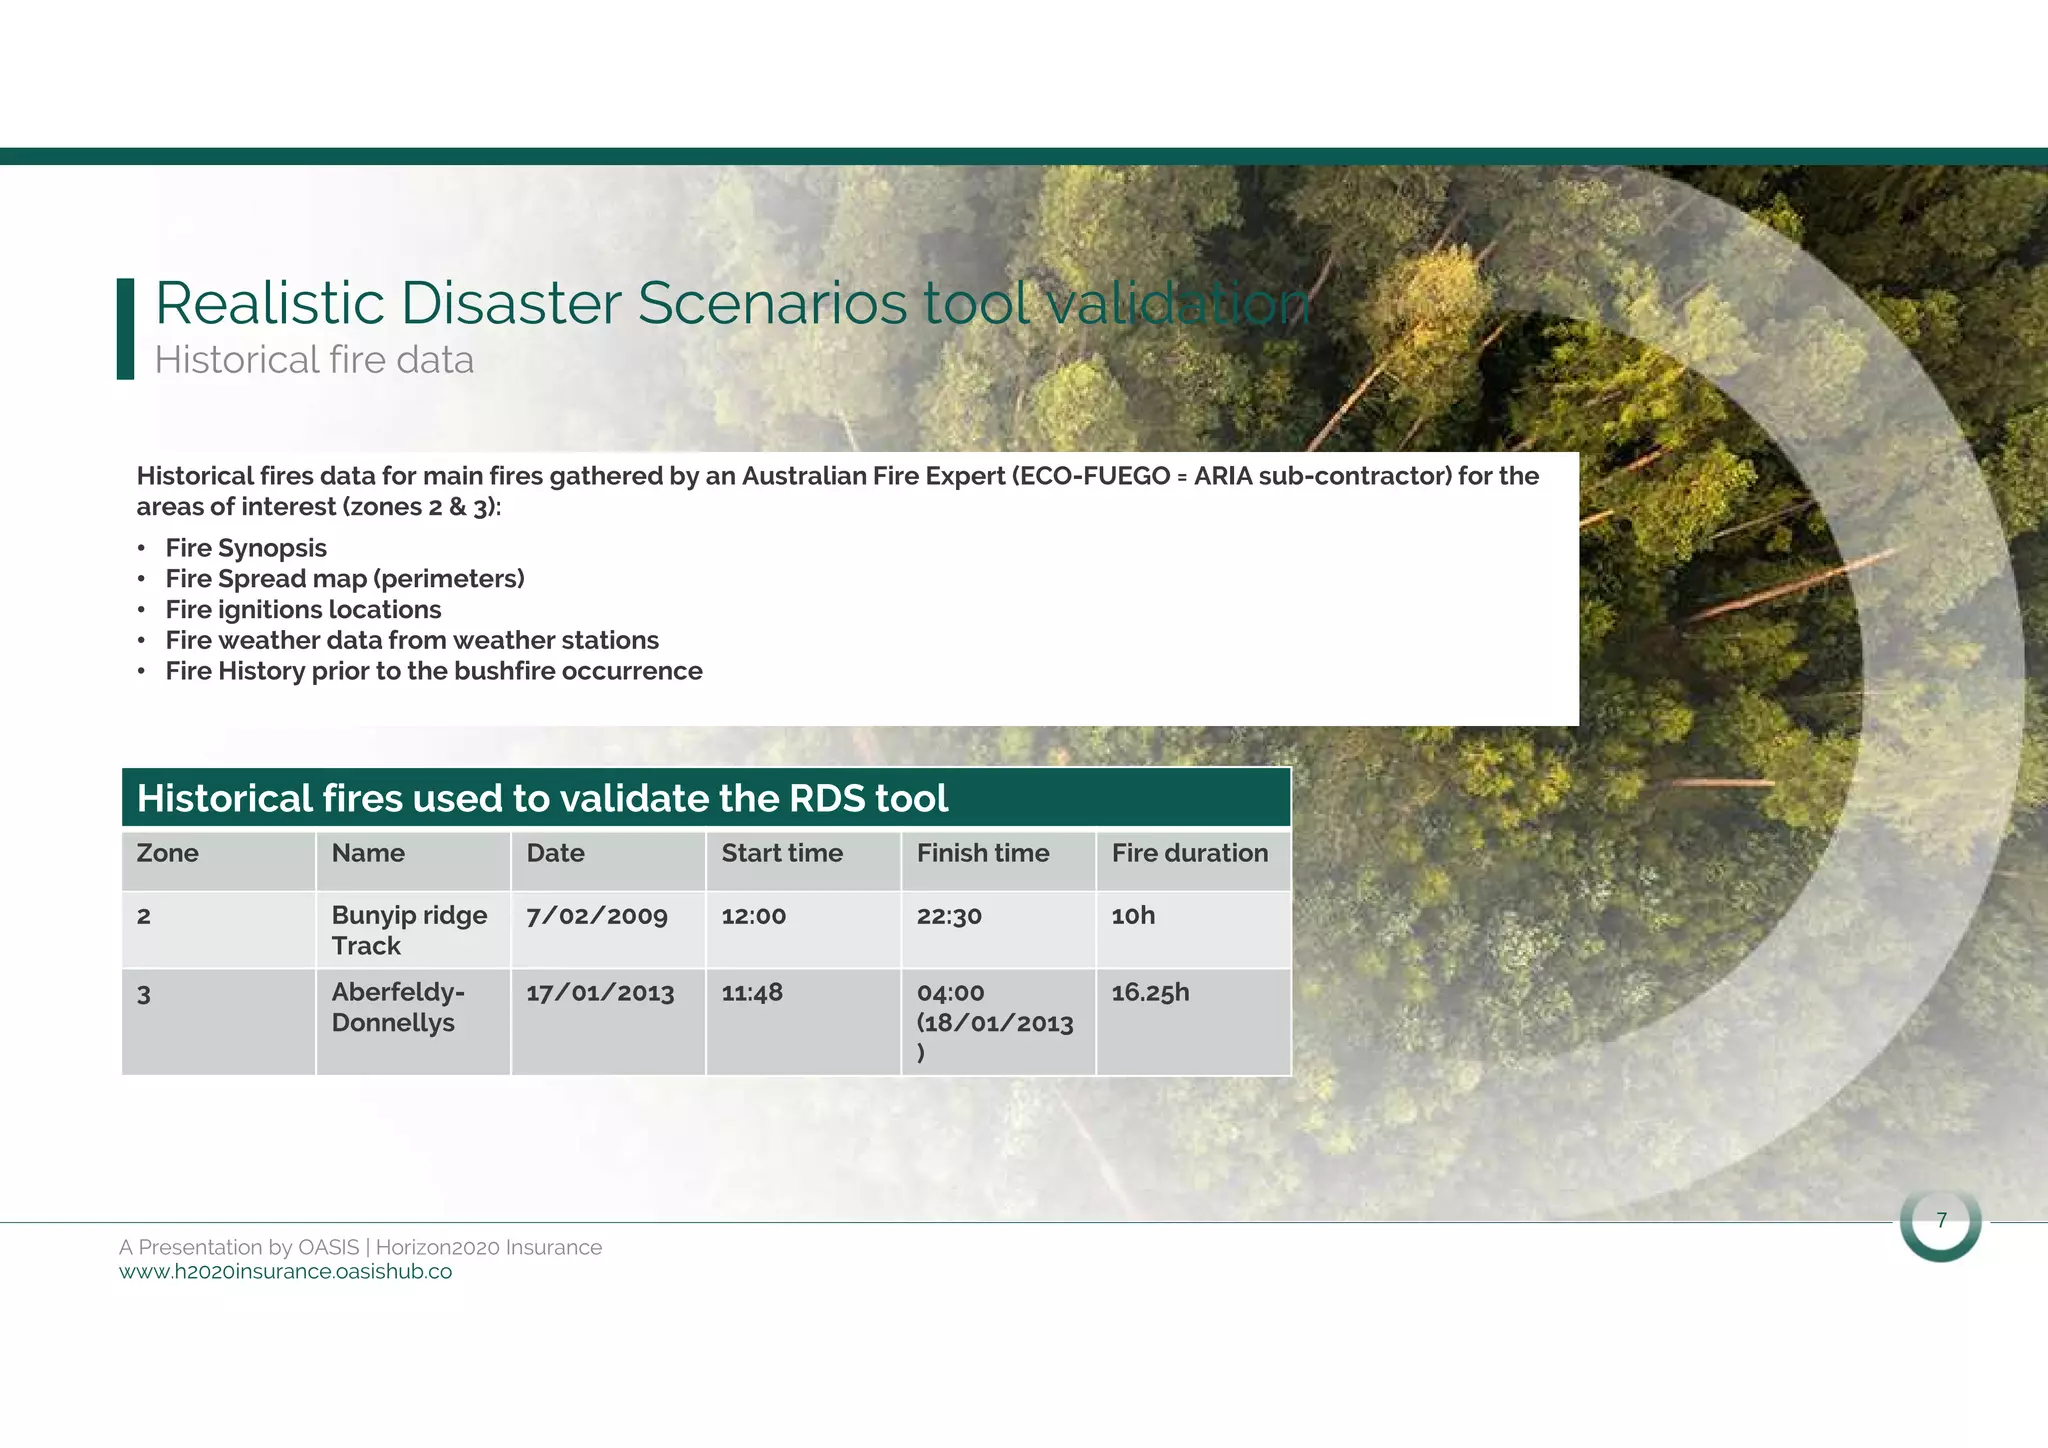
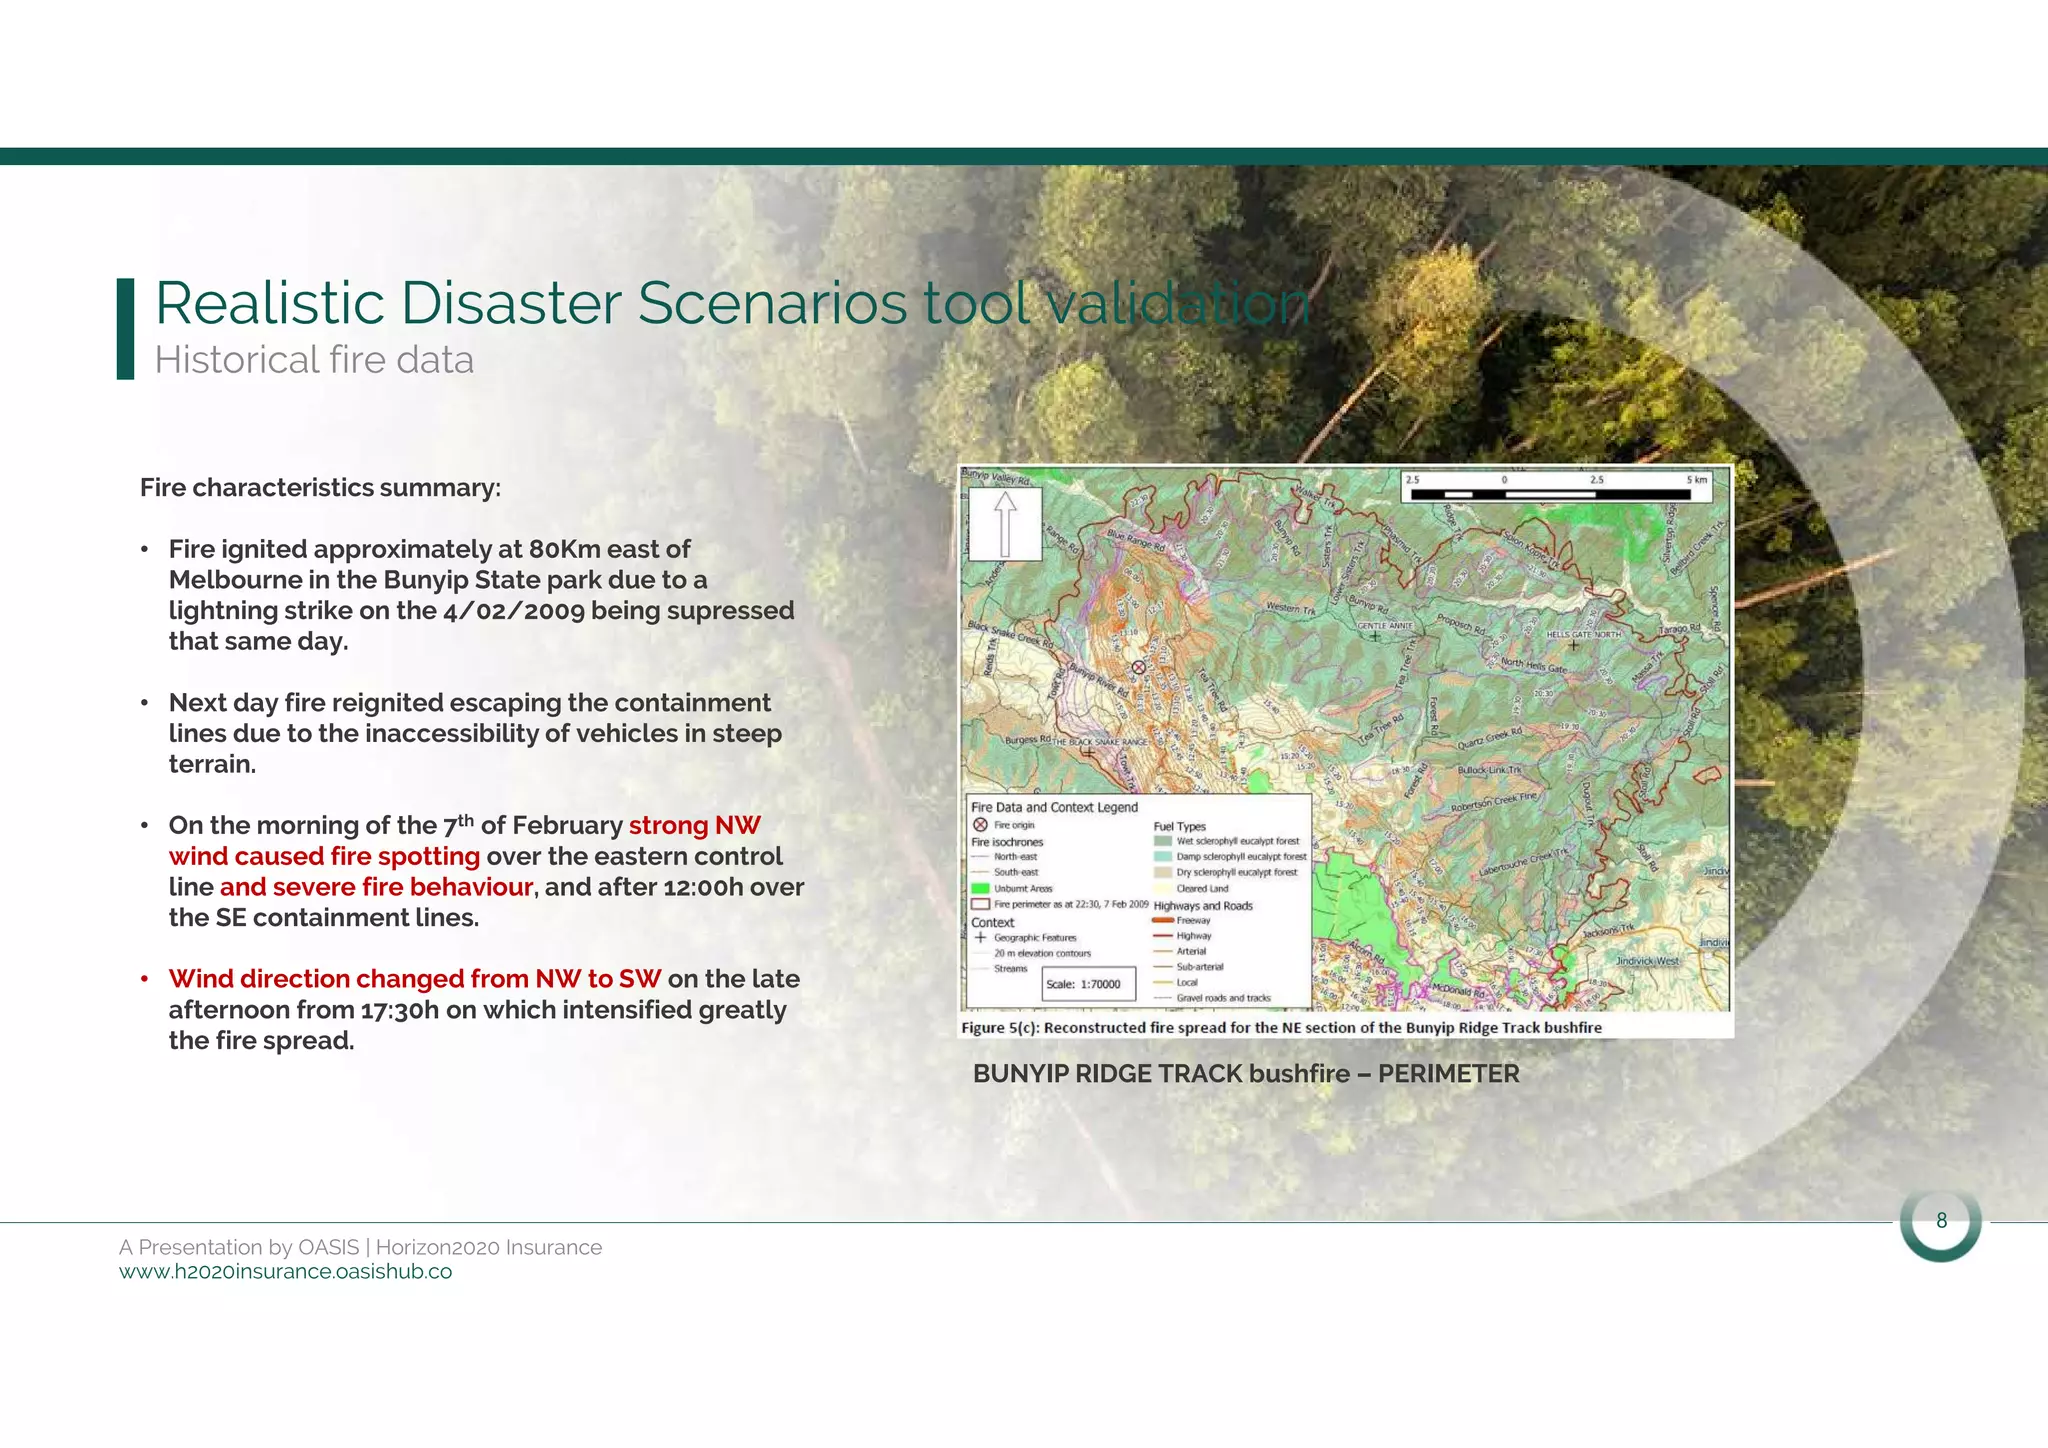
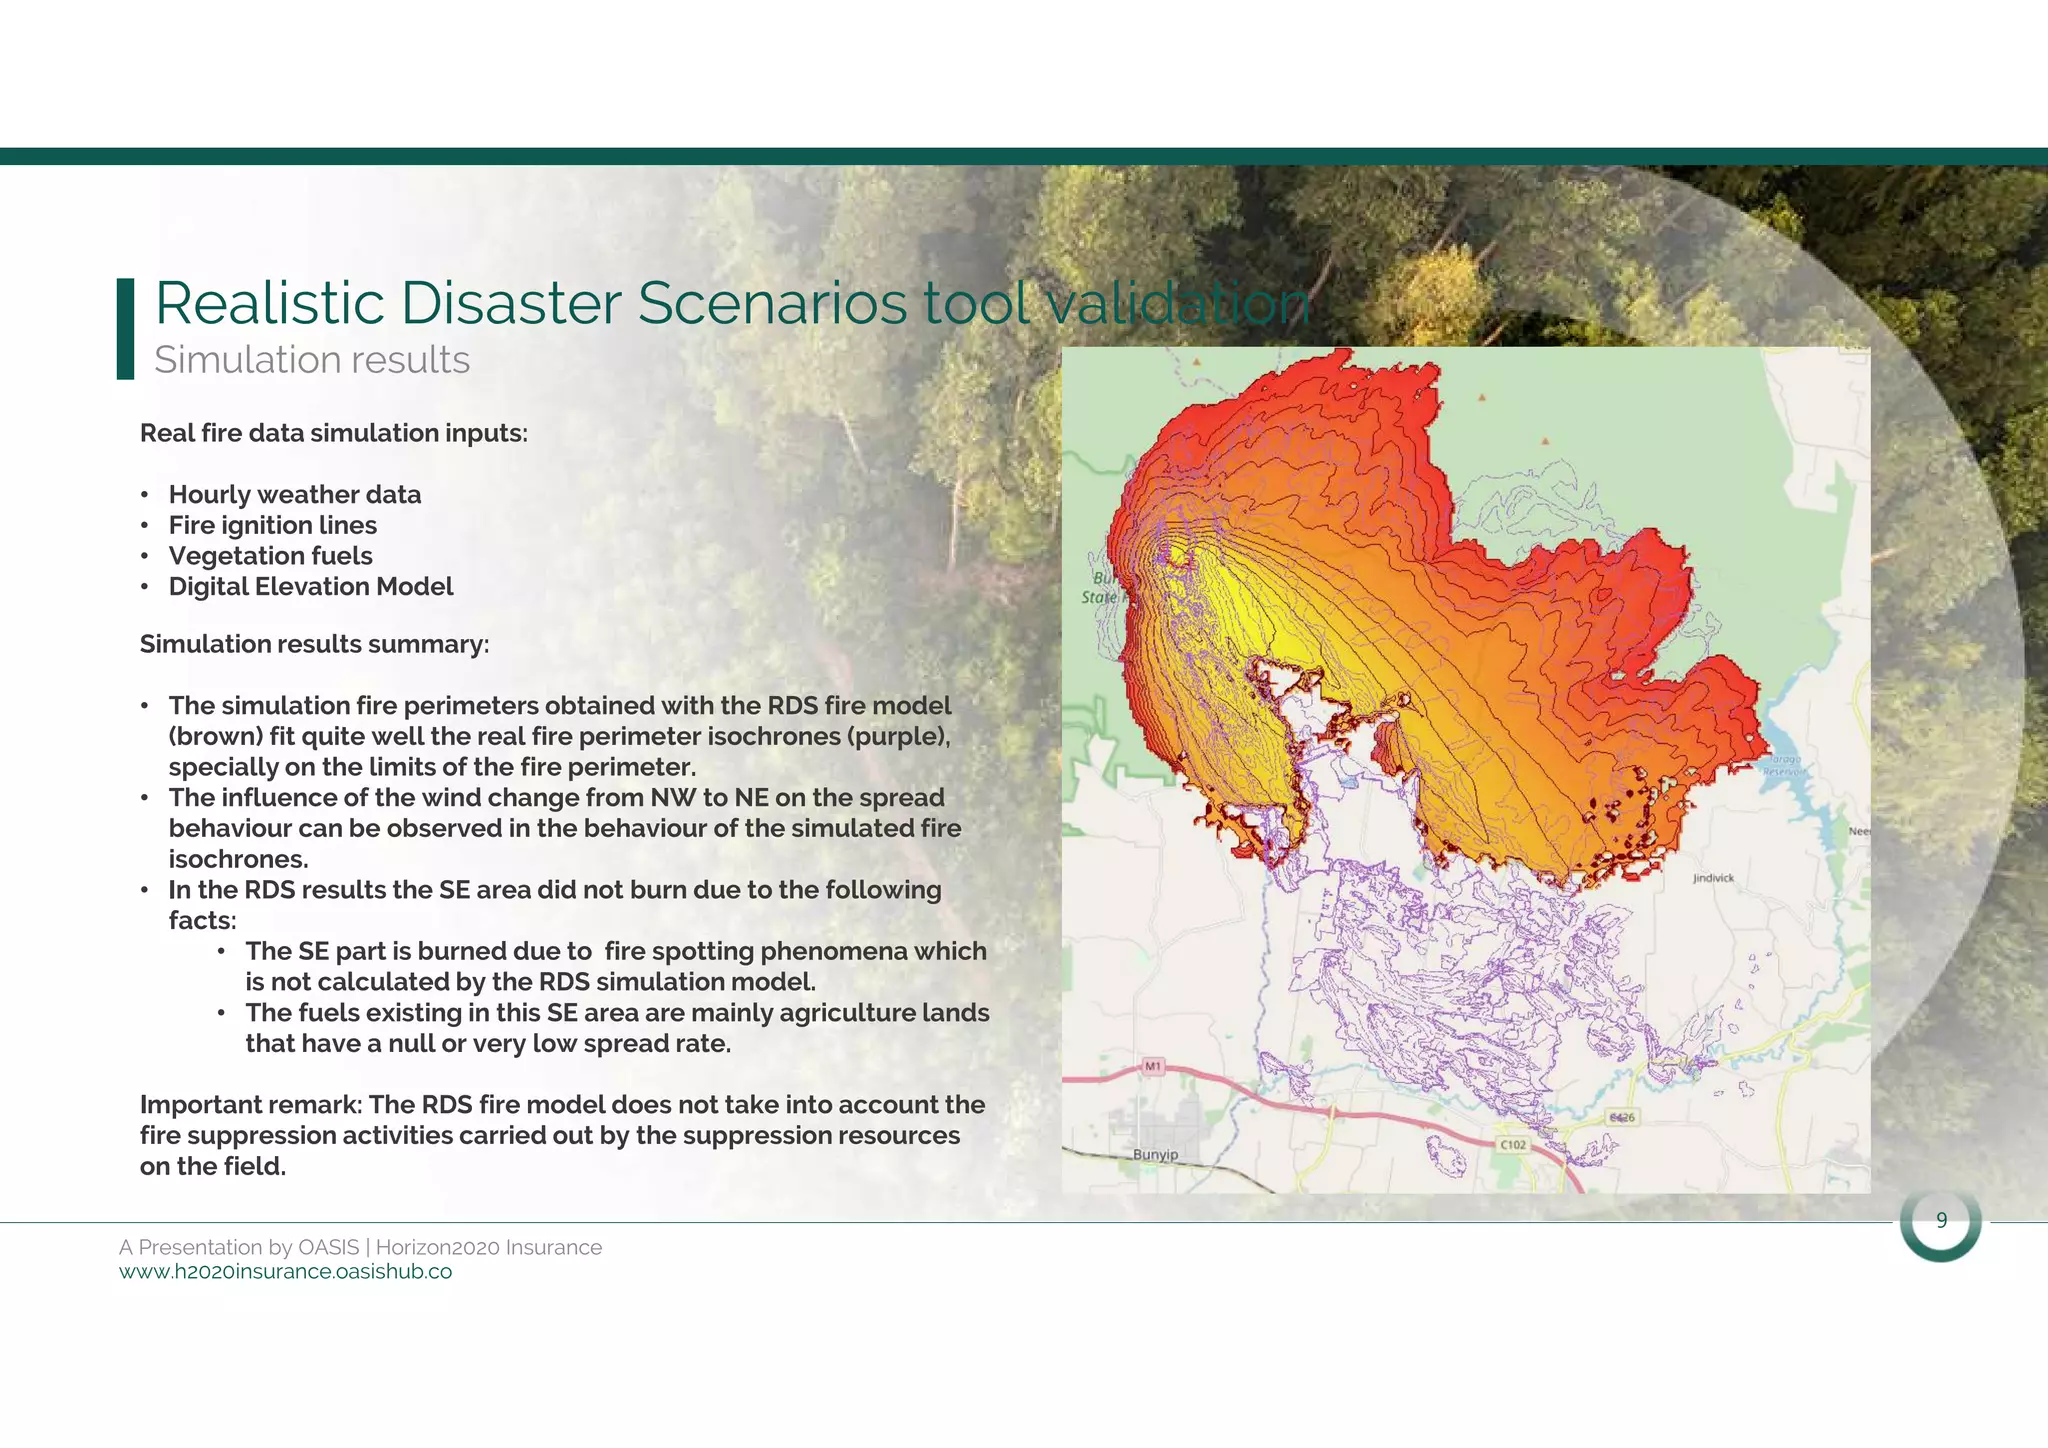


The document outlines the objectives and advancements of the Forest Demonstrator project under Horizon 2020, aiming to enhance the riskfp tool for the insurance sector by developing new climate services for fire and storm risks. Key services include generating realistic disaster scenarios and regional risk mapping, with various tasks focusing on demonstration, business model development, and market strategies. Progress includes running demonstrations in Australian regions, validating models with historical fire data, and engaging potential commercial clients.


