Download to read offline


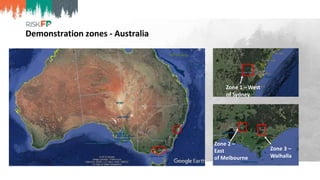

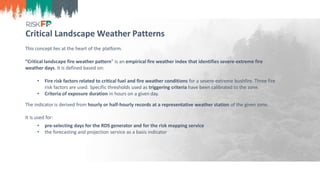


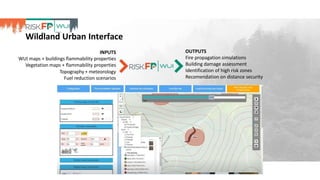


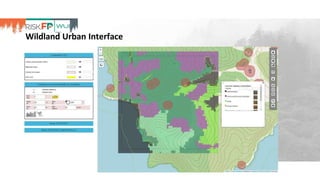
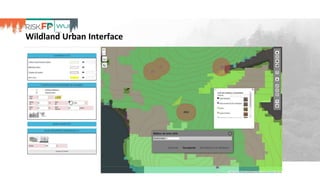


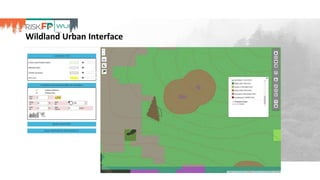


The document discusses the development of RiskFP, a geospatial web-based modeling platform designed to help manage fire risk for forest managers, investors, and insurers. It features four main modules that include risk mapping, seasonal forecasts, realistic disaster scenarios, and analysis of the wildland-urban interface. Various testing locations around the world demonstrate its application and effectiveness in predicting and managing wildfire impacts.