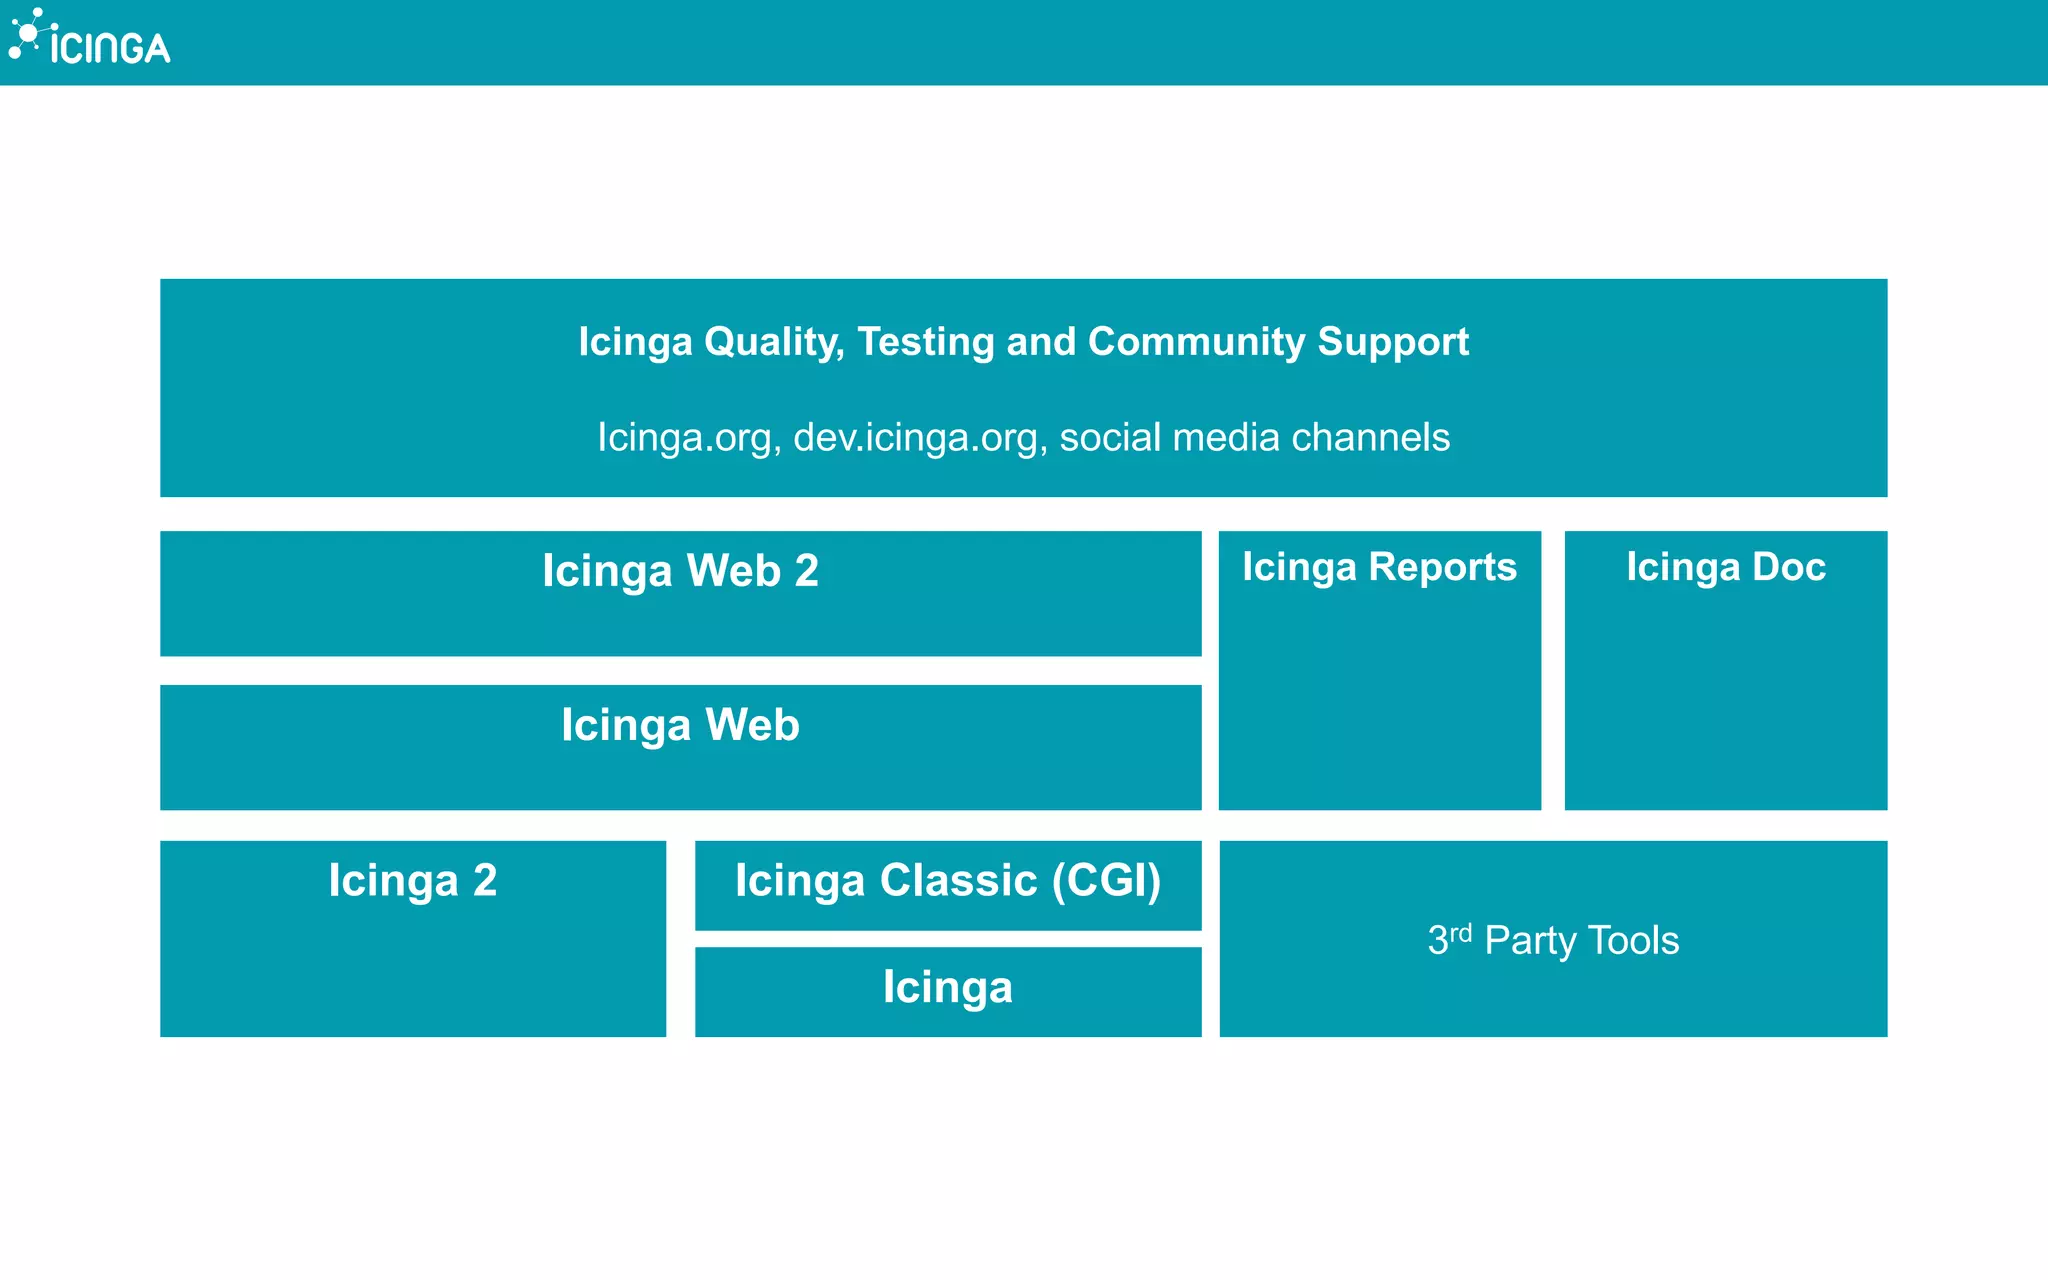
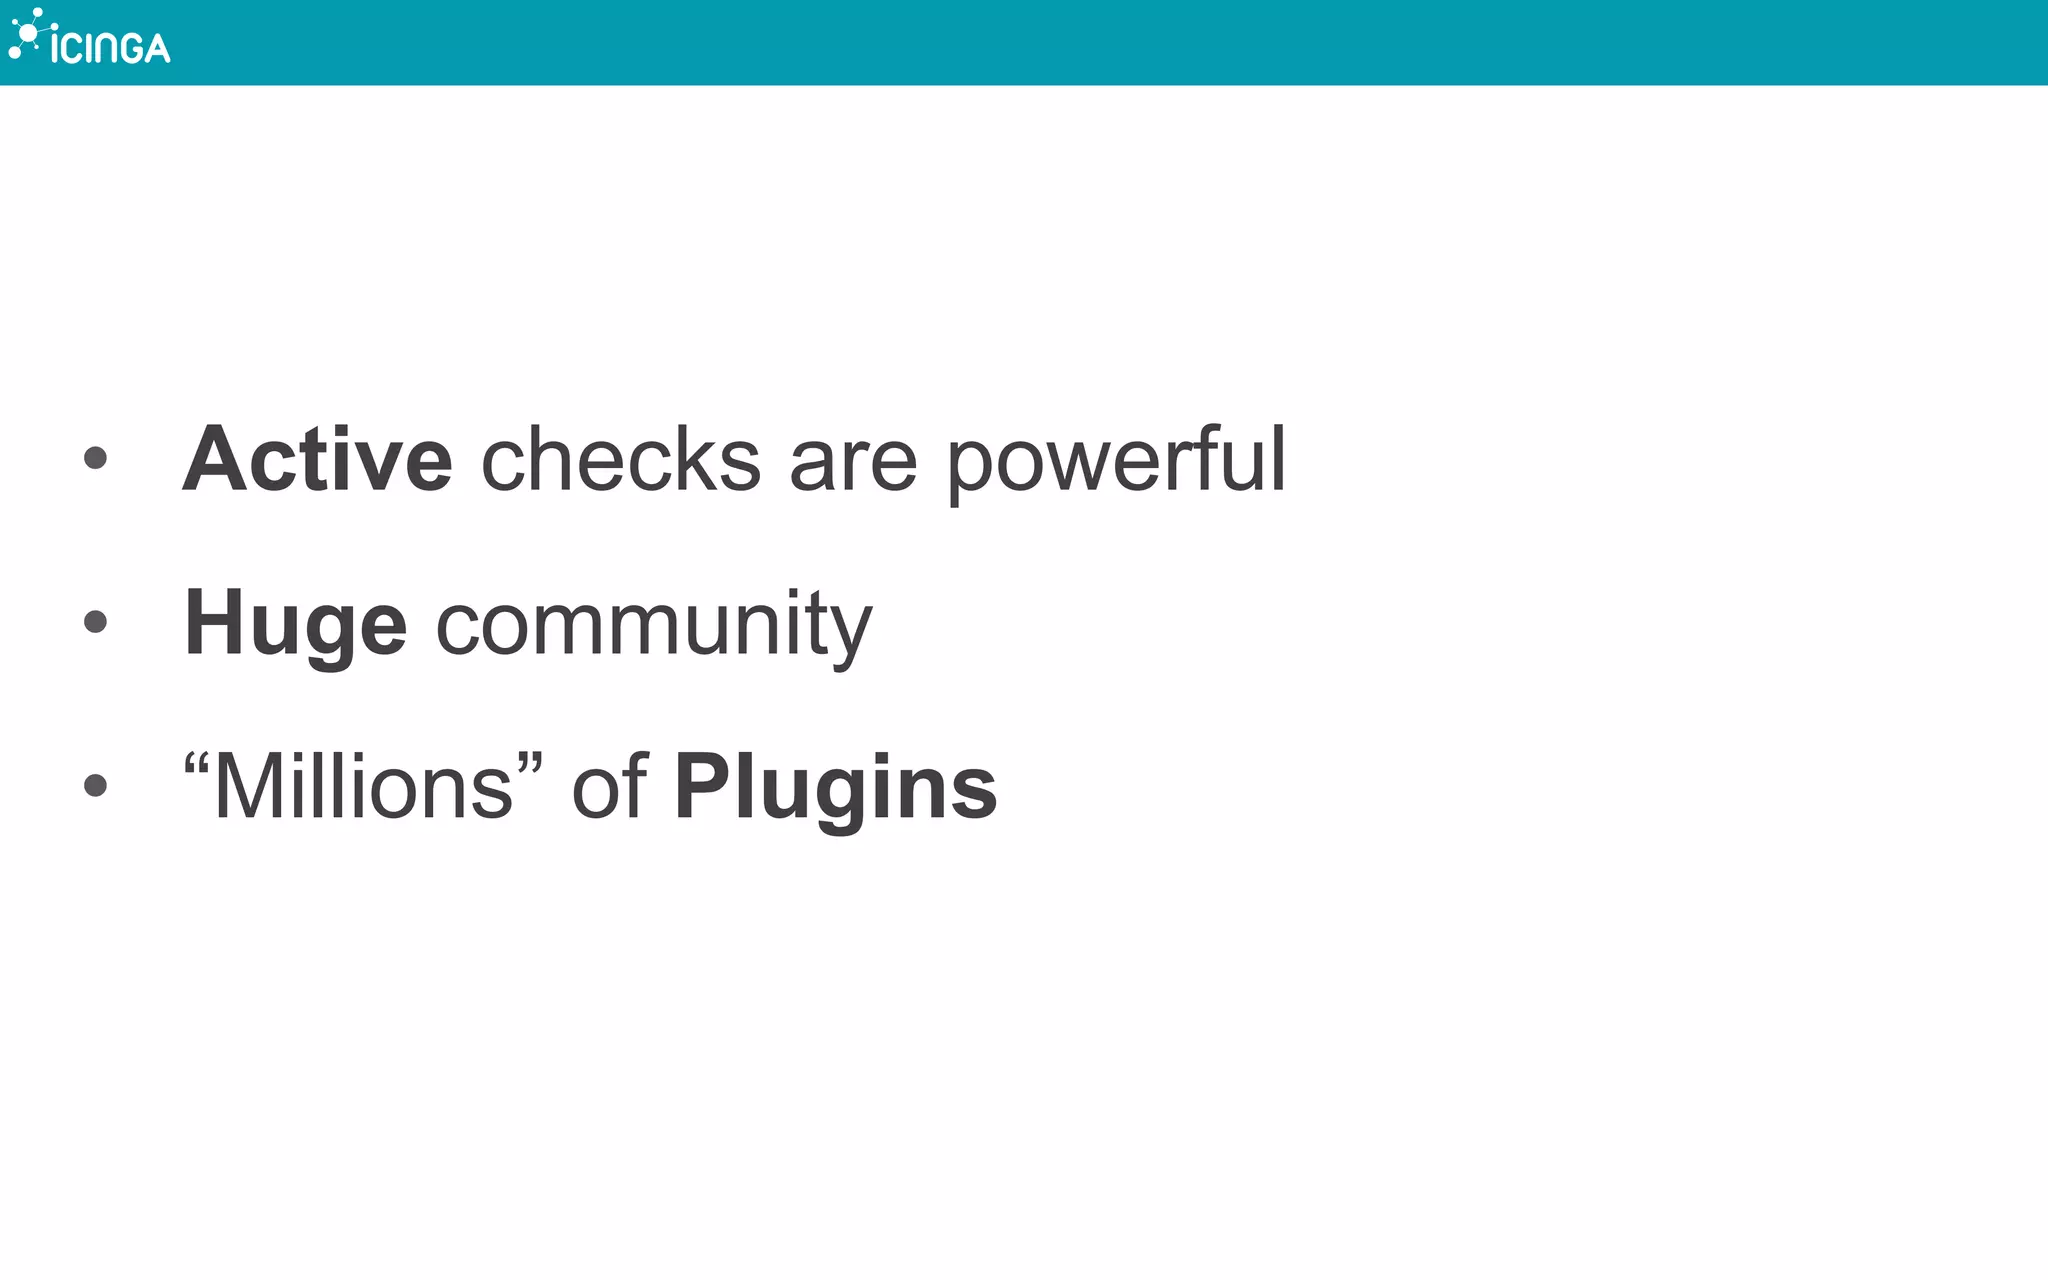
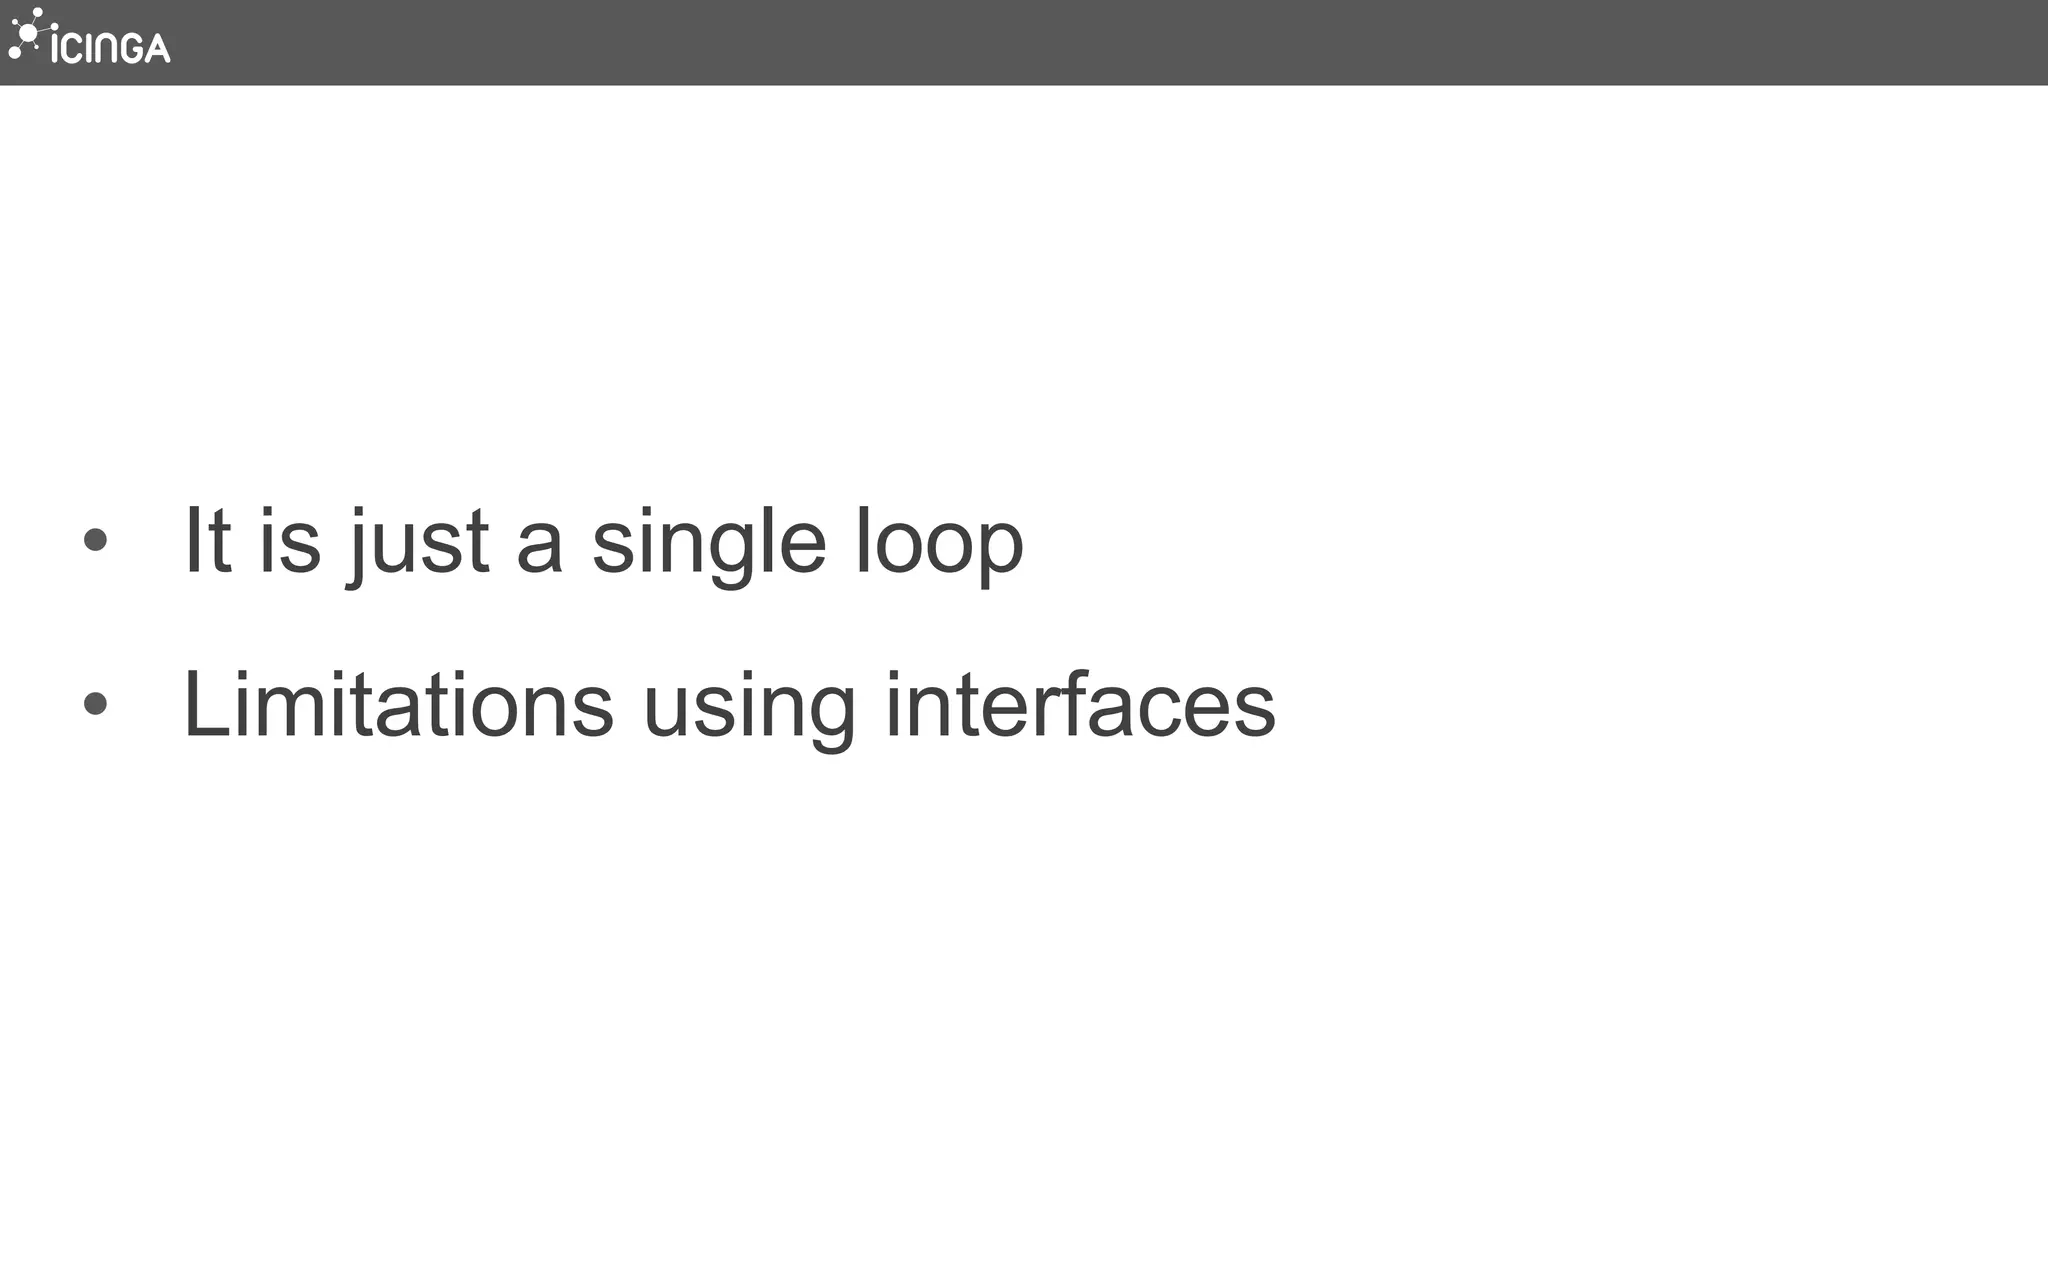
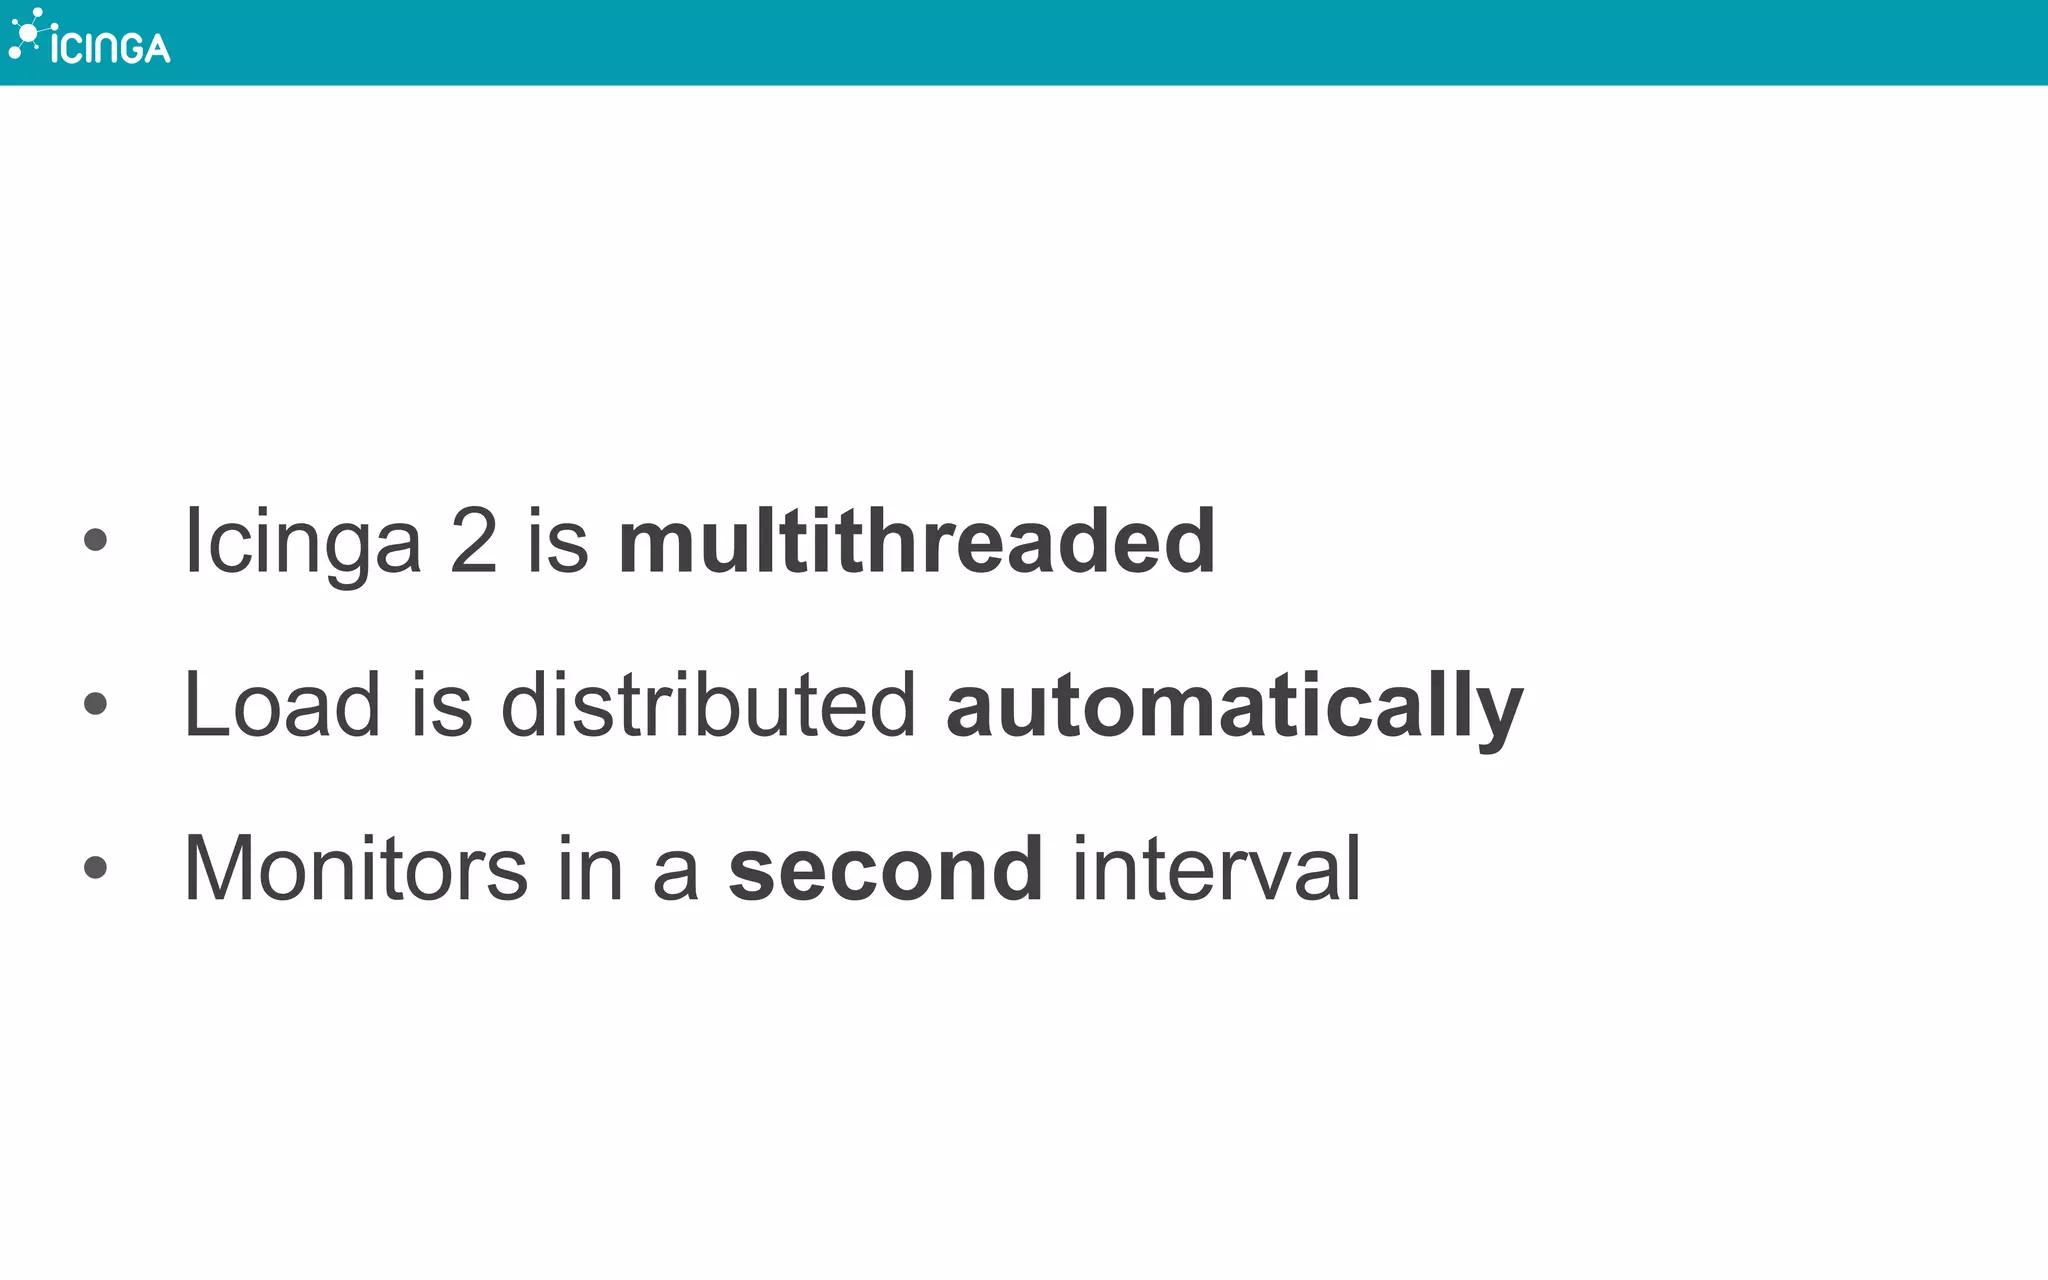
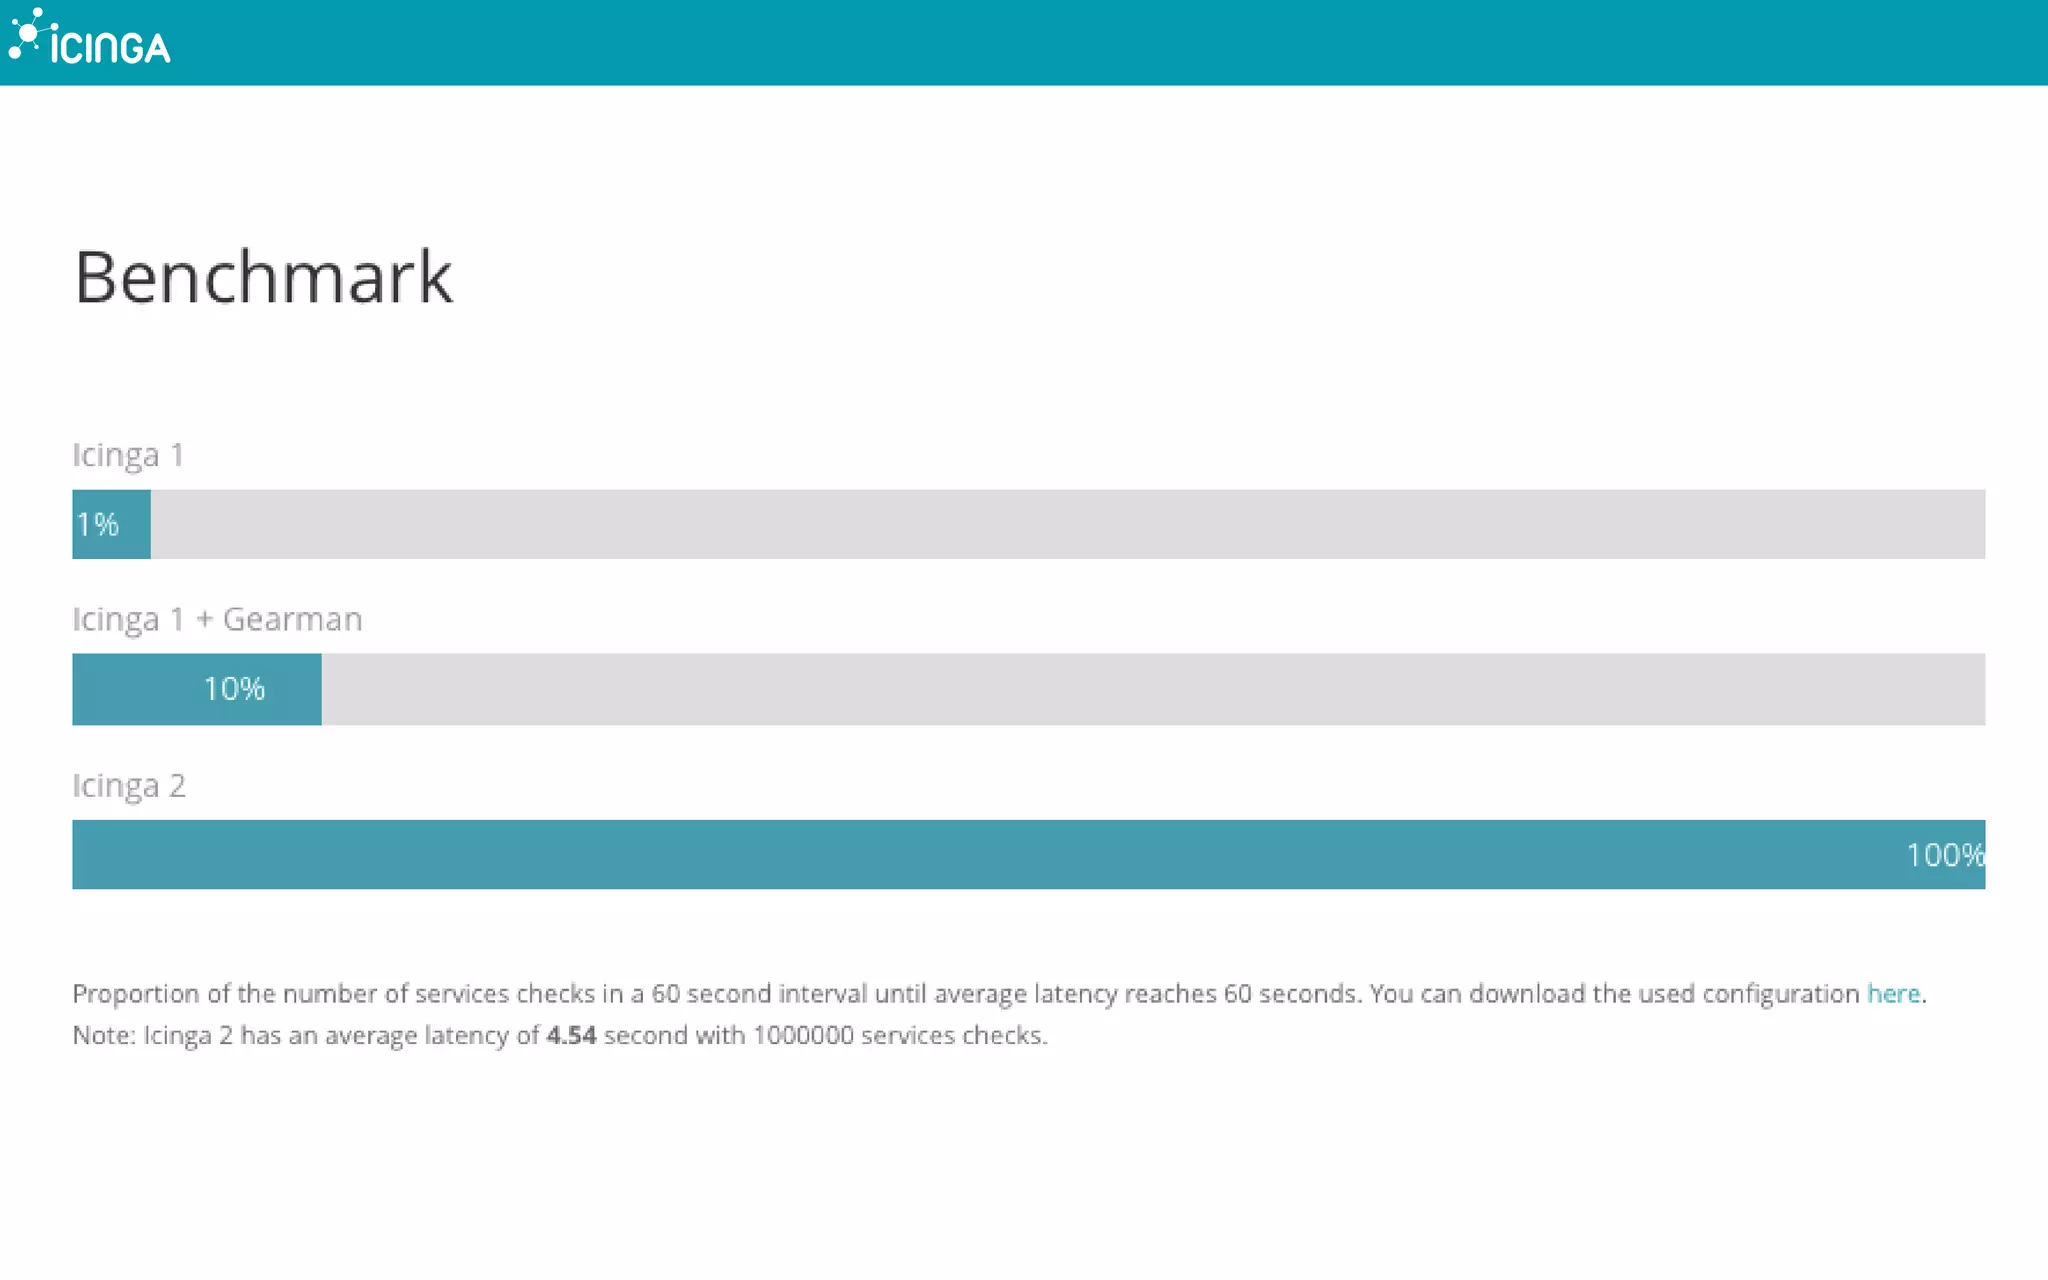
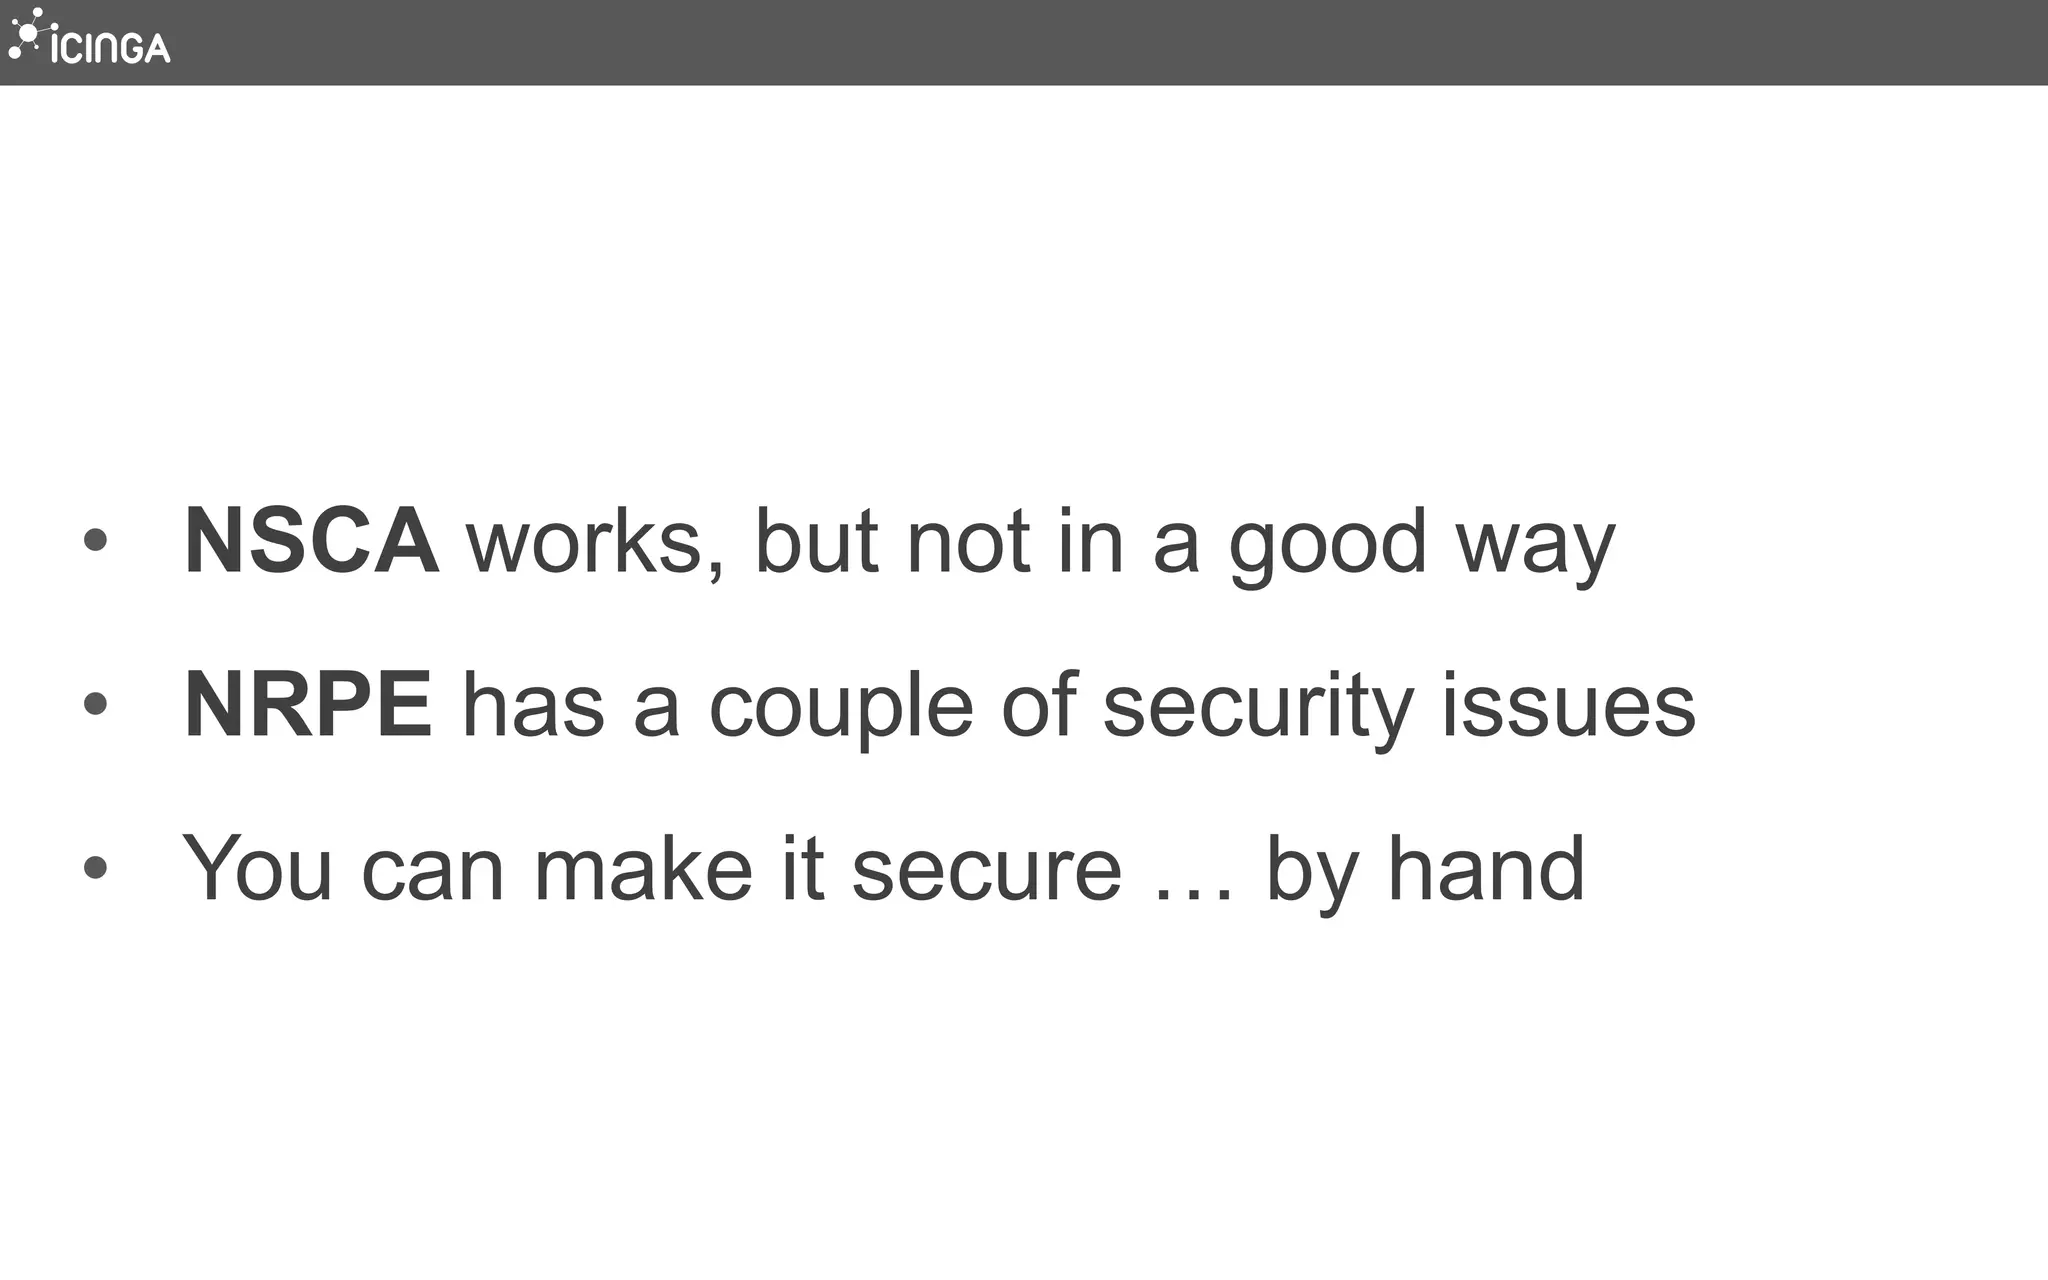
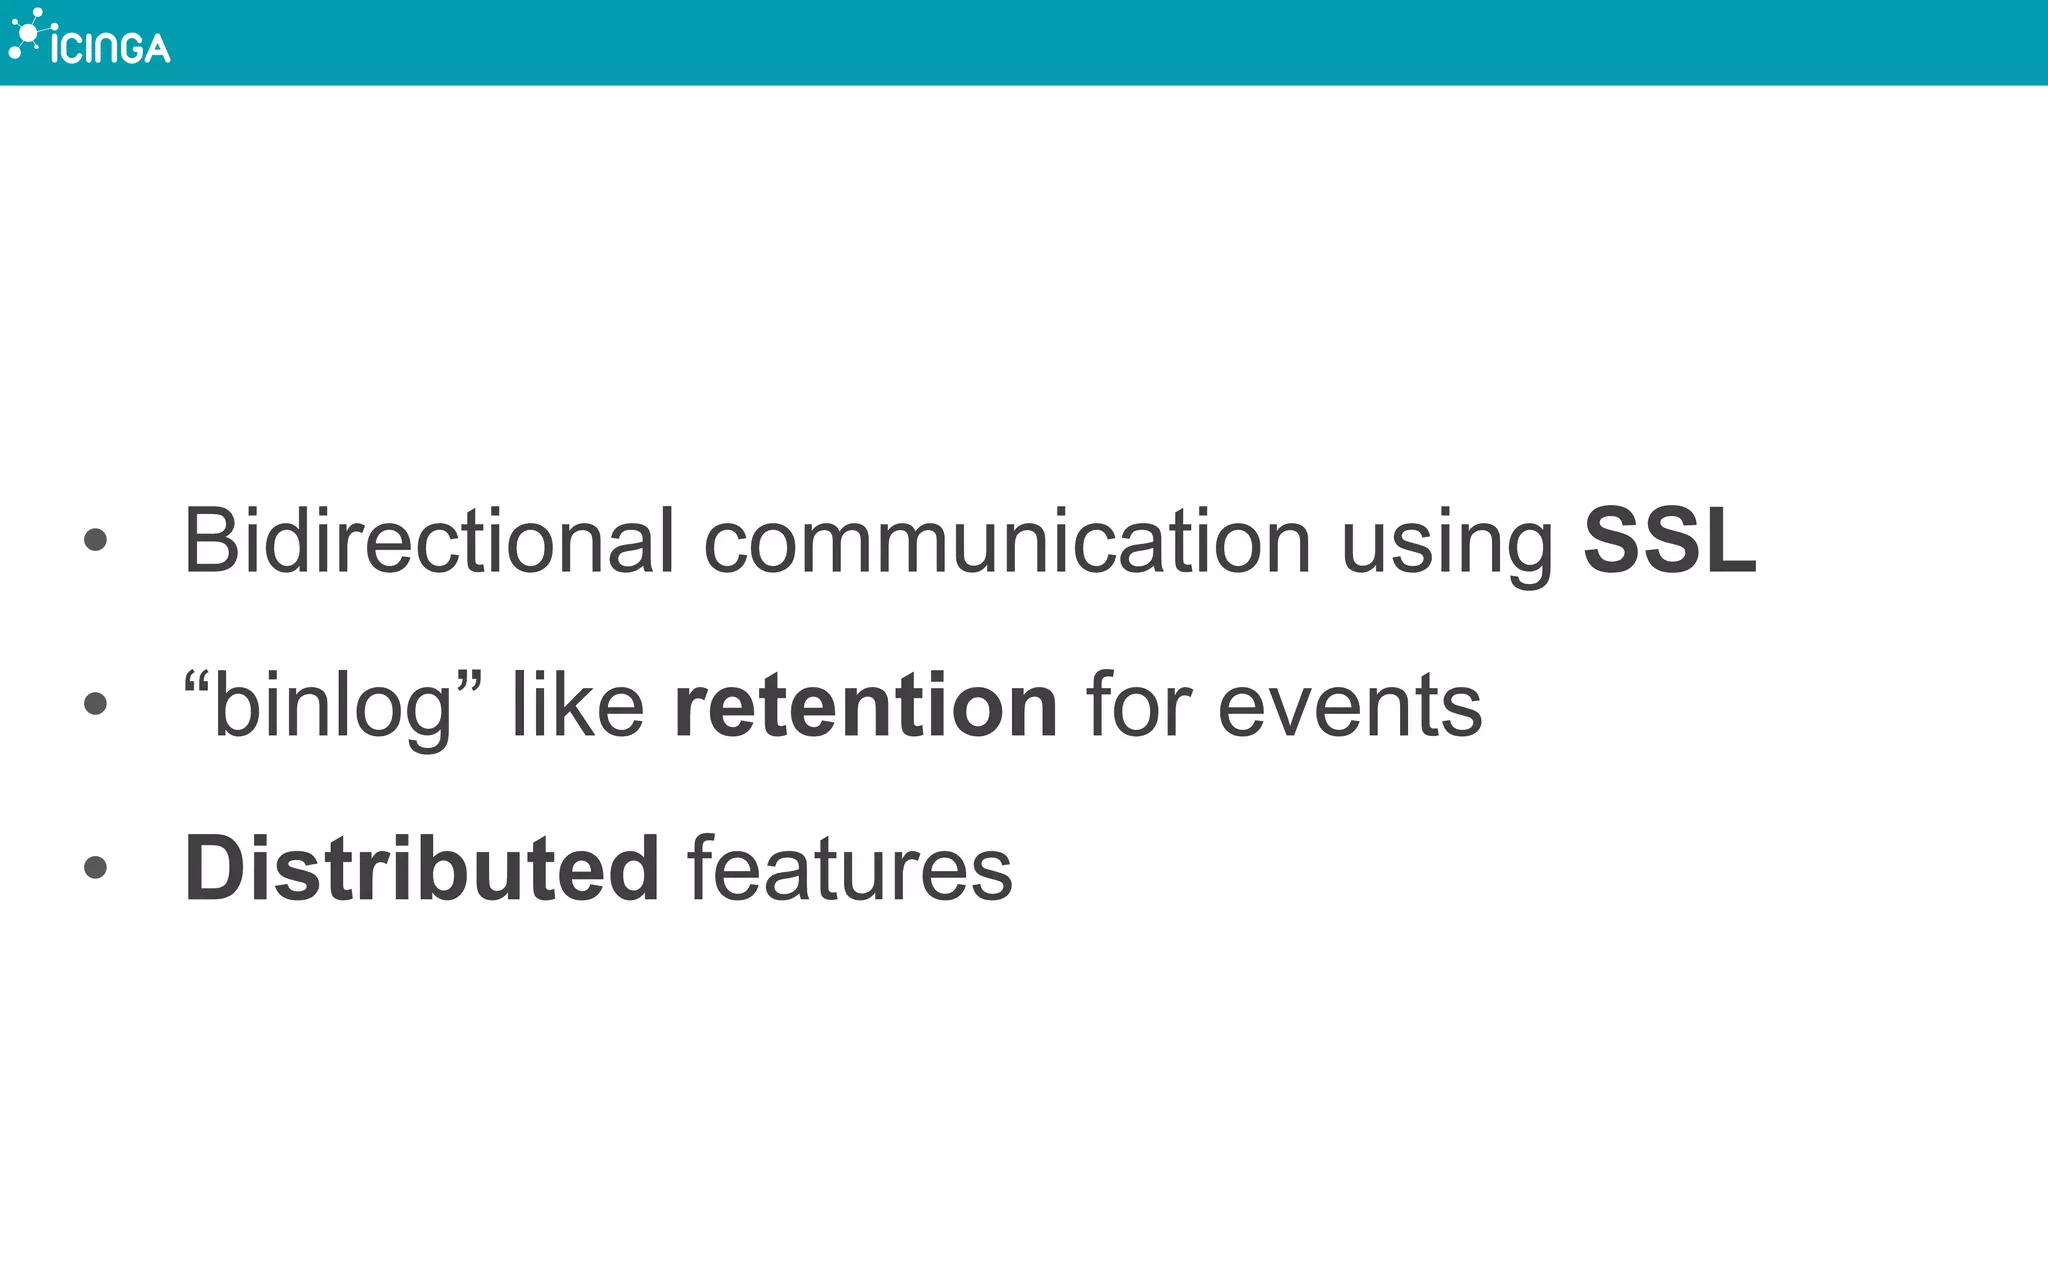
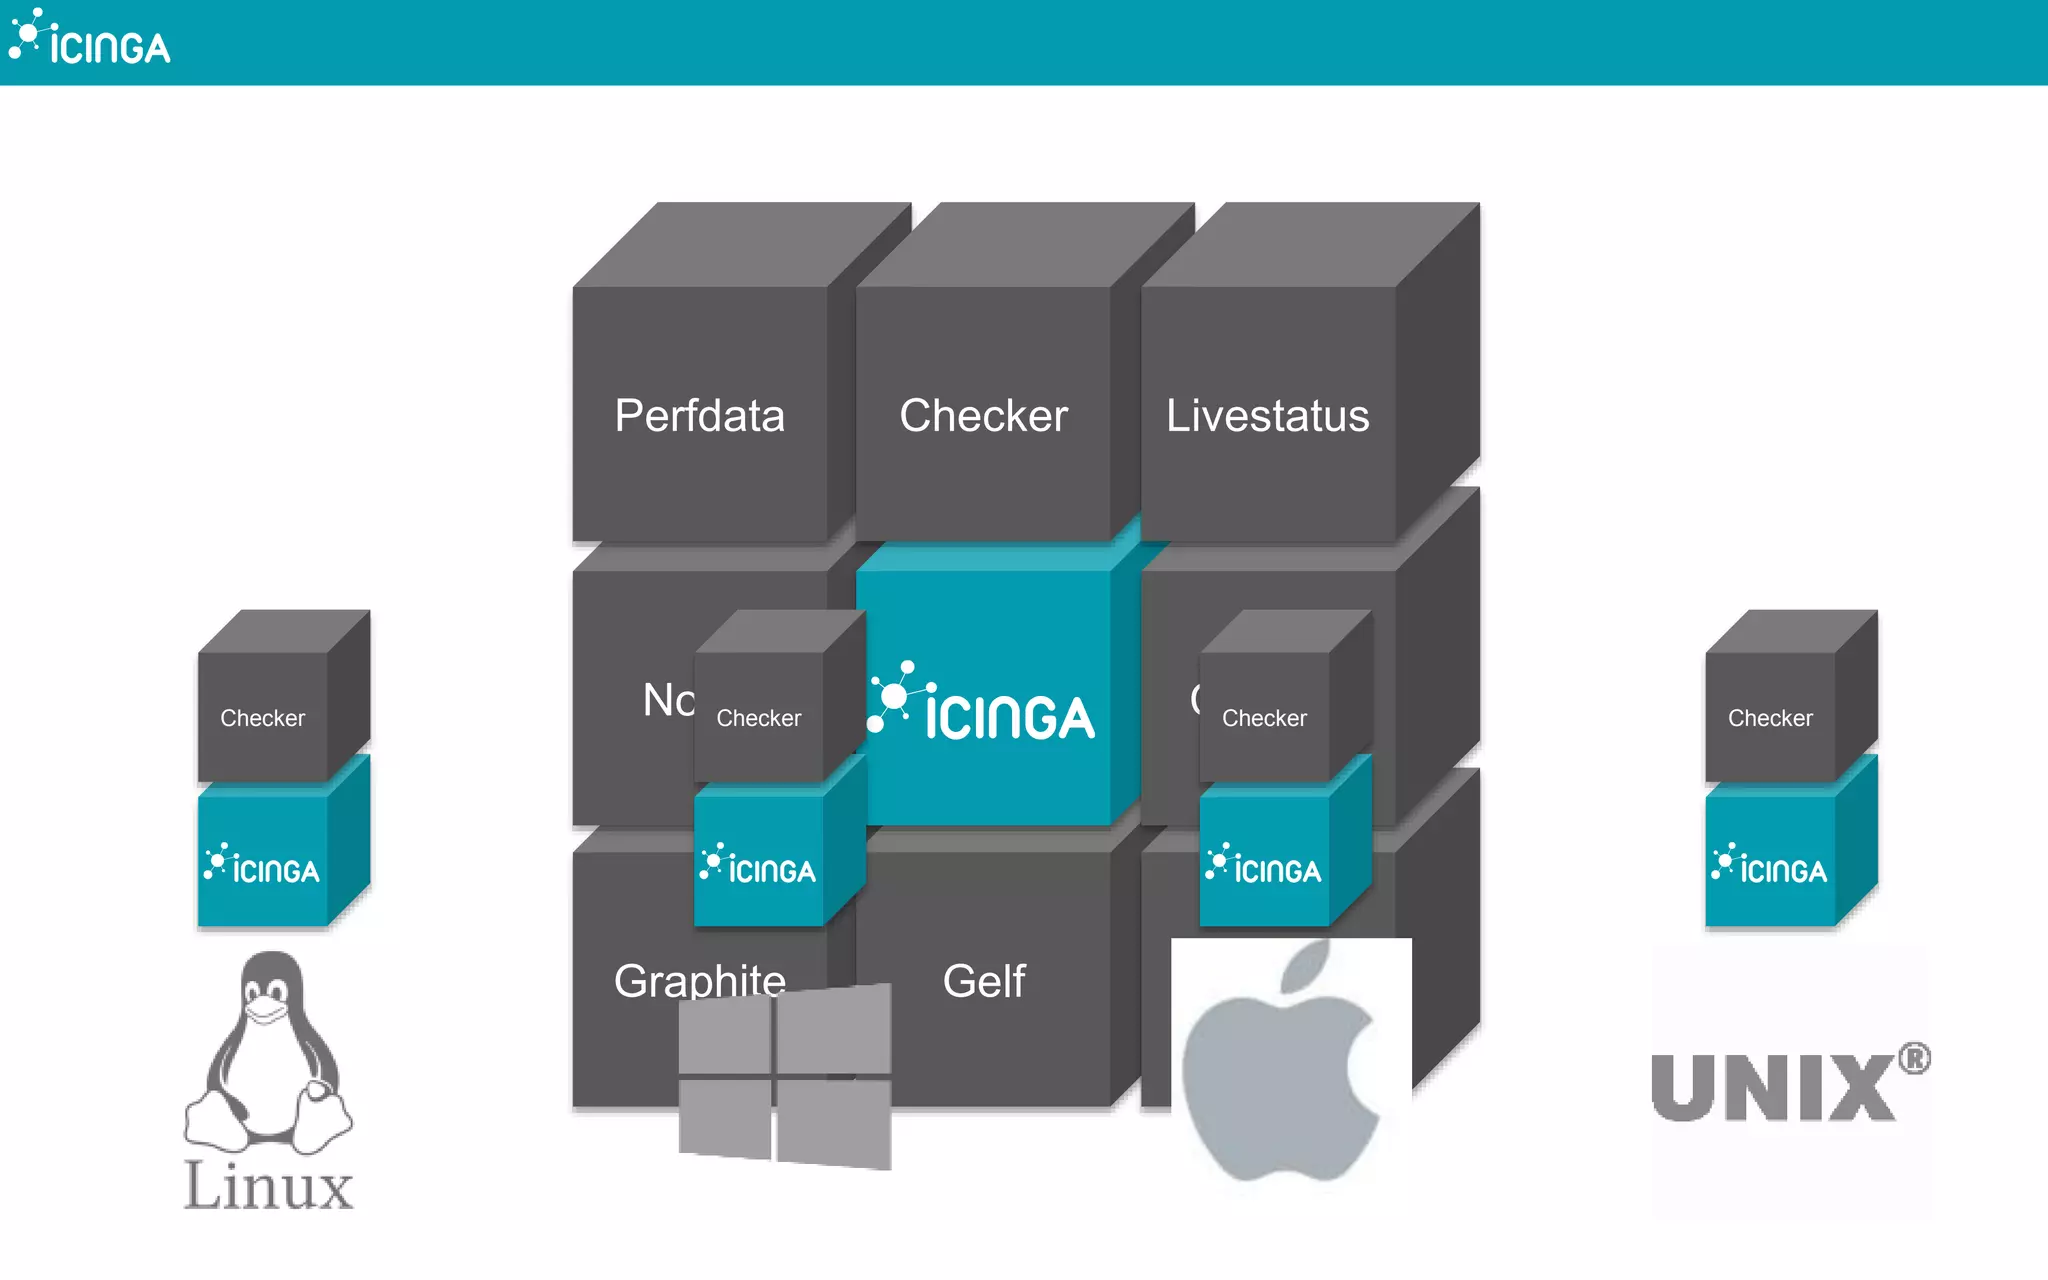
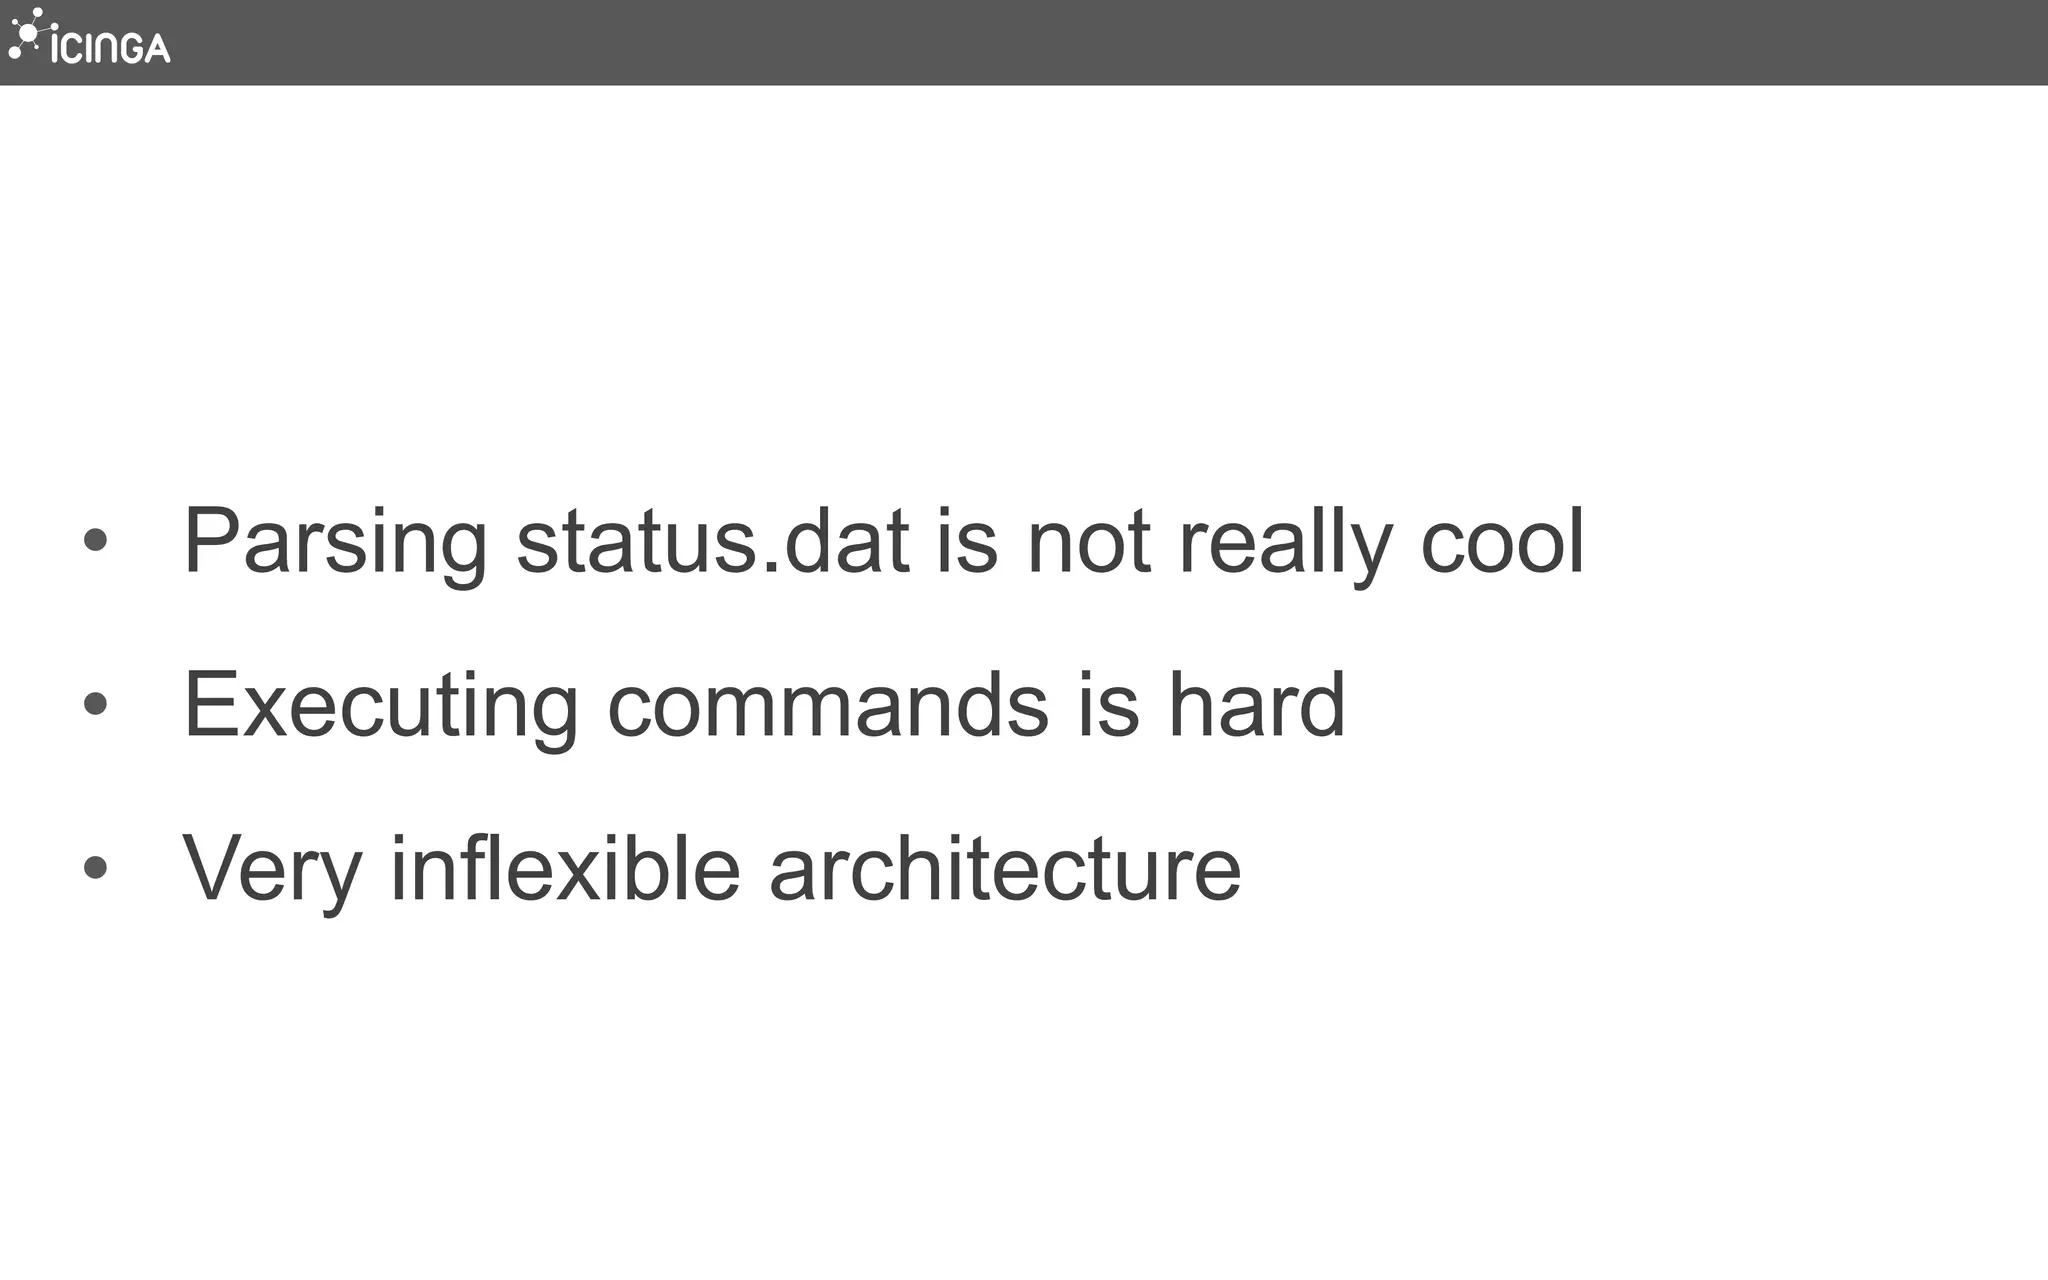
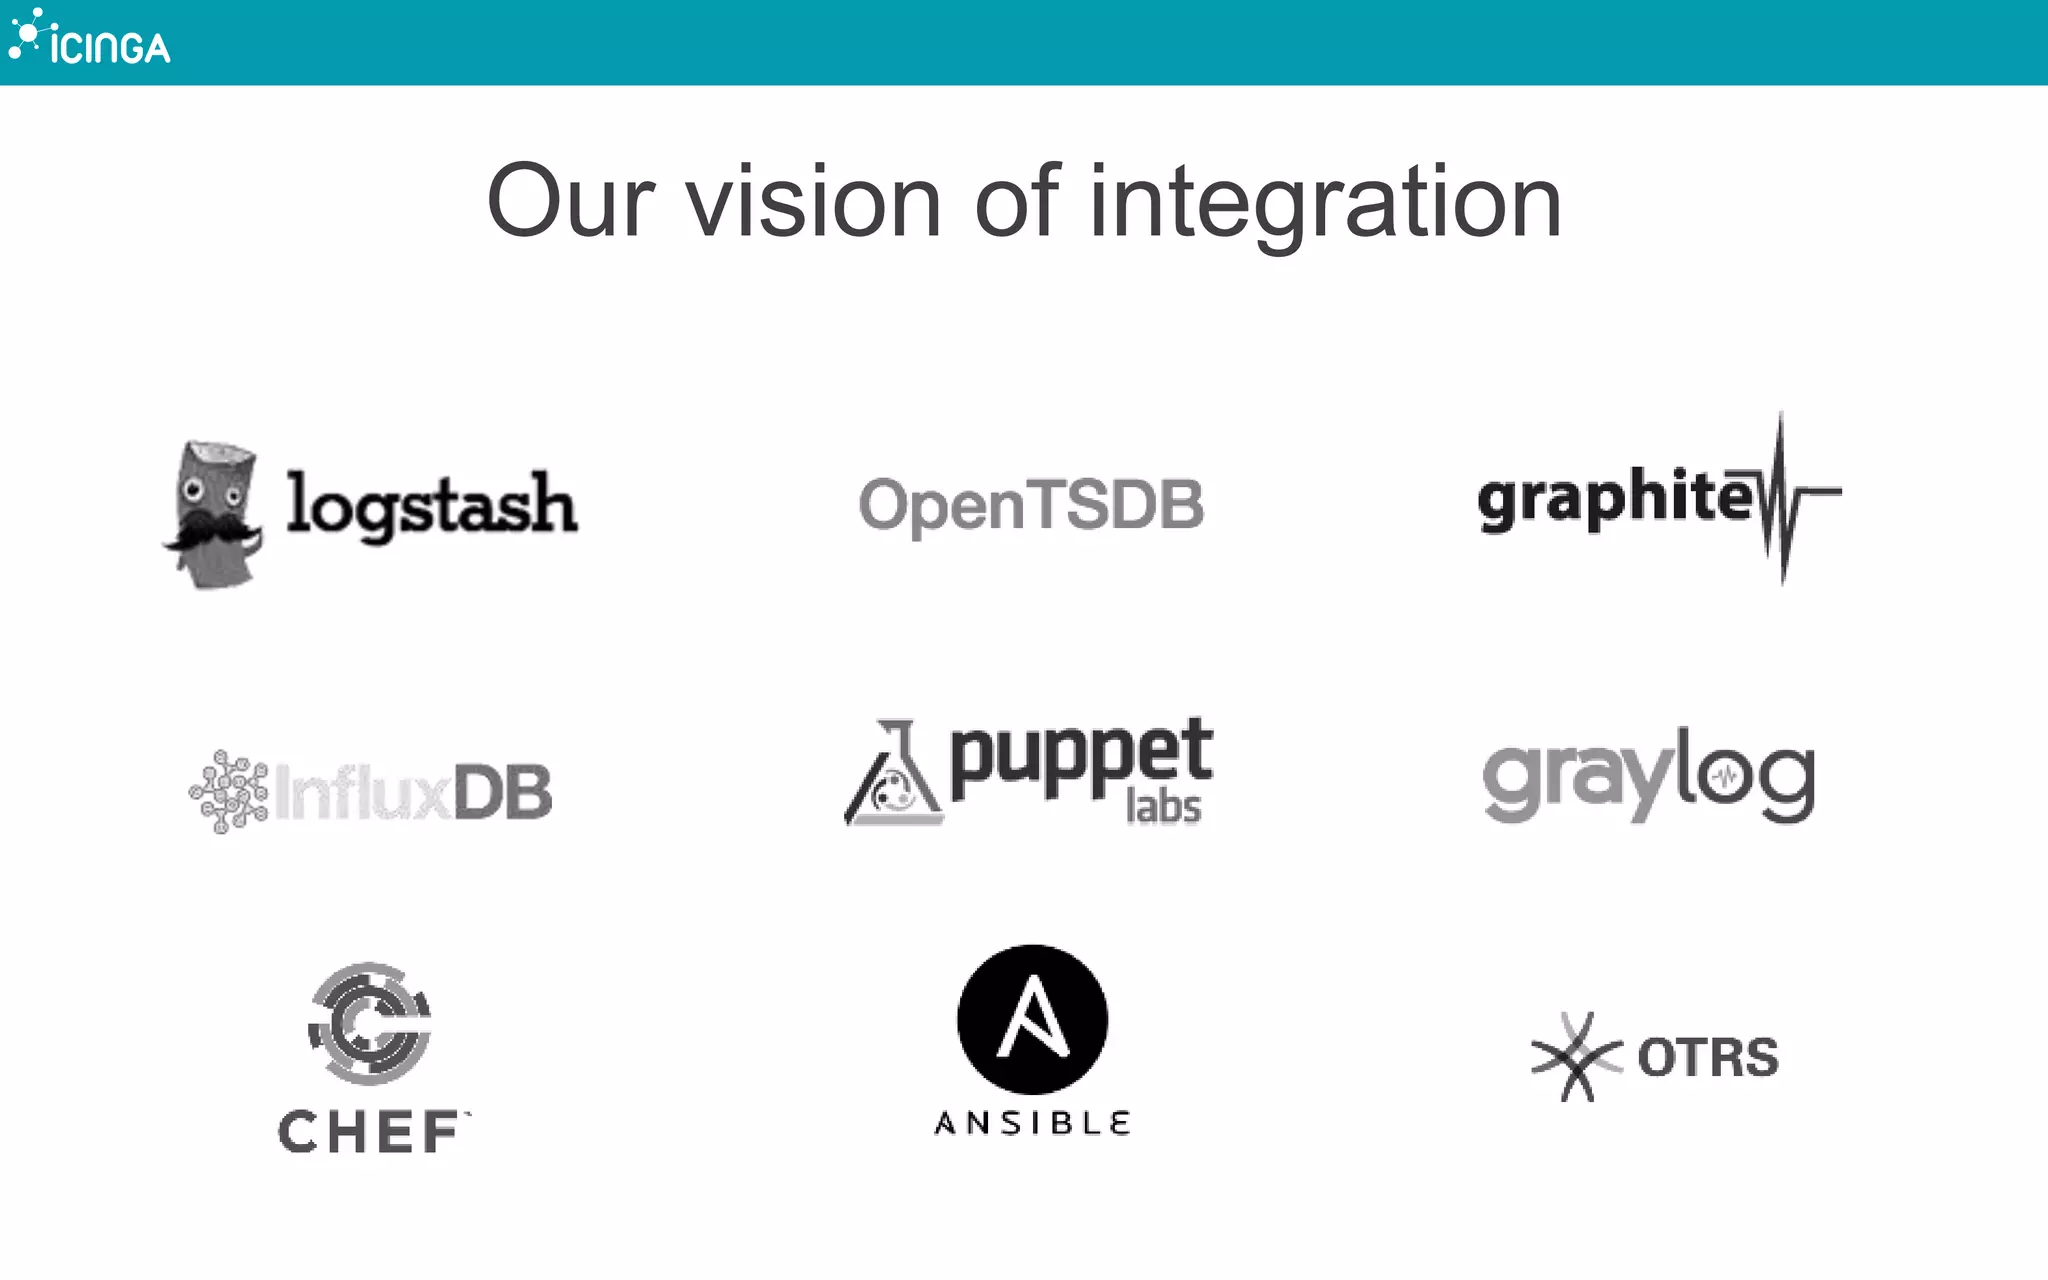
State of Development - Icinga Meetup Linz August 2019Icinga
Talk by Lead Icinga 2 Developer Michael Friedrich at the Icinga meetup on 22nd of August at OÖ Gesundheitsholding, Goethestraße 89, 4020 Linz - https://www.ooeg.at/
State of Development - Icinga Meetup Linz August 2019Icinga
Talk by Lead Icinga 2 Developer Michael Friedrich at the Icinga meetup on 22nd of August at OÖ Gesundheitsholding, Goethestraße 89, 4020 Linz - https://www.ooeg.at/
Icinga 2 API @ Icinga Camp Portland at PuppetlabsIcinga
Current state of development of the upcoming Icinga 2.4 unifying all interfaces into a general REST API. Includes demo snippets for AWS and Dashing integrations.
Icinga 2 API @ Icinga Camp Portland at PuppetlabsIcinga
Current state of development of the upcoming Icinga 2.4 unifying all interfaces into a general REST API. Includes demo snippets for AWS and Dashing integrations.
Icinga 2012 Development at 6th TF-NOC MeetingIcinga
Presentation about current Icinga development by Michael Friedrich at the 6th TF-NOC Meeting in Dublin.
Original Source: http://www.terena.org/activities/tf-noc/meeting6/programme.html
OSDC 2015: Bernd Erk | Why favour Icinga over NagiosNETWAYS
Most sys admins have a love-hate relationship with Nagios based monitoring solutions. Backed by a sizable community, users have learned to live with it’s shortcomings in scaling, configuration, and modern integration options.
Taking advantage of the tremendous number of supported hard- and software, Icinga leaves all legacy limitations behind. It delivers an easily scalable solution, with clustering, load balancing, automated replication, and even business process monitoring out-of-the-box. Based on a new configuration format with advanced language features - like conditional processing and complex type support - monitoring agile environments works like a breeze. Existing modules for Puppet, Chef and Ansible ramp up the rollout time and ensure a continuous and up to date monitoring environment.
The talk will demonstrate how popular tools such as Graphite, Logstash, or Graylog integrate better and easier than ever before. In addition to that we’ll introduce the new Icinga Web 2 interface and give a brief introduction into the technical architecture.
OSMC 2014 | Curret State of Icinga by Icinga TeamNETWAYS
Seit der ersten Preview auf der OSMC 2012 ist viel passiert und Icinga 2 ist seit einigen Monaten fertig. Neben verbesserter Performance und flexibler Architektur und zentrales und dezentrales Cluster, zeichnet sich Icinga 2 vor allem durch vereinfachte Konfiguration aus. Auch bei Icinga 1 sowie bei den verschiedenen Add-ons und Webinterfaces hat sich viel getan. Highlight des Vortrags wird die Vorstellung des neuen Webinterfaces Icinga Web 2. Neben einem aktuellen Status gibt der Vortrag einen Überblick über die kommenden Entwicklungen und zeigt die aktuellen Versionen in Live Demos.
OSMC 2014: Current state of Icinga | Icinga TeamNETWAYS
Seit der ersten Preview auf der OSMC 2012 ist viel passiert und Icinga 2 ist seit einigen Monaten fertig. Neben verbesserter Performance und flexibler Architektur und zentrales und dezentrales Cluster, zeichnet sich Icinga 2 vor allem durch vereinfachte Konfiguration aus. Auch bei Icinga 1 sowie bei den verschiedenen Add-ons und Webinterfaces hat sich viel getan. Highlight des Vortrags wird die Vorstellung des neuen Webinterfaces Icinga Web 2. Neben einem aktuellen Status gibt der Vortrag einen Überblick über die kommenden Entwicklungen und zeigt die aktuellen Versionen in Live Demos.
Thousands of running services on hundreds of machines ask the admins to pay attention. At all times, on all channels, with all available software packages that openSUSE has to offer.
Lars does not only keep an eye on all devices inside SUSE R&D, he is also maintaining some of the biggest packages in the server:monitoring repository like Nagios, Icinga, Shinken, check_mk, mod_gearman, Naemon, PNP4Nagios or the monitoring-plugins (and others).
The integration of some of those packages into a complex, secure and high available monitoring setup together with some tips and tricks and insights into the SUSE R&D infrastructure will be demonstrated.
I will be giving a brief overview of the history of NGINX along with an overview of the features and functionality in the project as it stands today. I will give some real use case of example of how NGINX can be used to solve problems and eliminate complexity within infrastructure. I will then dive into the future of the modern web and how NGINX is monitoring and leveraging industry changes to enhance the product for individuals and companies in the industry.
Nagios Conference 2014 - Mike Weber - Expanding NRDS Capabilities on Linux Sy...Nagios
Mike Weber's presentation on Expanding NRDS Capabilities on Linux Systems.
The presentation was given during the Nagios World Conference North America held Oct 13th - Oct 16th, 2014 in Saint Paul, MN. For more information on the conference (including photos and videos), visit: http://go.nagios.com/conference
Ansible is the simplest way to automate. MoldCamp, 2015Alex S
Ansible is a radically simple IT automation engine. This is new and great configuration management system (like Chef, Puppet) that has been created in 2012 year. Also Ansible is pretty simple and flexible system, that helps you in managing your servers and execute Ad-hoc commands.
During this session I will explain how to start using Ansible in infrastructure orchestration and what are pros and cons of this system. Also I will explain you our experience in deployments, provisioning and other aspects.
Make stateful apps in Kubernetes a no brainer with Pure Storage and GitOpsWeaveworks
The need for scale and acceleration of code to production are the main drivers behind the rapid adoption of Kubernetes in modern enterprises. Organizations are aiming to deploy thousands of cloud native applications, including stateful applications on premise, in a single cloud or across multiple clouds. Managing these workloads are complex and can often be a challenging task when it comes to automating operational tasks, rolling updates or migrations.
In this webinar Weaveworks and Pure will show you how integrated solutions such as the Weave Kubernetes Platform and Pure Service Orchestrator can save you valuable time through efficient, predictable and reliable operations.
NGINX ADC: Basics and Best Practices – EMEANGINX, Inc.
In this webinar we help you get started with NGINX, industry’s most ubiquitous web server and API gateway. We cover best practices for installing, configuring, and troubleshooting both NGINX Open Source and the enterprise-grade NGINX Plus. We provide insights about using NGINX Controller to manage your NGINX Plus instances.
Watch this webinar to learn:
- How to create NGINX configurations for web server, load balancer, etc.
- About improving performance using keepalives and other NGINX directives
- How the NGINX Controller Load Balancing Module can manage NGINX Plus instances at scale
- About augmenting your existing ADC with NGINX
https://www.nginx.com/resources/webinars/nginx-adc-basics-best-practices-emea/
Capacity planning is a difficult challenge faced by most companies. If you have too few machines, you will not have enough compute resources available to deal with heavy loads. On the other hand, if you have too many machines, you are wasting money. This is why companies have started investing in automatically scaling services and infrastructure to minimize the amount of wasted money and resources.
In this talk, Nathan will describe how Yelp is using PaaSTA, a PaaS built on top of open source tools including Docker, Mesos, Marathon, and Chronos, to automatically and gracefully scale services and the underlying cluster. He will go into detail about how this functionality was implemented and the design designs that were made while architecting the system. He will also provide a brief comparison of how this approach differs from existing solutions.
Upgrading Incident Management with Icinga - Icinga Camp Milan 2023Icinga
Talk by: Blerim Sheqa
We started an initiative to rebuild and upgrade the way how incidents are handled in Icinga. Our approach includes better contact management, easier configuration of notification rules and better accessibility through the Icinga web interface. In this talk we will guide you through our concepts and demonstrate the current state of development.
Extending Icinga Web with Modules: powerful, smart and easily created - Icing...Icinga
Talk by: Nicolas Schneider
At the Icinga Camp Berlin 2023 Nicolas shared his knowledge on how to build modules for Icinga Web. This time he will demonstrate what he has build so far, including extended functionalities to impersonate within Icinga Web, enforce team dashboards and many more.
Infrastructure Monitoring for Cloud Native Enterprises - Icinga Camp Milan 2023Icinga
Talk by: Simone Nocentini and Vladimir Mozharov
Being a manged service provider comes with its very own challenges, especially when it comes to monitoring. In this session we will dive in into Kiratech’s infrastructure to get an overview from the provider and the client perspective, and what it takes to monitor a variety of technologies with Icinga. The strategy contains an approach of deploying Icinga with Ansible for comprehensive visibility and linking it with FreshService for seamless integration. We will have an outlook to future projects including event-driven automations, Icinga-style observability and application monitoring.
Incident management: Best industry practices your team should know - Icinga C...Icinga
Talk by: Birol Yildiz
Developers and OPS engineers face the relentless challenge of responding to incidents swiftly and effectively, ensuring seamless system operations and customer satisfaction. At this talk attendants will learn how to implement proactive alerting strategies, effectively triage incidents, and collaborate seamlessly during high-pressure situations.
Monitoring Cooling Units in a pharmaceutical GxP regulated environment - Icin...Icinga
Talk by: Felix Joussein
Icinga is used to monitor and alert in case of temperature deviations in a GxP (pharmaceutical industry) regulated environment. The holy grale in a laboratpry environment are the study samples (animal but also human). So regulators (EMA, FDA,..) around the world want to ensure, that the sample-stability is at it’s best. To ensure this, depending on the known stability, certain temperature ranges in cooling-units are defined and have to be trackable thourghout the whole lifecycle of such a sample.
SNMP Monitoring at scale - Icinga Camp Milan 2023Icinga
Talk by: Rocco Pezzani and Thomas Gelf
This presentation unveils a new addon component for the Icinga ecosystem, developed in collaboration with Würth Phoenix and with the support of Irideos. It enables distributed SNMP network monitoring for large segmented networks, capable of monitoring huge numbers of devices in near real-time, while displaying trend graphs for sensor and performance metrics.
An interactive MIB browser with distributed SNMP polling support and some nice network device visualization components will also be shown.
Monitoring Kubernetes with Icinga - Icinga Camp Milan 2023Icinga
Talk by: Eric Lippmann
We recently started researching and developing a Module for Icinga to monitor Kubernetes environments. During the past months we learned a lot about the platform and how we can monitor Kubernetes with Icinga efficiently. In this talk I will present our challenges but also the progress that we made. The talk will include a sneak peak into the current state of the Module and outline our vision of monitoring Kubernetes with Icinga.
Current State of Icinga - Icinga Camp Milan 2023Icinga
Talk by: Bernd Erk
This talk is a summary of all news and updates of the last months. We will cover all relevant fields and share updates about the current state of Icinga.
Efficient IT operations using monitoring systems and standardized tools - Ici...Icinga
Talk by: Magnus Lübeck
This talk will discuss Icinga as the “one stop shop” for finding the “single truth of systems state”. KMG Group use a “four field” model when designing systems, where Icinga have an important place in a section called “technical monitoring/technical performance monitoring”. We touch two methodologies (MOPS – Metrics, Operational tools, Processes, and Metrics), and Ted Dziuba’s actionable response to monitoring events.
Talk by: Stefano Bruno
Tornado is a high performance and scalable application written in Rust. It is able to handle millions of events each second on standard server hardware. The main objective of this talk is to show how you can extend an Icinga2 with Tornado through the three main modules: Tornado data collector, Tornado rule engine, Tornado executor. With Tornado we will able to receive events from different channels like SNMP Trap, Syslog, Email, SMS, Telegram and match them against a rule engine and decide which action to associate.
Talk by: Simon Gerber
Signalilo is a small webhook server for ingesting Prometheus alerts into Icinga2. Our motivation for creating Signalilo was to integrate alerts from existing Prometheus-based monitoring suites (e.g. for OpenShift Container Platform) into our company-wide Icinga2. Signalilo is currently deployed on 10 OpenShift clusters and forwards Prometheus alerts to Icinga2.
In this talk, I will present the basic design of Signalilo and give a short overview of how we use Signalilo in our production monitoring to forward Prometheus alerts to Icinga2.
Moving from Icinga 1 to Icinga 2 + Director - Icinga Camp Zurich 2019Icinga
Talk by: Christof Hanke
The Max Planck Computing and Data Facility (MPCDF, formerly known as RZG) is using Icinga / Nagios for more than 10 years now. We have/had several instances for different areas, such as miscellaneous servers, clusters or even EU-Projects spanning several European sites. This talk is about our (still ongoing) transition from our icinga1 installation for general servers which is based on many config-files, changed by two people only, to a director based self-service. The goal is that our fellow admins can integrate new hosts by a few steps. The configuration is declarative. In the host-object they just choose templates and fill in fields and arrays. The actual icinga2-configuration is then done via apply-rules.
Icinga Director and vSphereDB - how they play together - Icinga Camp Zurich 2019Icinga
Talk by: Thomas Gelf
While the Icinga Director is the main configuration tool for Icinga, vSphereDB is a completely different beast. Icinga models everything around Hosts and Services, vSphereDB instead discovers your whole VMware infrastructure and builds a huge and deep inventory.
This talk wants to explain the reasoning behind this, shows what’s possible right now and where those powerful Icinga components are heading to in the near future.
NetEye 4 based on Icinga 2 - Icinga Camp Milan 2019Icinga
Talk by Michele Santuari:
This slot will give insights in the new architecture of the actual NetEye 4 version based on Icinga 2, allowing further scalability to perform also complex event processing (CEP) over a large number of event streams. CEP scenarios will process the events based on the resource consumption limits. The ability to do fast in-memory processing of events such as filtering, grouping and aggregating this way enables to do real time analysis.
Integrating Icinga 2 and ntopng - Icinga Camp Milan 2019Icinga
Talk by Simone Mainardi:
Icinga2 offers useful checks when it comes to monitoring hosts and services in the network. It can ping, test HTTP and DNS services, or establish network connections to make sure everything is up and running. However, such checks are not always enough to ensure the network is operating smoothly with healthy hosts and services. Can you be sure there is no unwanted traffic towards hosts believed to be malicious? What about unencrypted communications and weak TLS? Why has the throughput of an host surged today?
This talk discusses how Icinga2 can be integrated with ntopng to bring network checks a step forward. ntopng, a widely-known network visibility tool, will be used in combination with Icinga2 to create a framework for the timely detection of unwanted or suspicious activities in the network, beyond basic up-or-down checks.
DevOps monitoring: Best Practices using OpenShift combined with Icinga & Big ...Icinga
Talk by Marco Bizzantino:
In my talk I will demonstrate how monitoring works with the DevOps approach. Within an organisation, different people with different roles need to have a complete view over the whole infrastructure. One of the greatest benefits of Icinga is its ability to integrate with various tools and modules to satisfy the company’s requests. An example is OpenShift monitoring. I will point out the most important parts of monitoring OpenShift infrastructure while maintaining it’s complexity. In my approach I will show how we combine Icinga, Prometheus, Grafana and Elasticsearch for an overall OpenShift monitoring solution. Additional examples will show the benefits of using Icinga’s Business Process modelling to add more value to the result.
Best of Icinga Modules - Icinga Camp Milan 2019Icinga
Talk by Bernd Erk:
Humans are creatures of habit – we have our environments, our tasks, our routine. Building up a routine takes a lot out of us – so as soon as we find something that works for us we stick with it. But is it effective? Are there tools that can make our life so much easier if we manage to integrate them into our routine? Of course, we’re in IT, there are always new and good tools! Only 2 more hurdles to clear – find the right tools for you and actually make the effort to integrate them into your routine.
The purpose of this talk is to help you with exactly that – I will show you the most important quality-of-life modules and add-ons for Icinga.All of them officially supported by the Icinga team and super easy to integrate into your system!
hallenges of Monitoring Big Infrastructure - Icinga Camp Milan 2019Icinga
Talk by Blerim Sheqa:
Most monitoring environments are automated with configuration management tools like Puppet, Chef or Ansible. While these tools solve many problems, such as the initial setup, reproducibility and visibility, there are many other challenges that need to be tackled to truly monitor big environments. As a vendor of monitoring software, Icinga came up with unique approaches to solve some extraordinary problems to monitor large scale infrastructures. The methods are a result of real world problems as seen in the wild and applicable to many scenarios.
Slack (or Teams) Automation for Bonterra Impact Management (fka Social Soluti...Jeffrey Haguewood
Sidekick Solutions uses Bonterra Impact Management (fka Social Solutions Apricot) and automation solutions to integrate data for business workflows.
We believe integration and automation are essential to user experience and the promise of efficient work through technology. Automation is the critical ingredient to realizing that full vision. We develop integration products and services for Bonterra Case Management software to support the deployment of automations for a variety of use cases.
This video focuses on the notifications, alerts, and approval requests using Slack for Bonterra Impact Management. The solutions covered in this webinar can also be deployed for Microsoft Teams.
Interested in deploying notification automations for Bonterra Impact Management? Contact us at sales@sidekicksolutionsllc.com to discuss next steps.
GraphRAG is All You need? LLM & Knowledge GraphGuy Korland
Guy Korland, CEO and Co-founder of FalkorDB, will review two articles on the integration of language models with knowledge graphs.
1. Unifying Large Language Models and Knowledge Graphs: A Roadmap.
https://arxiv.org/abs/2306.08302
2. Microsoft Research's GraphRAG paper and a review paper on various uses of knowledge graphs:
https://www.microsoft.com/en-us/research/blog/graphrag-unlocking-llm-discovery-on-narrative-private-data/
LF Energy Webinar: Electrical Grid Modelling and Simulation Through PowSyBl -...DanBrown980551
Do you want to learn how to model and simulate an electrical network from scratch in under an hour?
Then welcome to this PowSyBl workshop, hosted by Rte, the French Transmission System Operator (TSO)!
During the webinar, you will discover the PowSyBl ecosystem as well as handle and study an electrical network through an interactive Python notebook.
PowSyBl is an open source project hosted by LF Energy, which offers a comprehensive set of features for electrical grid modelling and simulation. Among other advanced features, PowSyBl provides:
- A fully editable and extendable library for grid component modelling;
- Visualization tools to display your network;
- Grid simulation tools, such as power flows, security analyses (with or without remedial actions) and sensitivity analyses;
The framework is mostly written in Java, with a Python binding so that Python developers can access PowSyBl functionalities as well.
What you will learn during the webinar:
- For beginners: discover PowSyBl's functionalities through a quick general presentation and the notebook, without needing any expert coding skills;
- For advanced developers: master the skills to efficiently apply PowSyBl functionalities to your real-world scenarios.
Key Trends Shaping the Future of Infrastructure.pdfCheryl Hung
Keynote at DIGIT West Expo, Glasgow on 29 May 2024.
Cheryl Hung, ochery.com
Sr Director, Infrastructure Ecosystem, Arm.
The key trends across hardware, cloud and open-source; exploring how these areas are likely to mature and develop over the short and long-term, and then considering how organisations can position themselves to adapt and thrive.
Software Delivery At the Speed of AI: Inflectra Invests In AI-Powered QualityInflectra
In this insightful webinar, Inflectra explores how artificial intelligence (AI) is transforming software development and testing. Discover how AI-powered tools are revolutionizing every stage of the software development lifecycle (SDLC), from design and prototyping to testing, deployment, and monitoring.
Learn about:
• The Future of Testing: How AI is shifting testing towards verification, analysis, and higher-level skills, while reducing repetitive tasks.
• Test Automation: How AI-powered test case generation, optimization, and self-healing tests are making testing more efficient and effective.
• Visual Testing: Explore the emerging capabilities of AI in visual testing and how it's set to revolutionize UI verification.
• Inflectra's AI Solutions: See demonstrations of Inflectra's cutting-edge AI tools like the ChatGPT plugin and Azure Open AI platform, designed to streamline your testing process.
Whether you're a developer, tester, or QA professional, this webinar will give you valuable insights into how AI is shaping the future of software delivery.
Securing your Kubernetes cluster_ a step-by-step guide to success !KatiaHIMEUR1
Today, after several years of existence, an extremely active community and an ultra-dynamic ecosystem, Kubernetes has established itself as the de facto standard in container orchestration. Thanks to a wide range of managed services, it has never been so easy to set up a ready-to-use Kubernetes cluster.
However, this ease of use means that the subject of security in Kubernetes is often left for later, or even neglected. This exposes companies to significant risks.
In this talk, I'll show you step-by-step how to secure your Kubernetes cluster for greater peace of mind and reliability.
State of ICS and IoT Cyber Threat Landscape Report 2024 previewPrayukth K V
The IoT and OT threat landscape report has been prepared by the Threat Research Team at Sectrio using data from Sectrio, cyber threat intelligence farming facilities spread across over 85 cities around the world. In addition, Sectrio also runs AI-based advanced threat and payload engagement facilities that serve as sinks to attract and engage sophisticated threat actors, and newer malware including new variants and latent threats that are at an earlier stage of development.
The latest edition of the OT/ICS and IoT security Threat Landscape Report 2024 also covers:
State of global ICS asset and network exposure
Sectoral targets and attacks as well as the cost of ransom
Global APT activity, AI usage, actor and tactic profiles, and implications
Rise in volumes of AI-powered cyberattacks
Major cyber events in 2024
Malware and malicious payload trends
Cyberattack types and targets
Vulnerability exploit attempts on CVEs
Attacks on counties – USA
Expansion of bot farms – how, where, and why
In-depth analysis of the cyber threat landscape across North America, South America, Europe, APAC, and the Middle East
Why are attacks on smart factories rising?
Cyber risk predictions
Axis of attacks – Europe
Systemic attacks in the Middle East
Download the full report from here:
https://sectrio.com/resources/ot-threat-landscape-reports/sectrio-releases-ot-ics-and-iot-security-threat-landscape-report-2024/
Connector Corner: Automate dynamic content and events by pushing a buttonDianaGray10
Here is something new! In our next Connector Corner webinar, we will demonstrate how you can use a single workflow to:
Create a campaign using Mailchimp with merge tags/fields
Send an interactive Slack channel message (using buttons)
Have the message received by managers and peers along with a test email for review
But there’s more:
In a second workflow supporting the same use case, you’ll see:
Your campaign sent to target colleagues for approval
If the “Approve” button is clicked, a Jira/Zendesk ticket is created for the marketing design team
But—if the “Reject” button is pushed, colleagues will be alerted via Slack message
Join us to learn more about this new, human-in-the-loop capability, brought to you by Integration Service connectors.
And...
Speakers:
Akshay Agnihotri, Product Manager
Charlie Greenberg, Host
Accelerate your Kubernetes clusters with Varnish CachingThijs Feryn
A presentation about the usage and availability of Varnish on Kubernetes. This talk explores the capabilities of Varnish caching and shows how to use the Varnish Helm chart to deploy it to Kubernetes.
This presentation was delivered at K8SUG Singapore. See https://feryn.eu/presentations/accelerate-your-kubernetes-clusters-with-varnish-caching-k8sug-singapore-28-2024 for more details.
Elevating Tactical DDD Patterns Through Object CalisthenicsDorra BARTAGUIZ
After immersing yourself in the blue book and its red counterpart, attending DDD-focused conferences, and applying tactical patterns, you're left with a crucial question: How do I ensure my design is effective? Tactical patterns within Domain-Driven Design (DDD) serve as guiding principles for creating clear and manageable domain models. However, achieving success with these patterns requires additional guidance. Interestingly, we've observed that a set of constraints initially designed for training purposes remarkably aligns with effective pattern implementation, offering a more ‘mechanical’ approach. Let's explore together how Object Calisthenics can elevate the design of your tactical DDD patterns, offering concrete help for those venturing into DDD for the first time!
Neuro-symbolic is not enough, we need neuro-*semantic*Frank van Harmelen
Neuro-symbolic (NeSy) AI is on the rise. However, simply machine learning on just any symbolic structure is not sufficient to really harvest the gains of NeSy. These will only be gained when the symbolic structures have an actual semantics. I give an operational definition of semantics as “predictable inference”.
All of this illustrated with link prediction over knowledge graphs, but the argument is general.
6. Open Source Enterprise Monitoring
Icinga is a scalable and extensible monitoring system
which checks the availability of your resources, notifies
users of outages and provides extensive BI data.
7. • Originally forked from Nagios in 2009
• Independent version Icinga 2 since 2014
9. Icinga Web 2
Icinga 2
Icinga
Icinga Quality, Testing and Community Support
Icinga.org, dev.icinga.org, social media channels
Icinga Reports Icinga Doc
3rd Party Tools
Icinga Web
Icinga Classic (CGI)