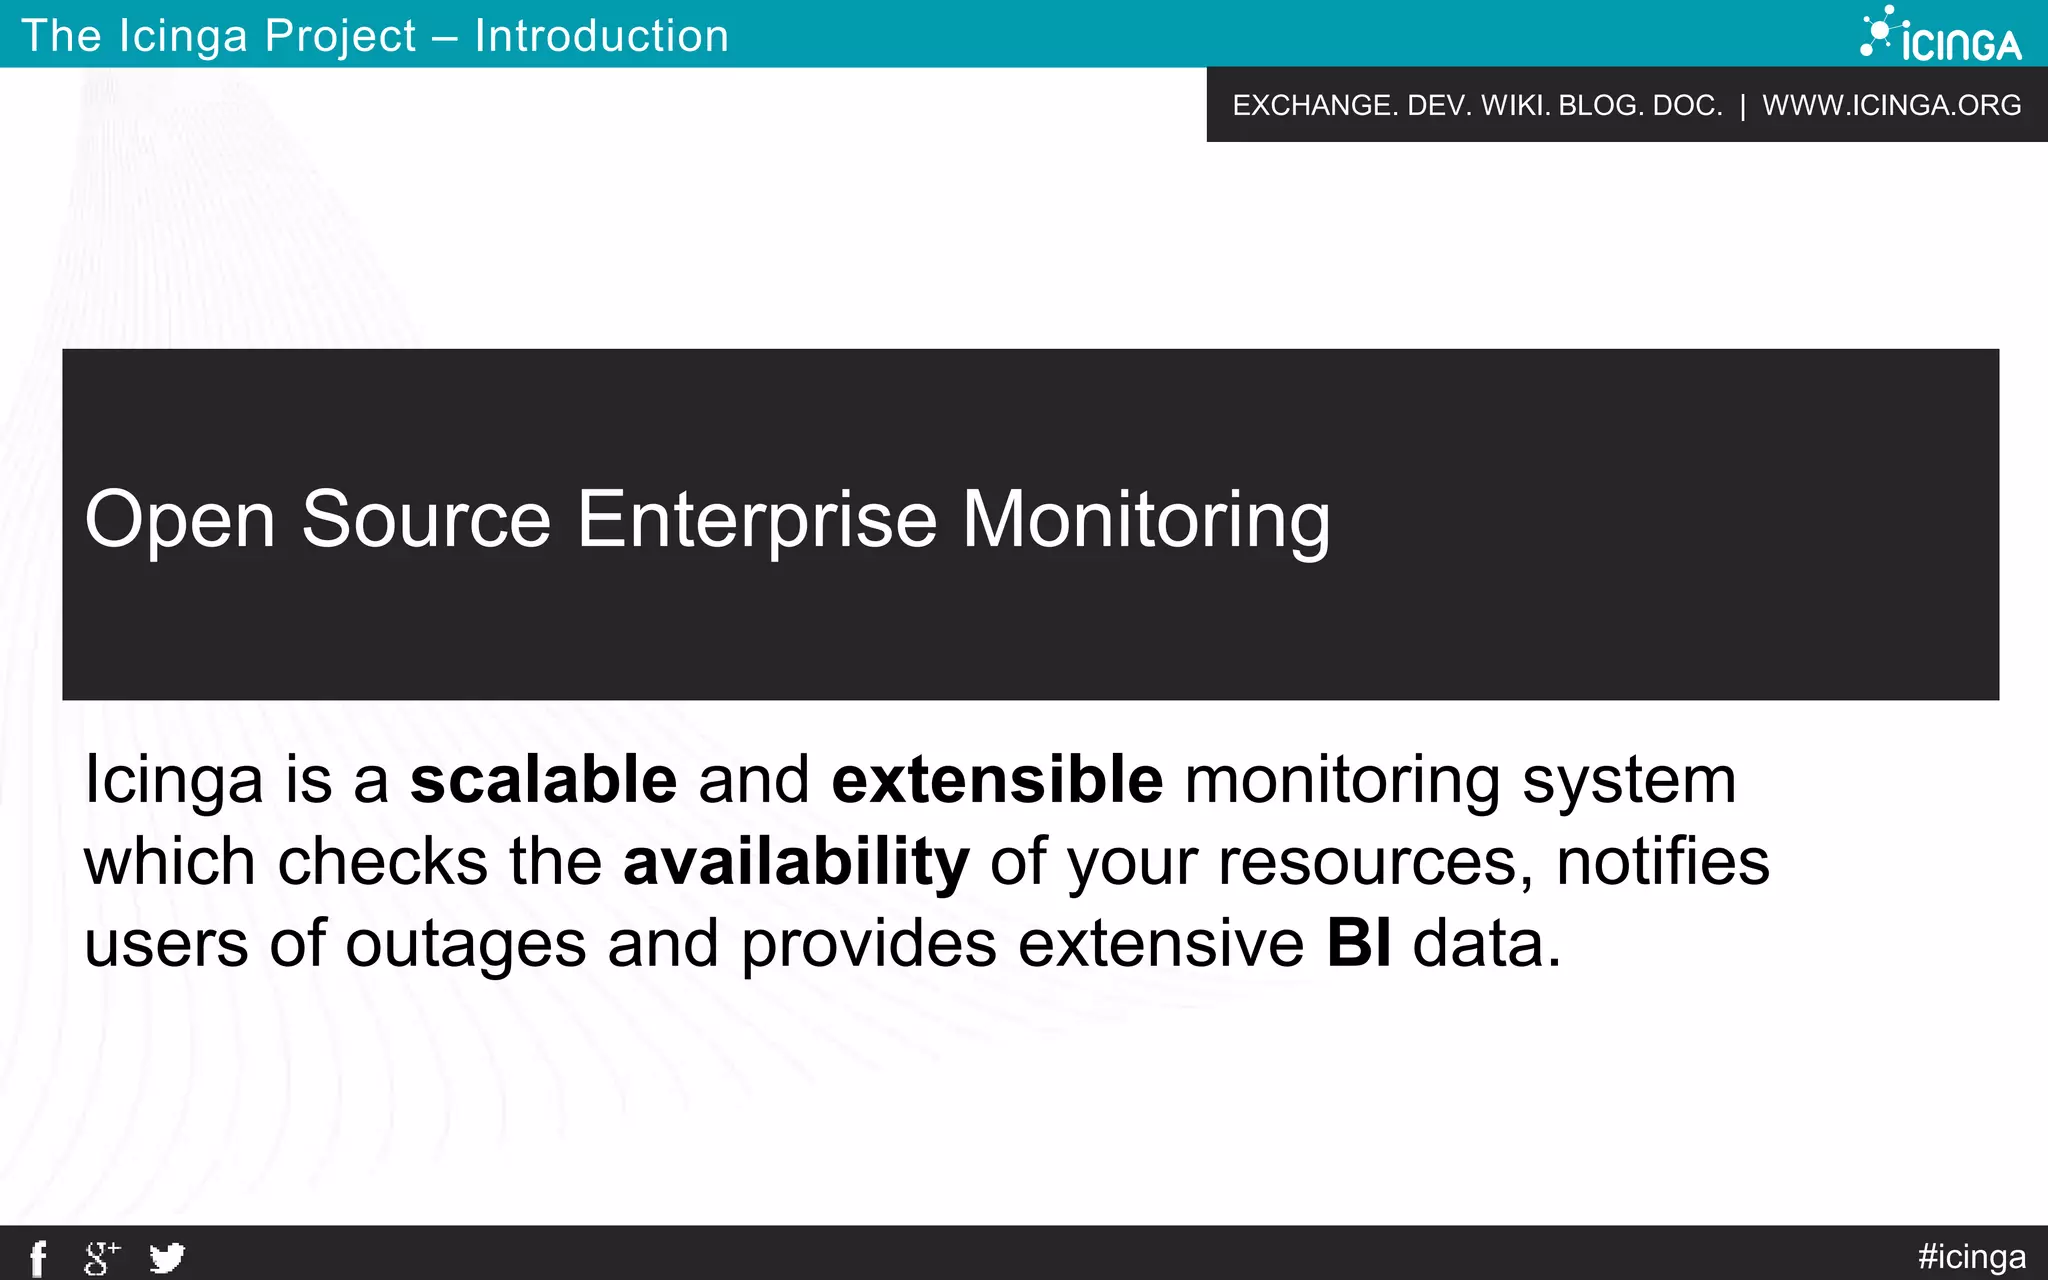
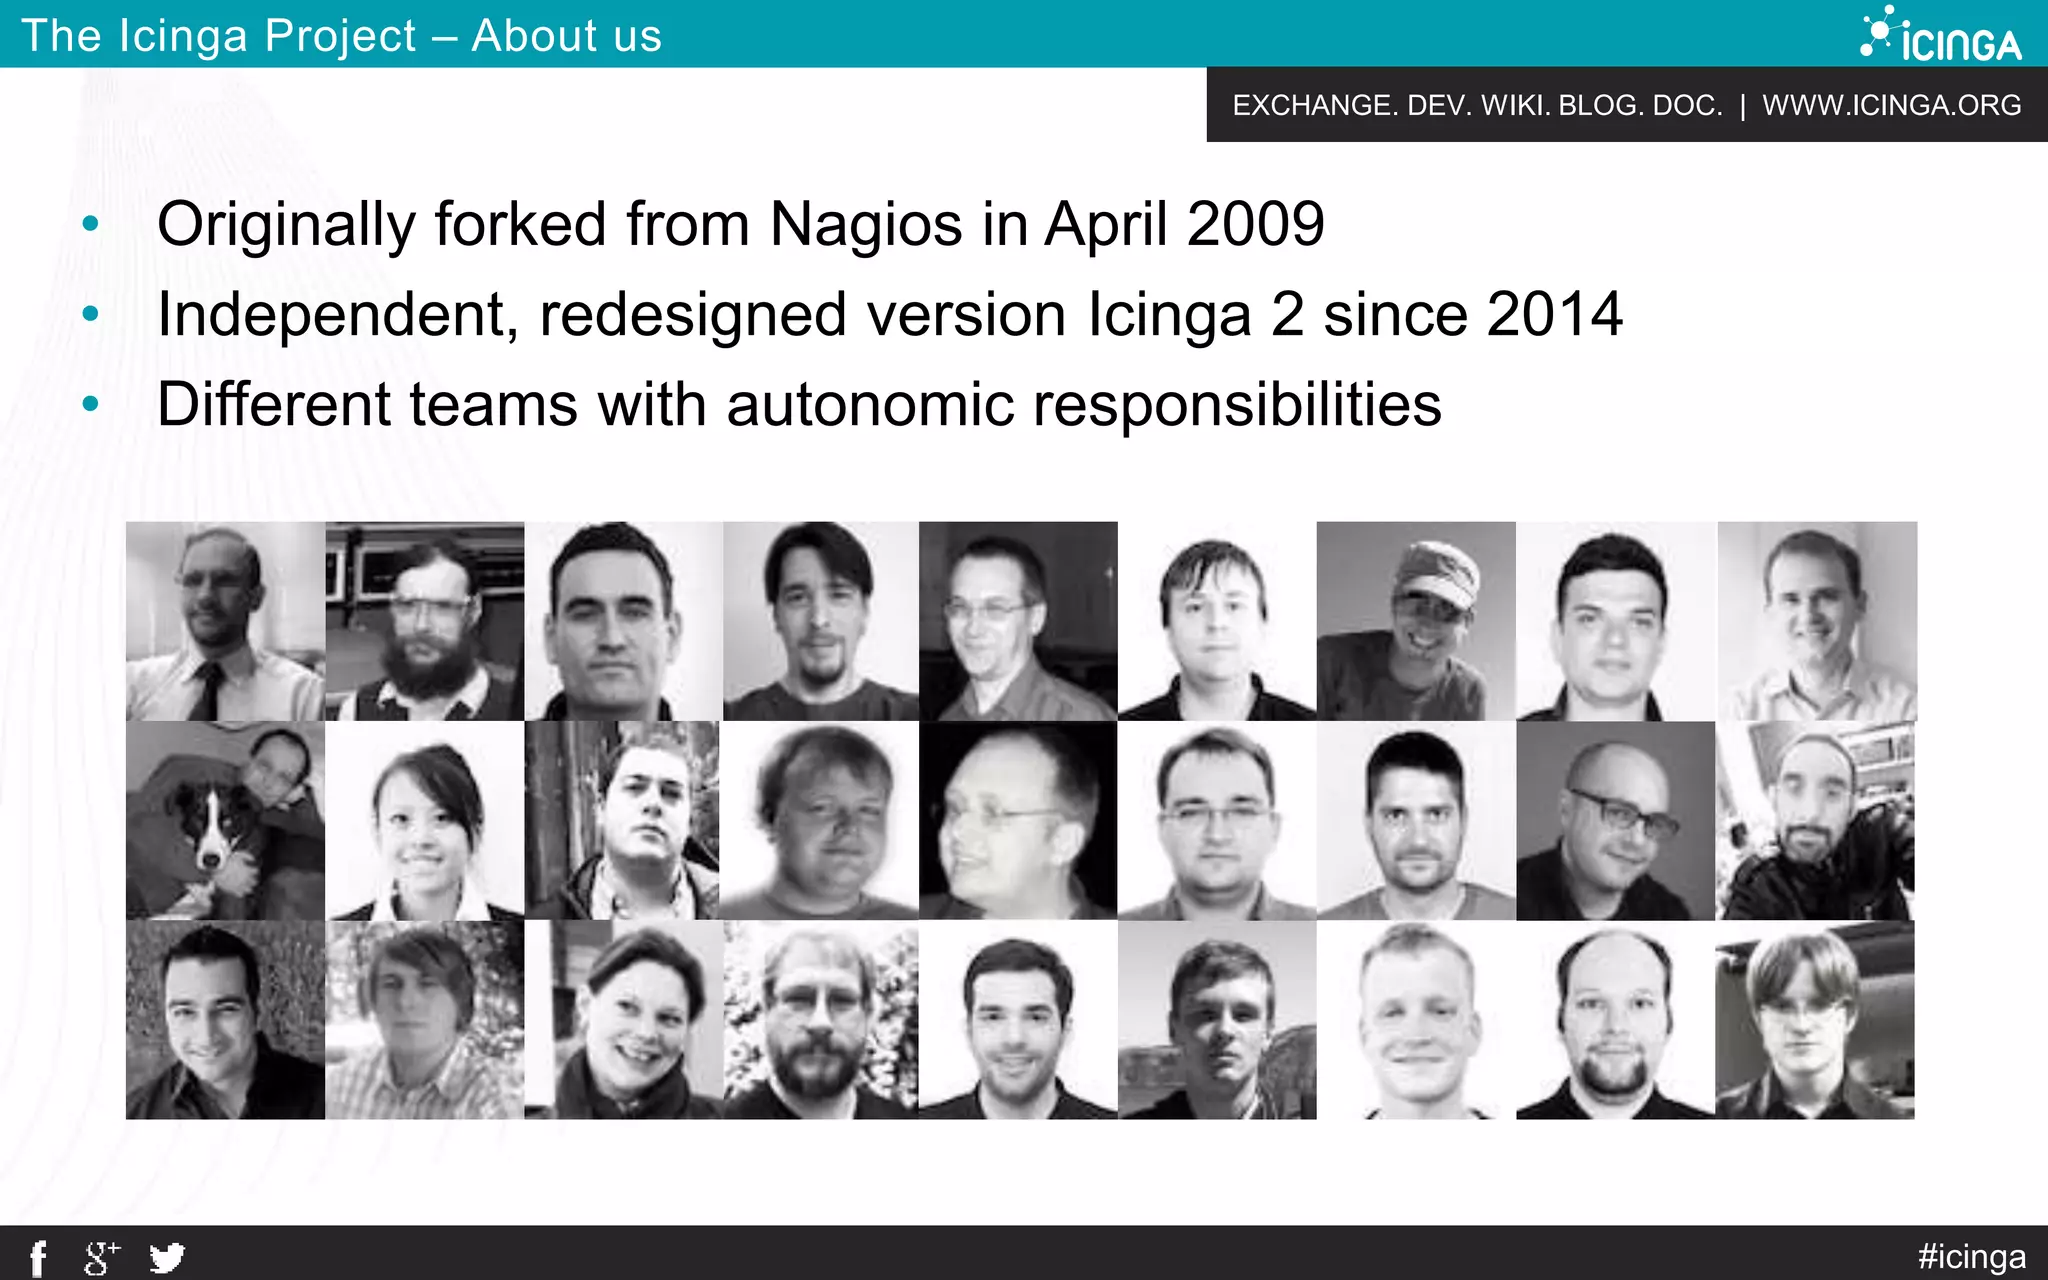
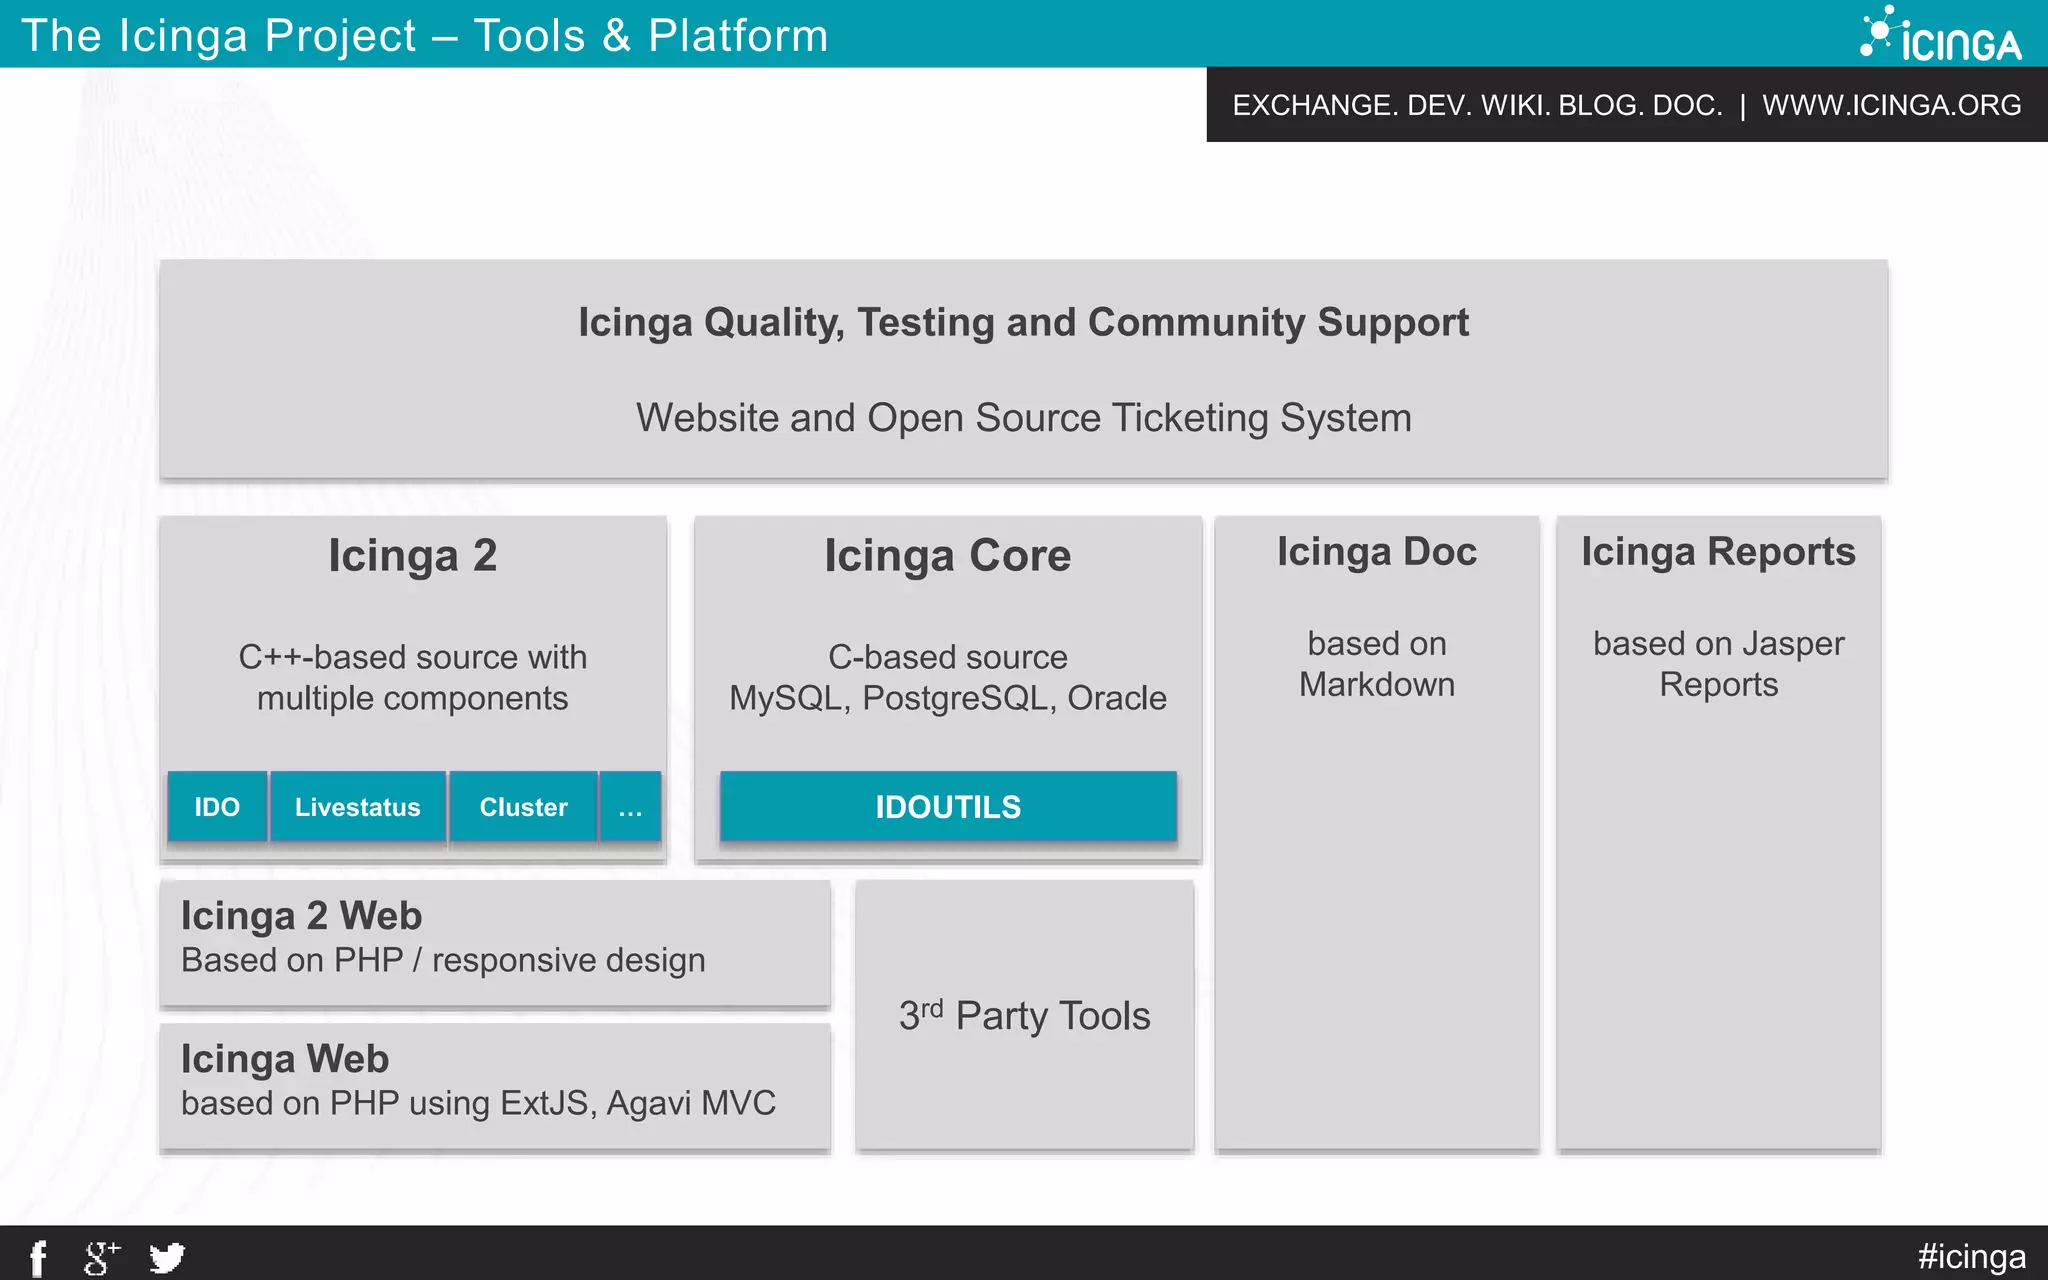
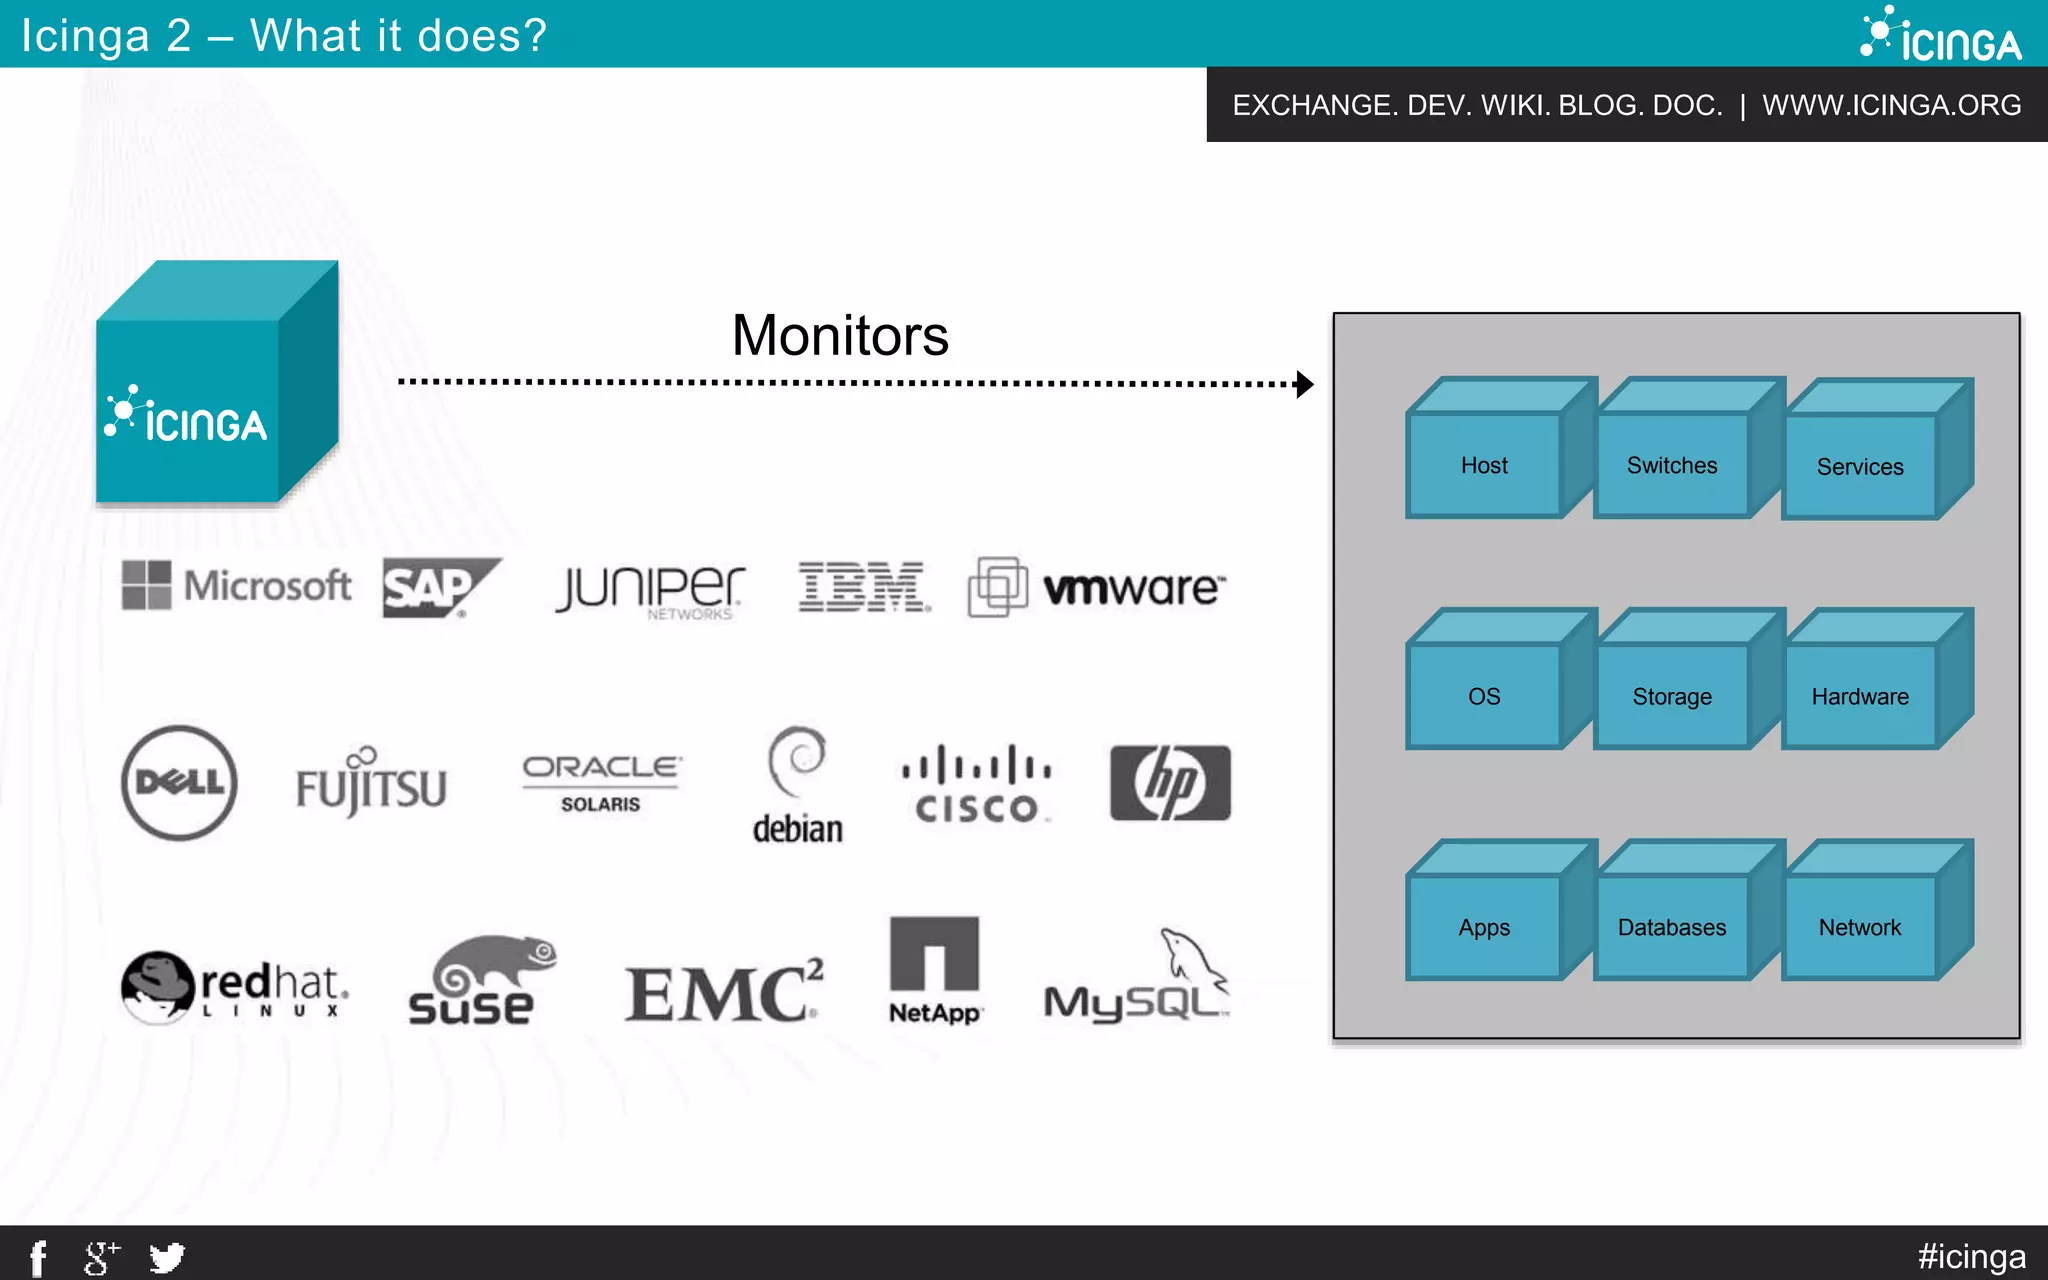
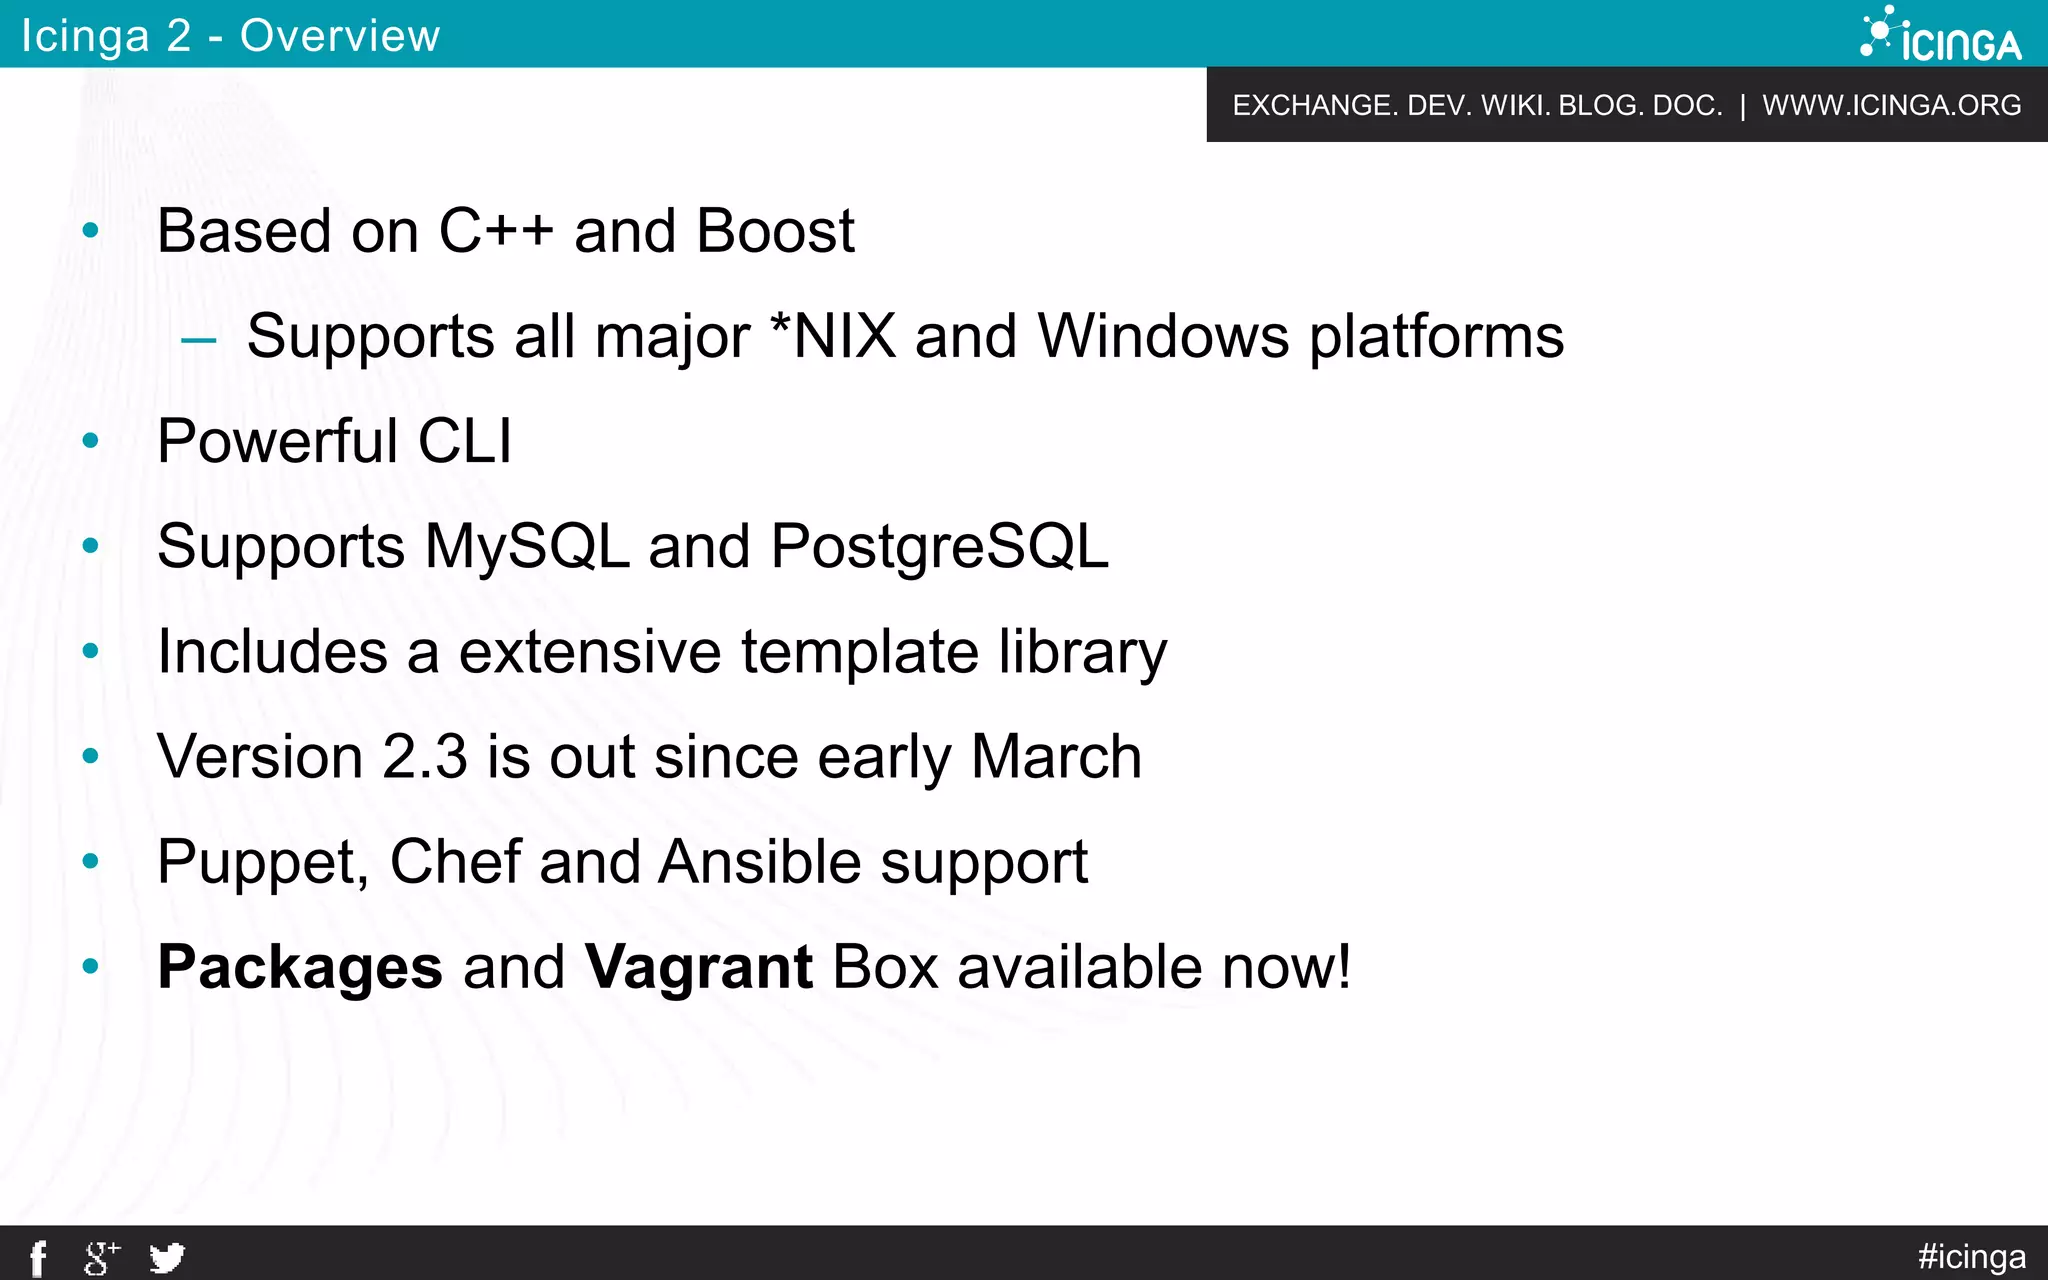
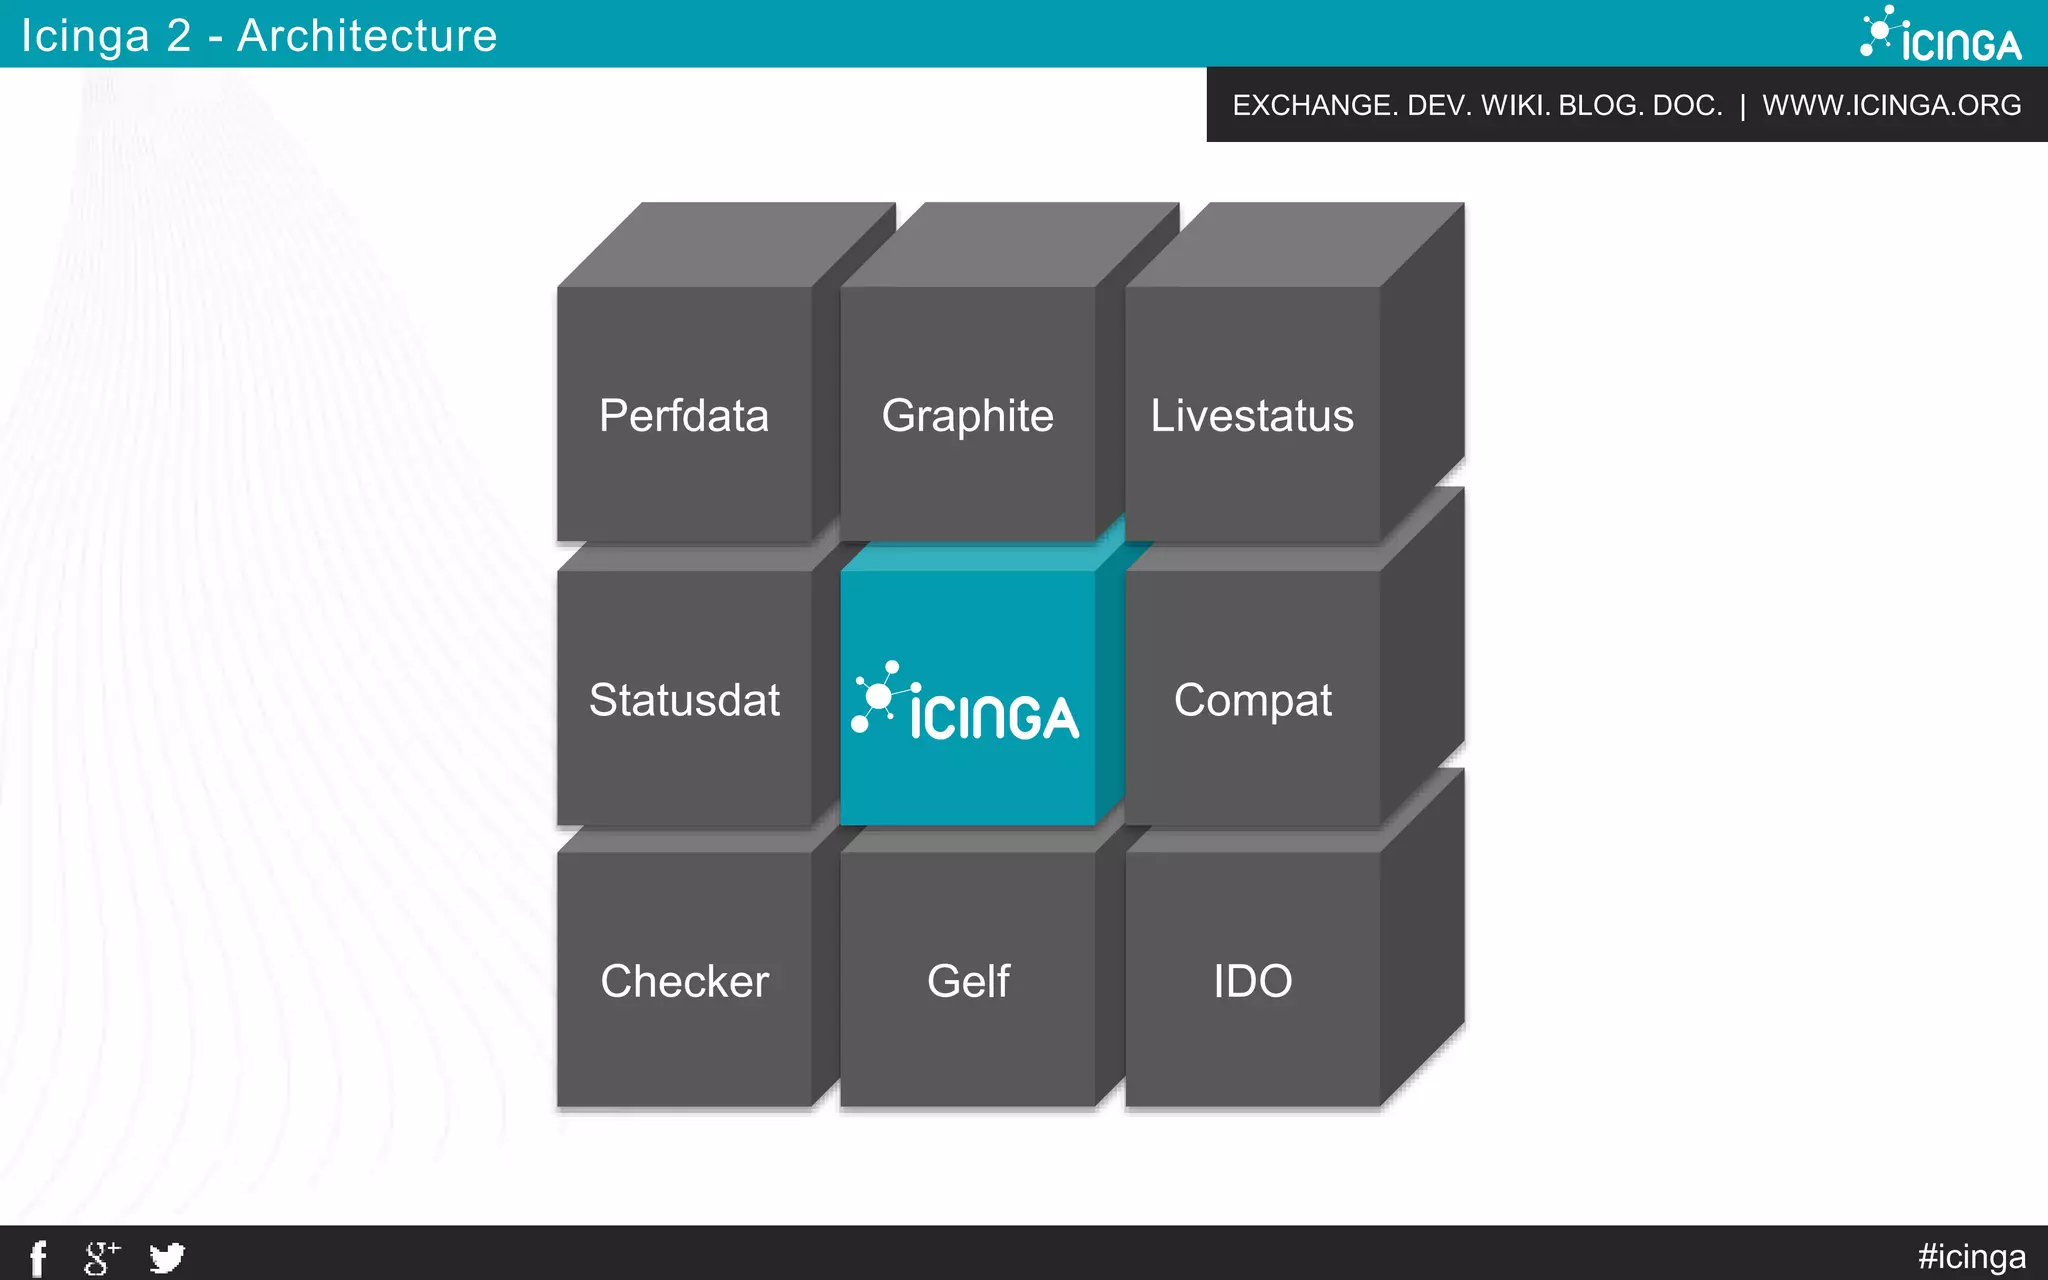
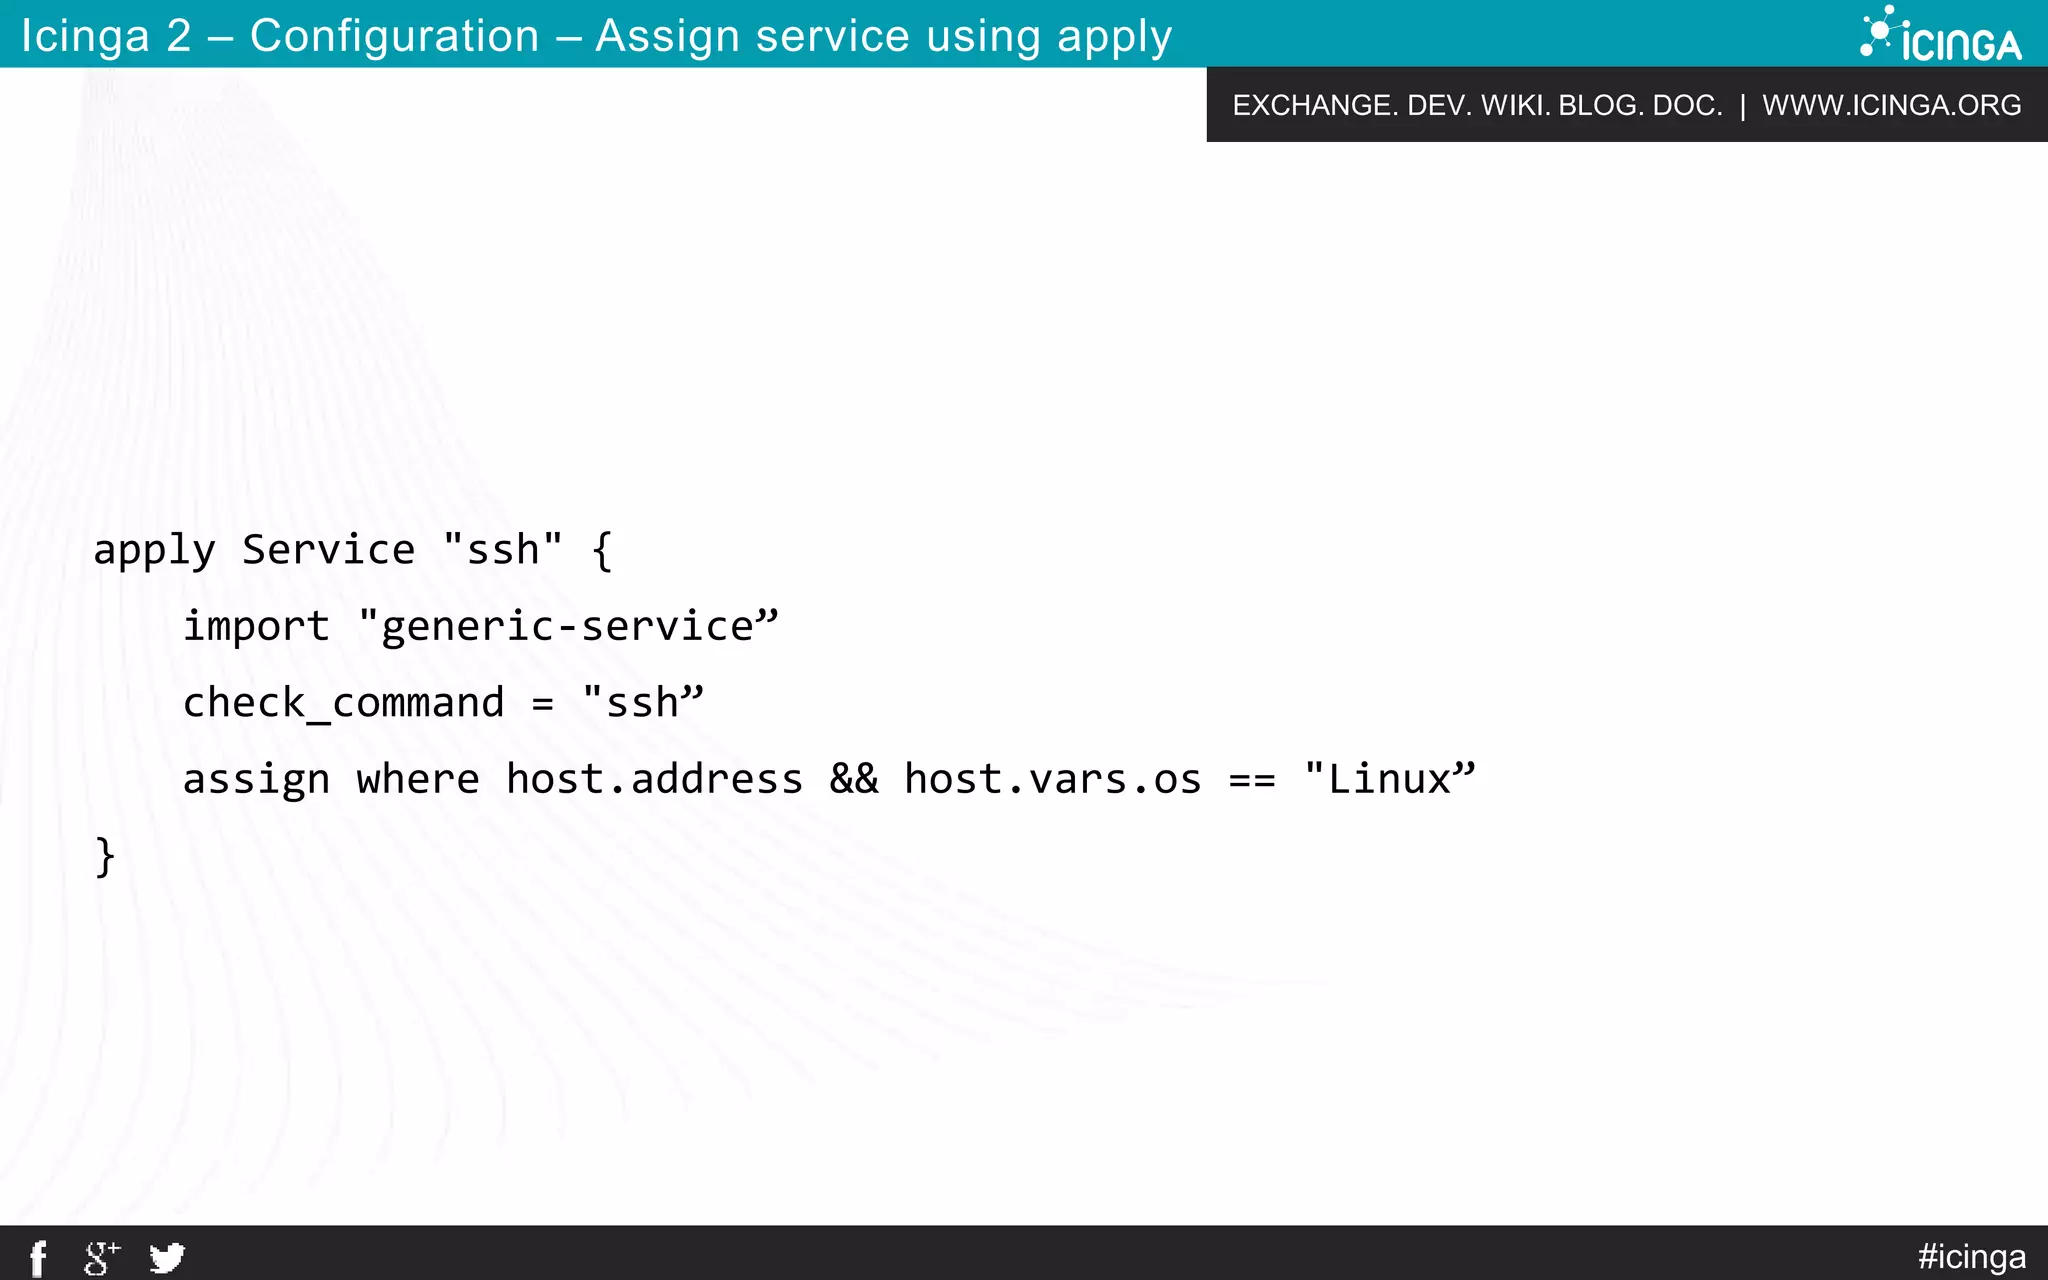
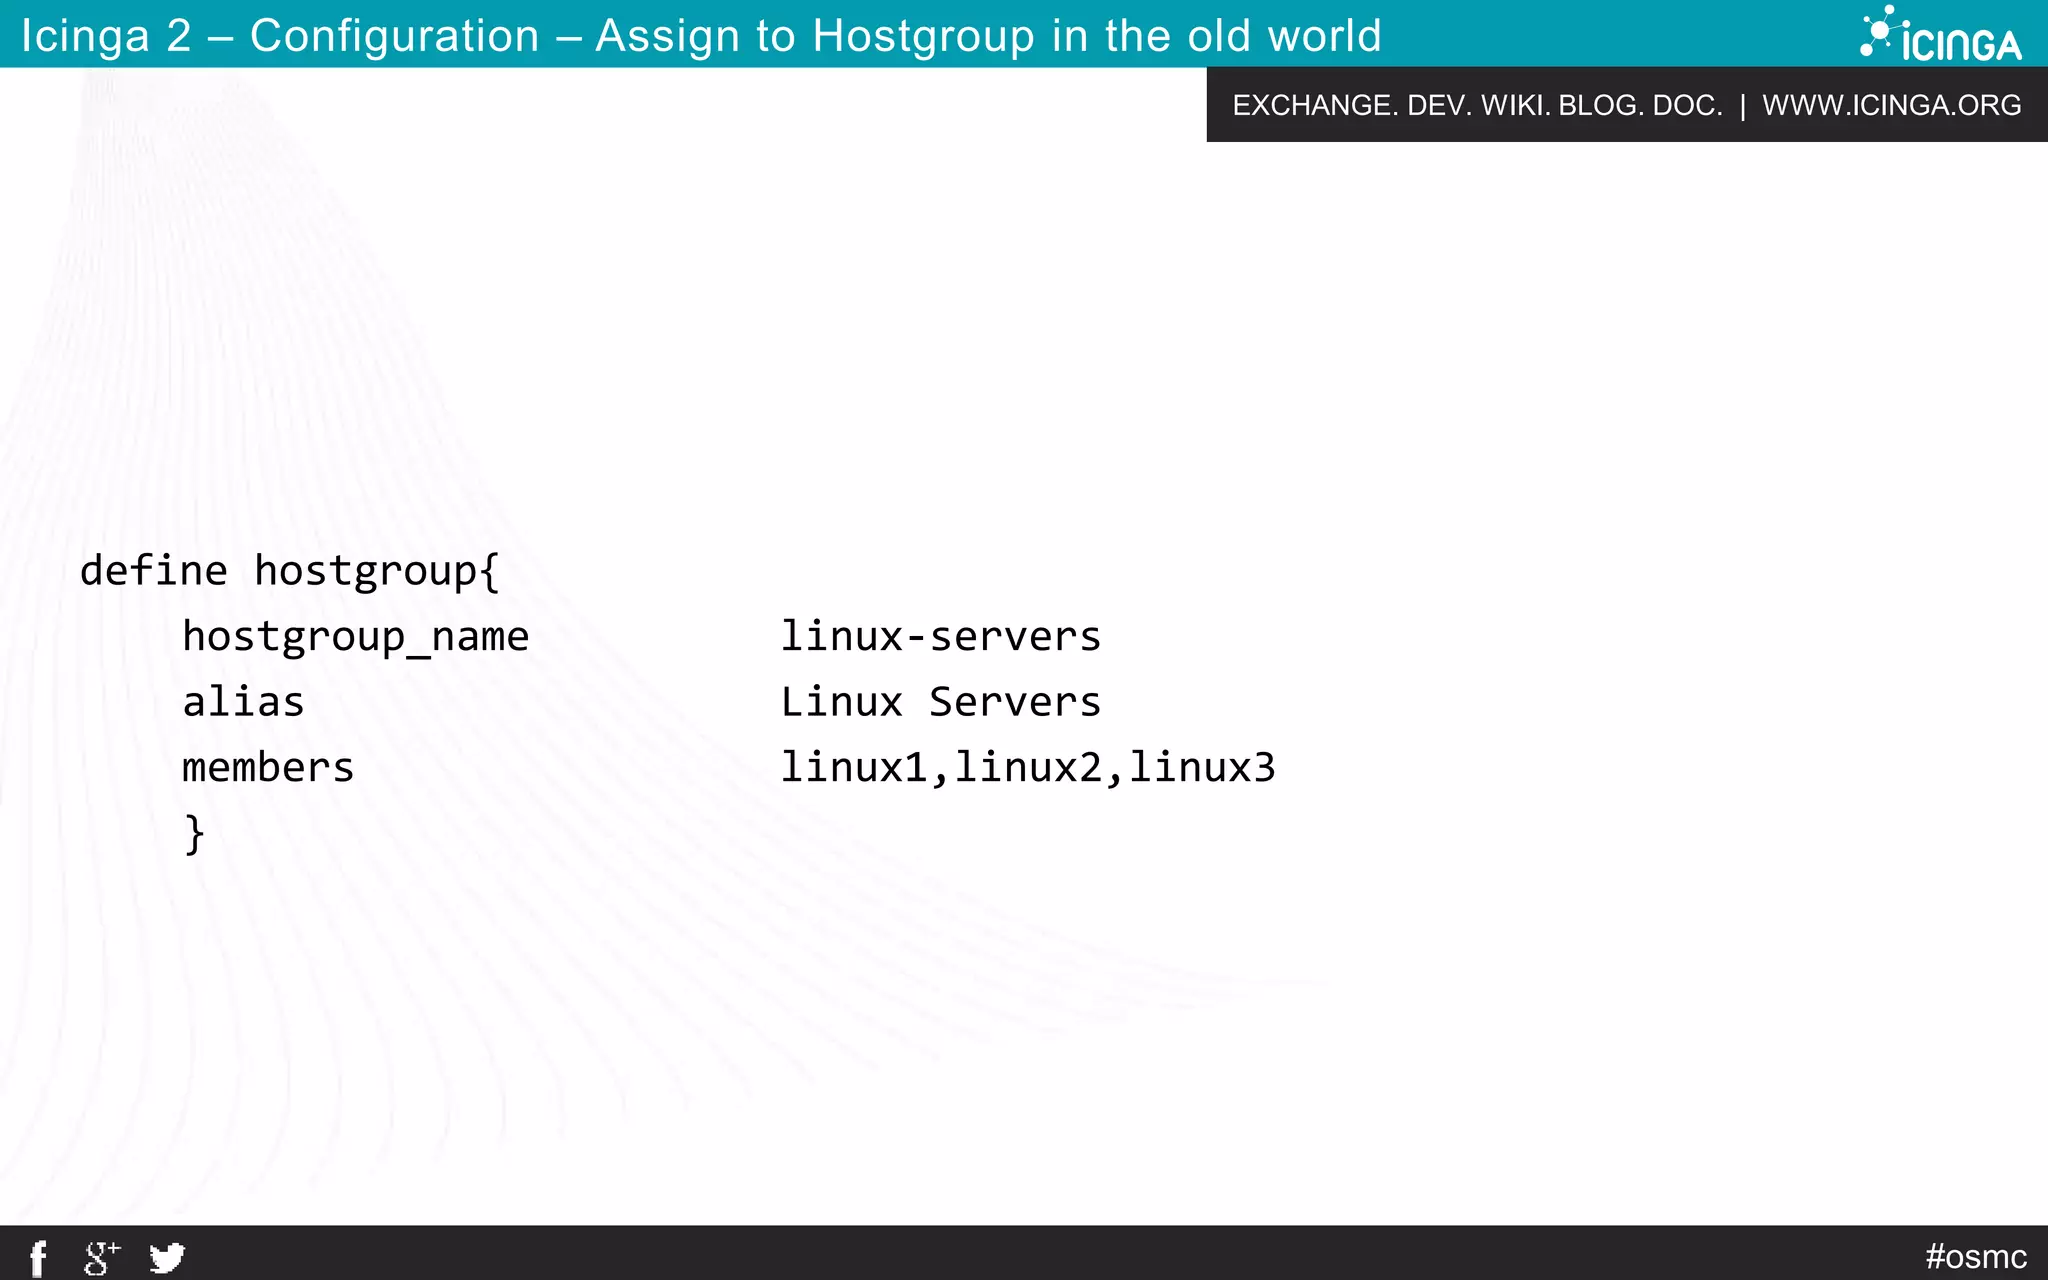
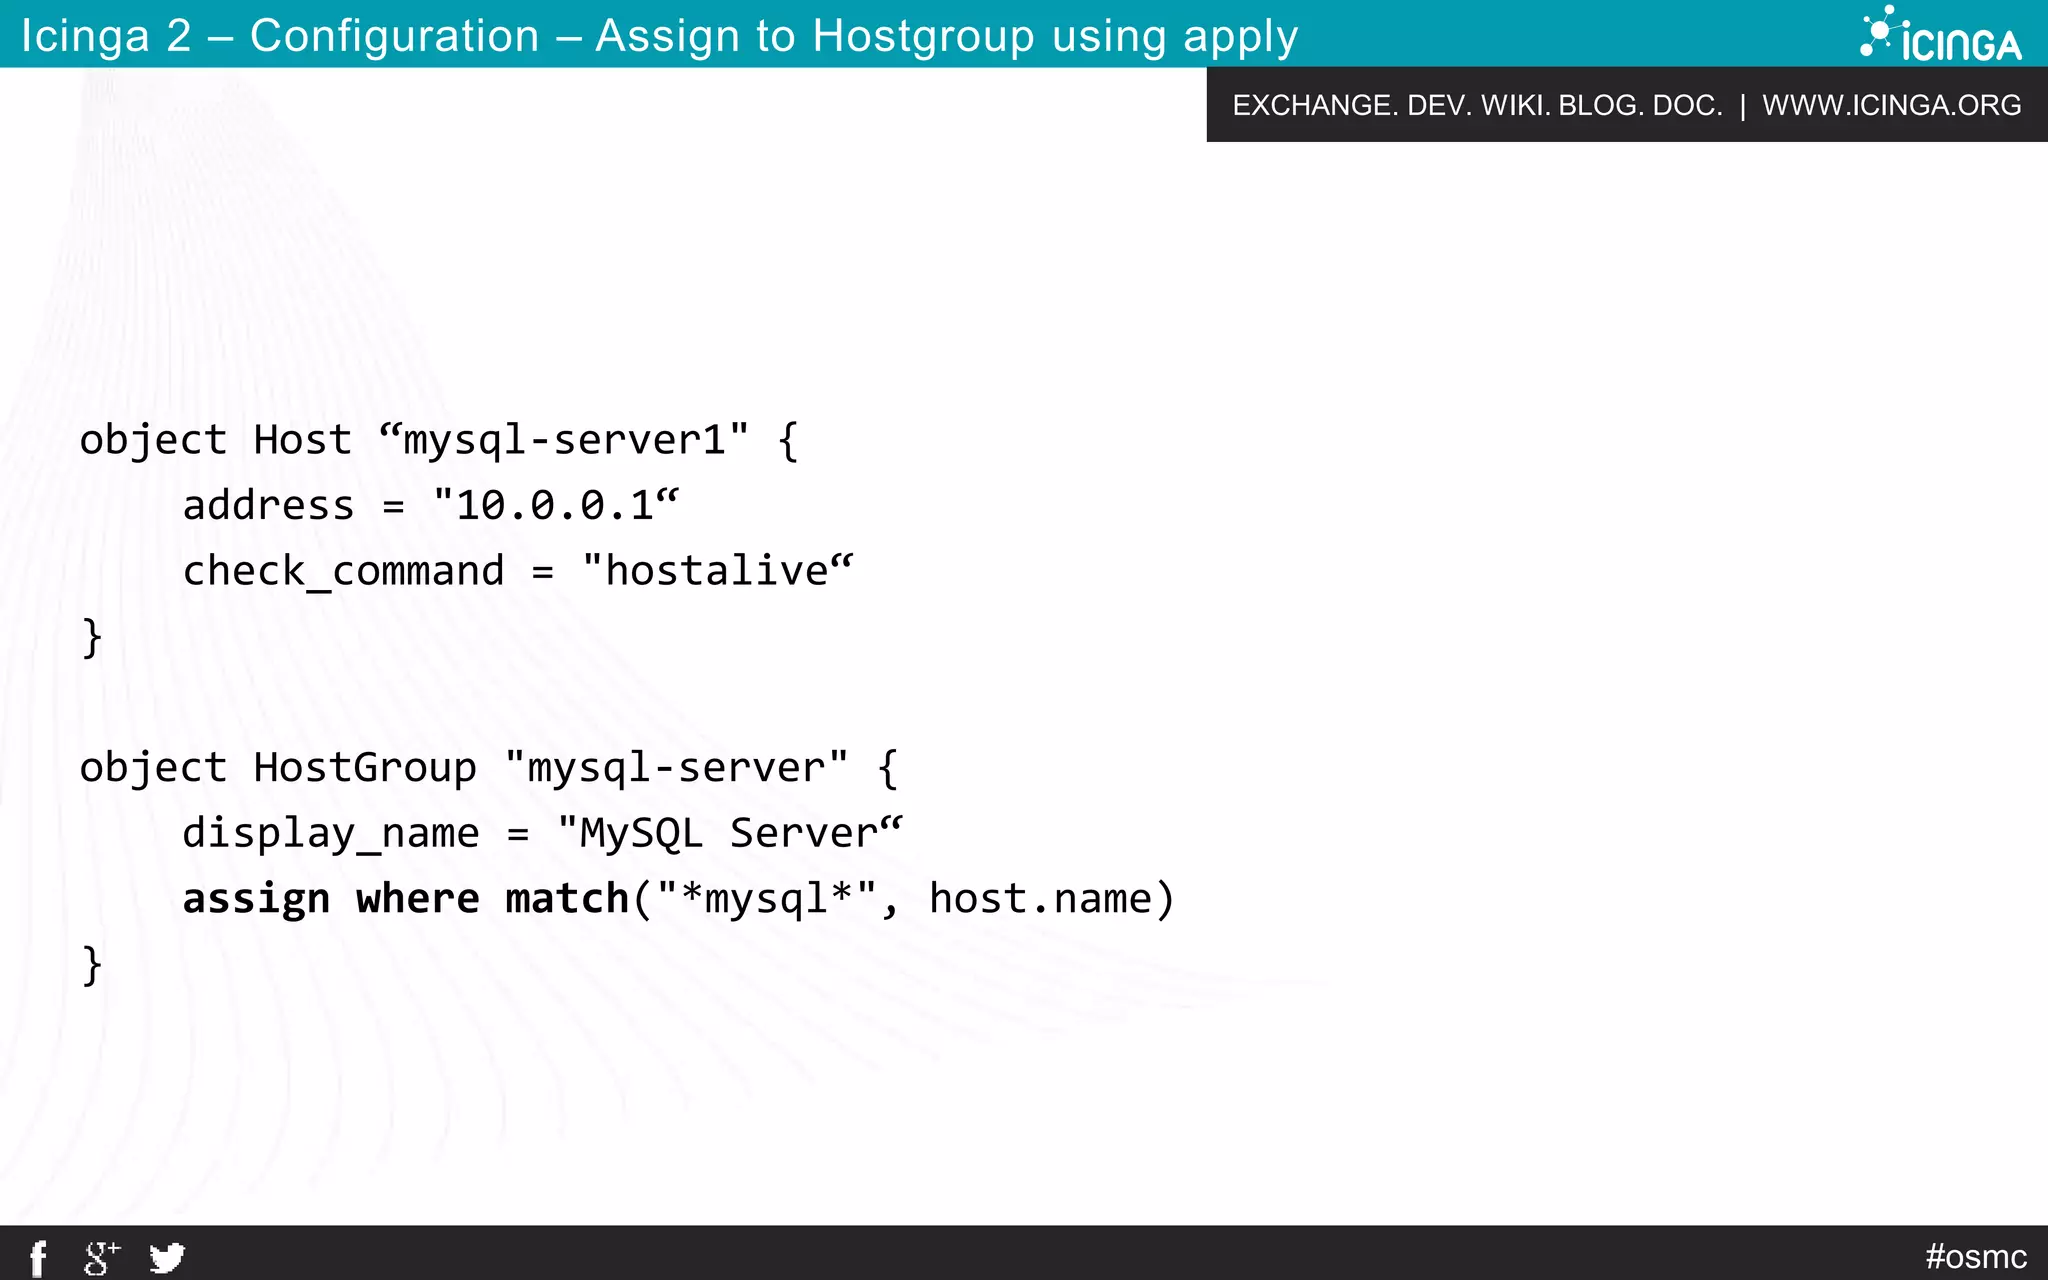
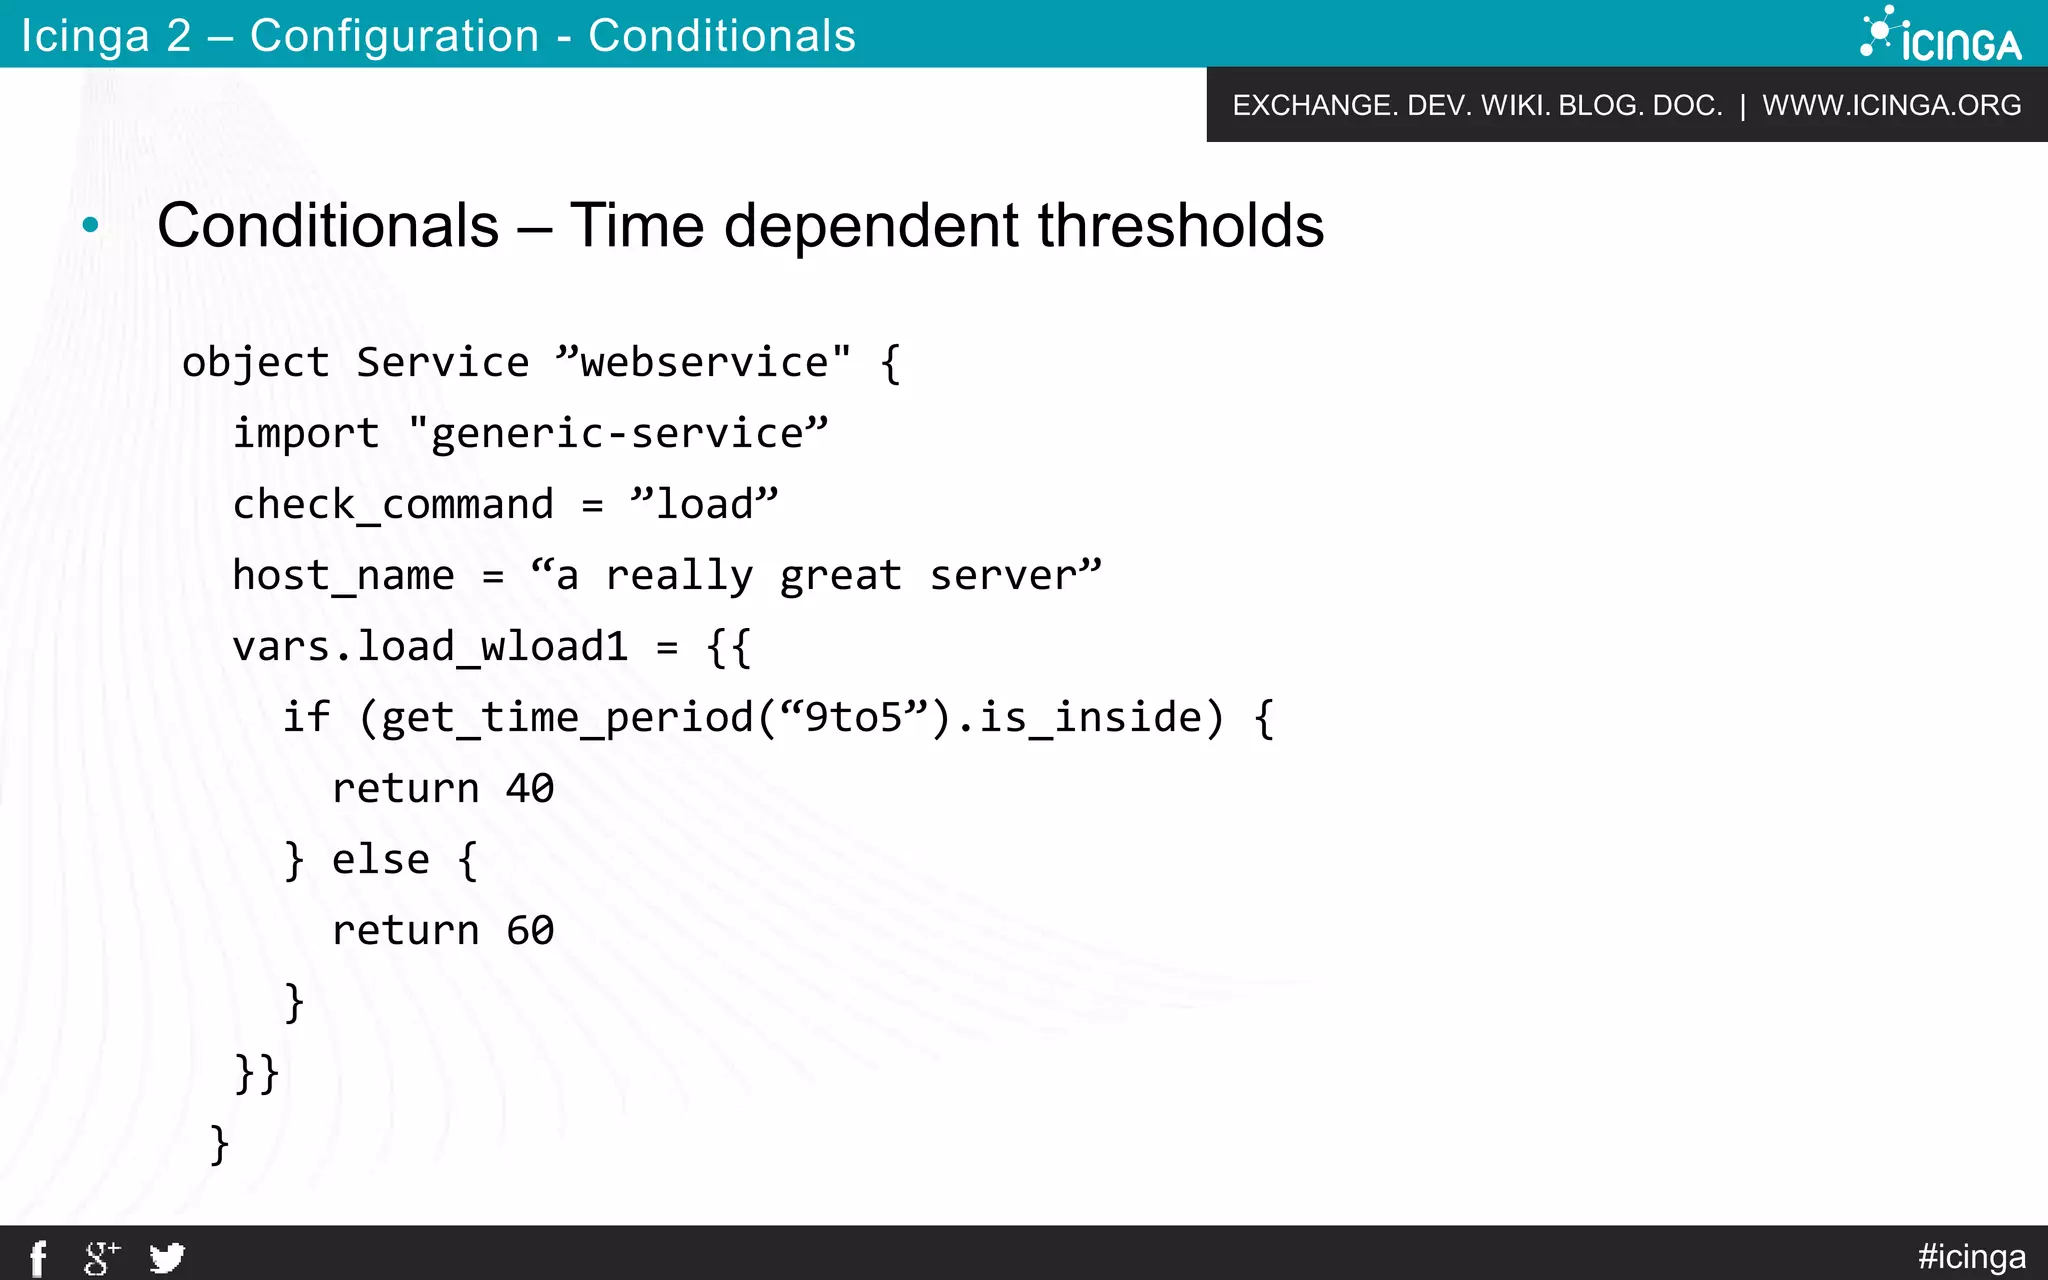
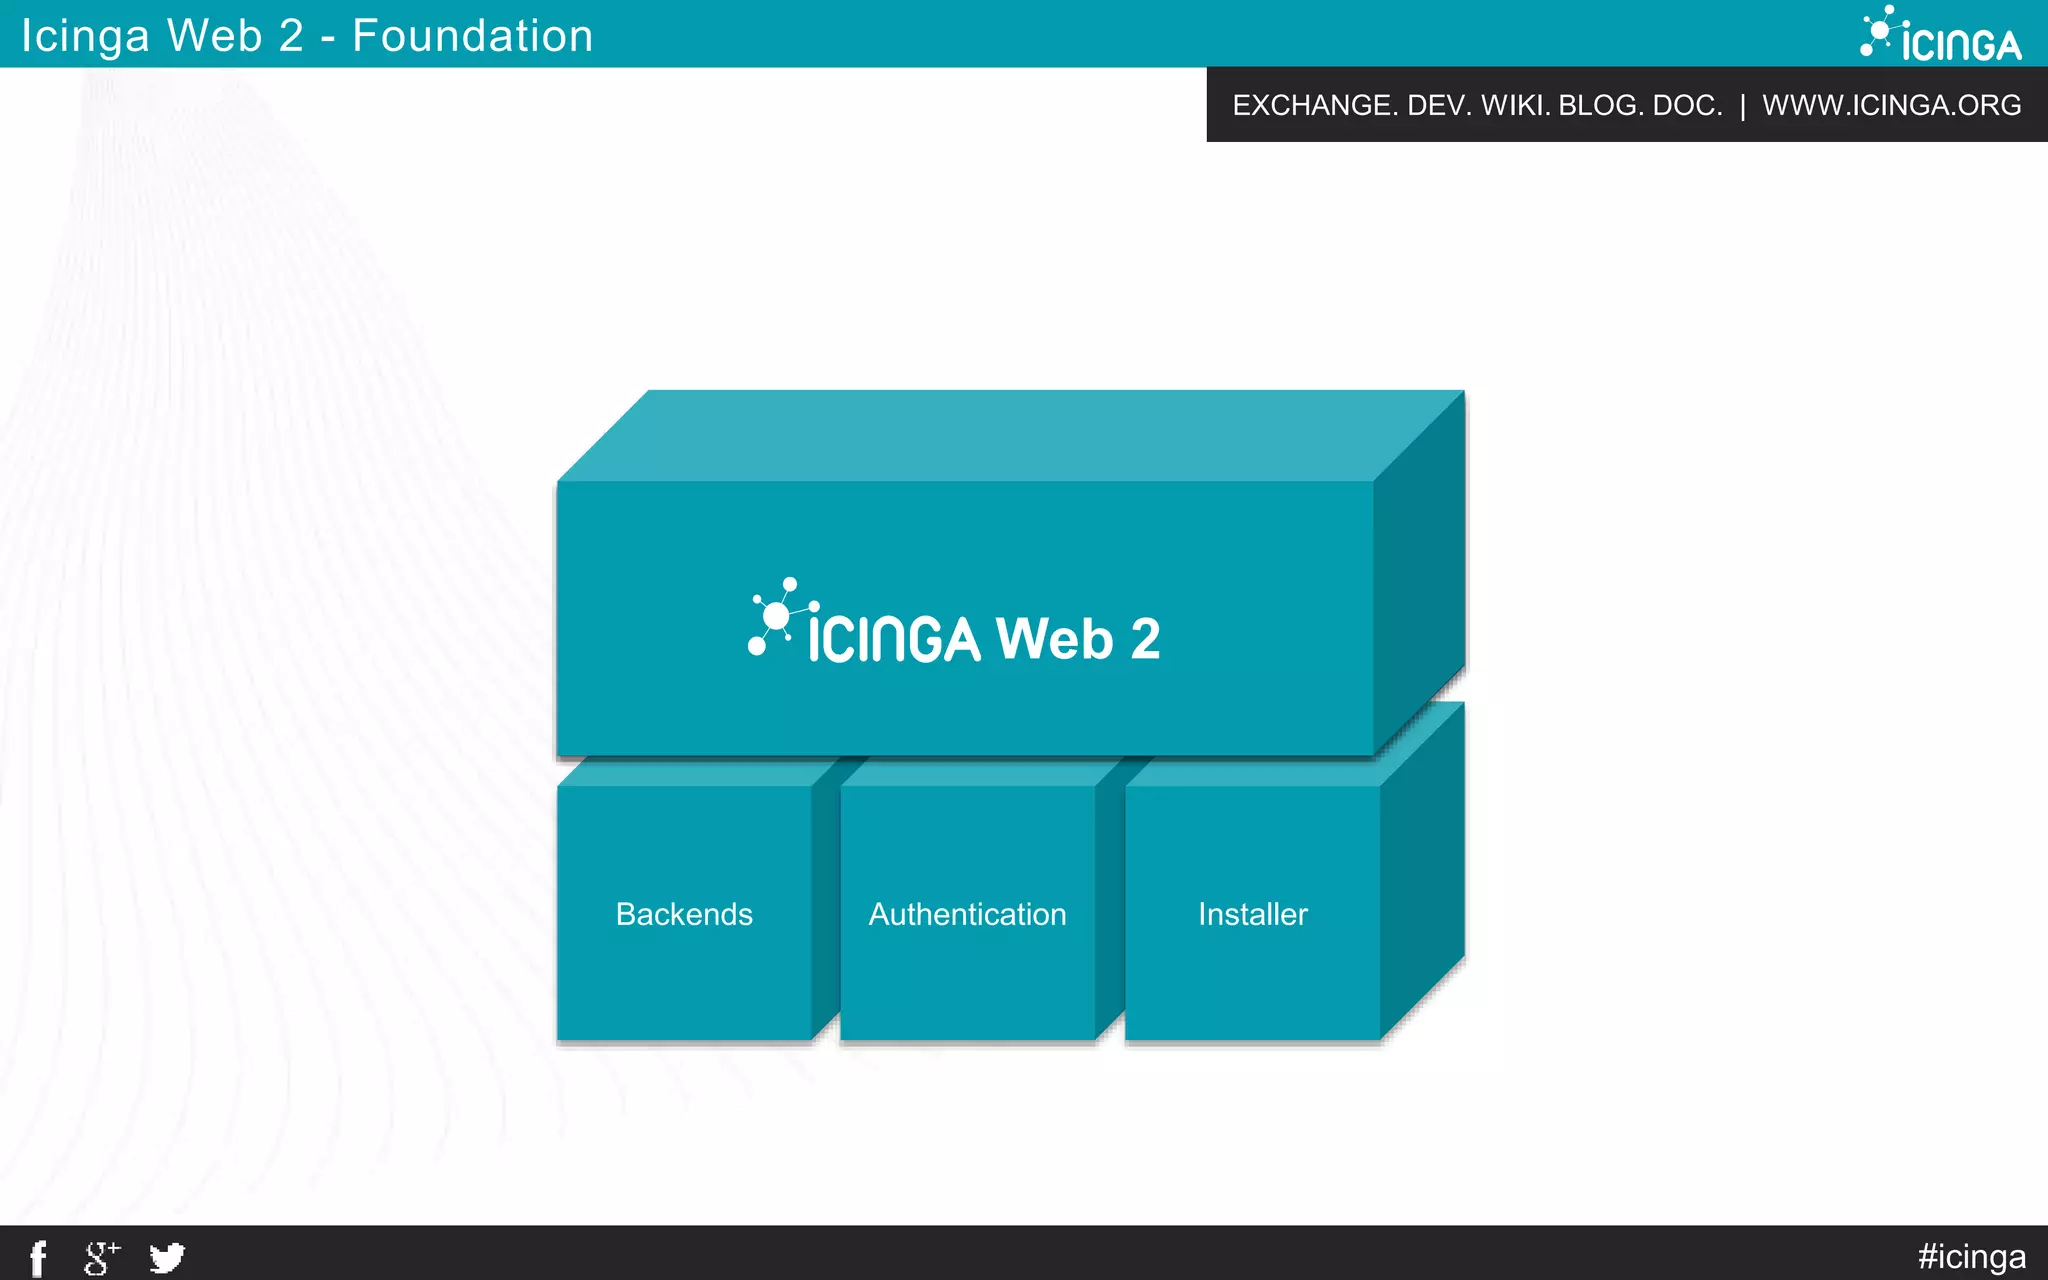
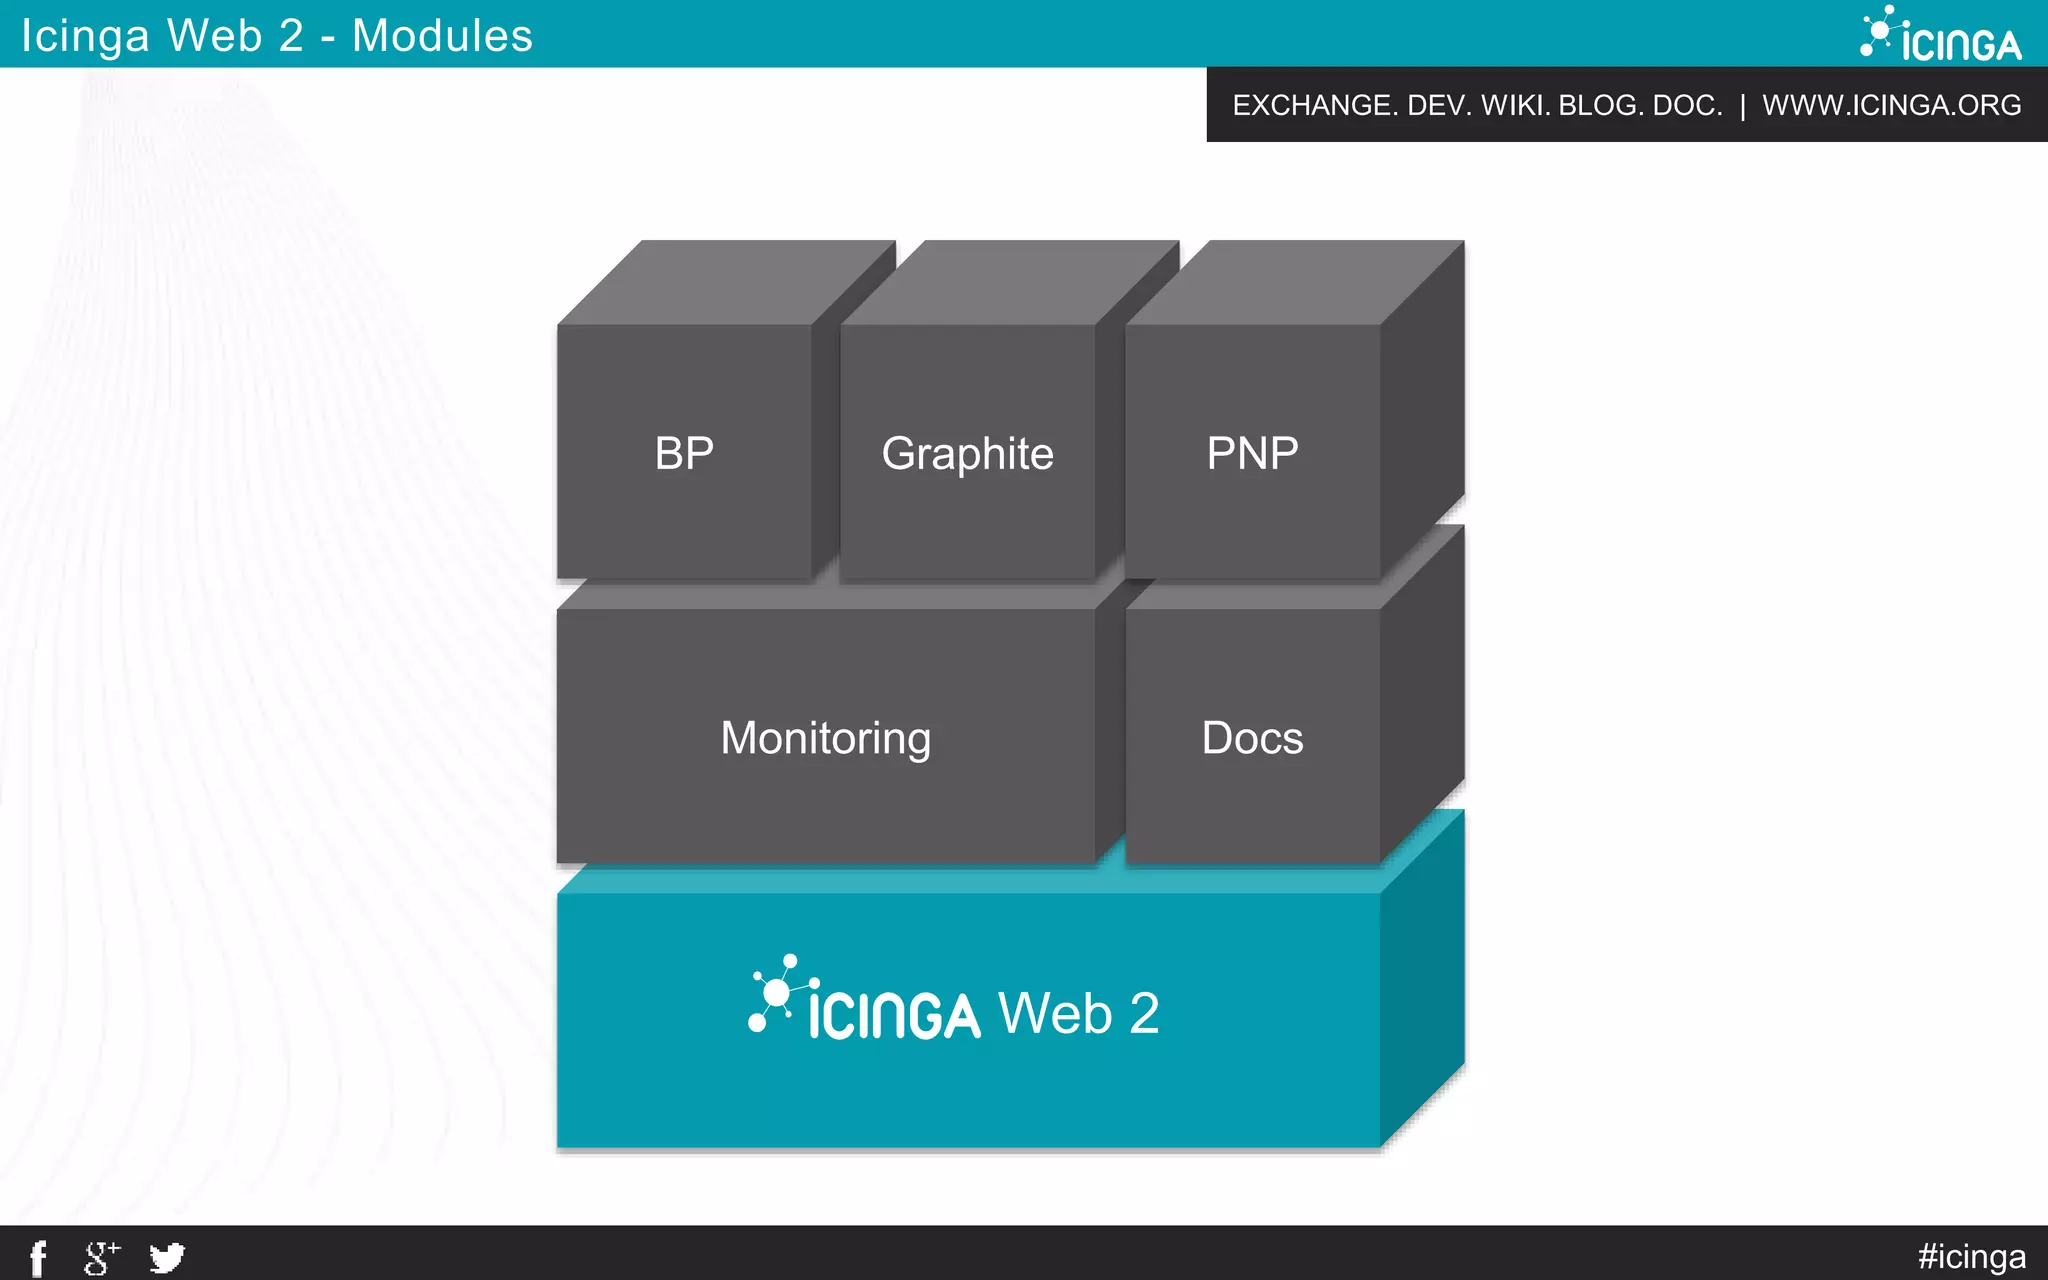
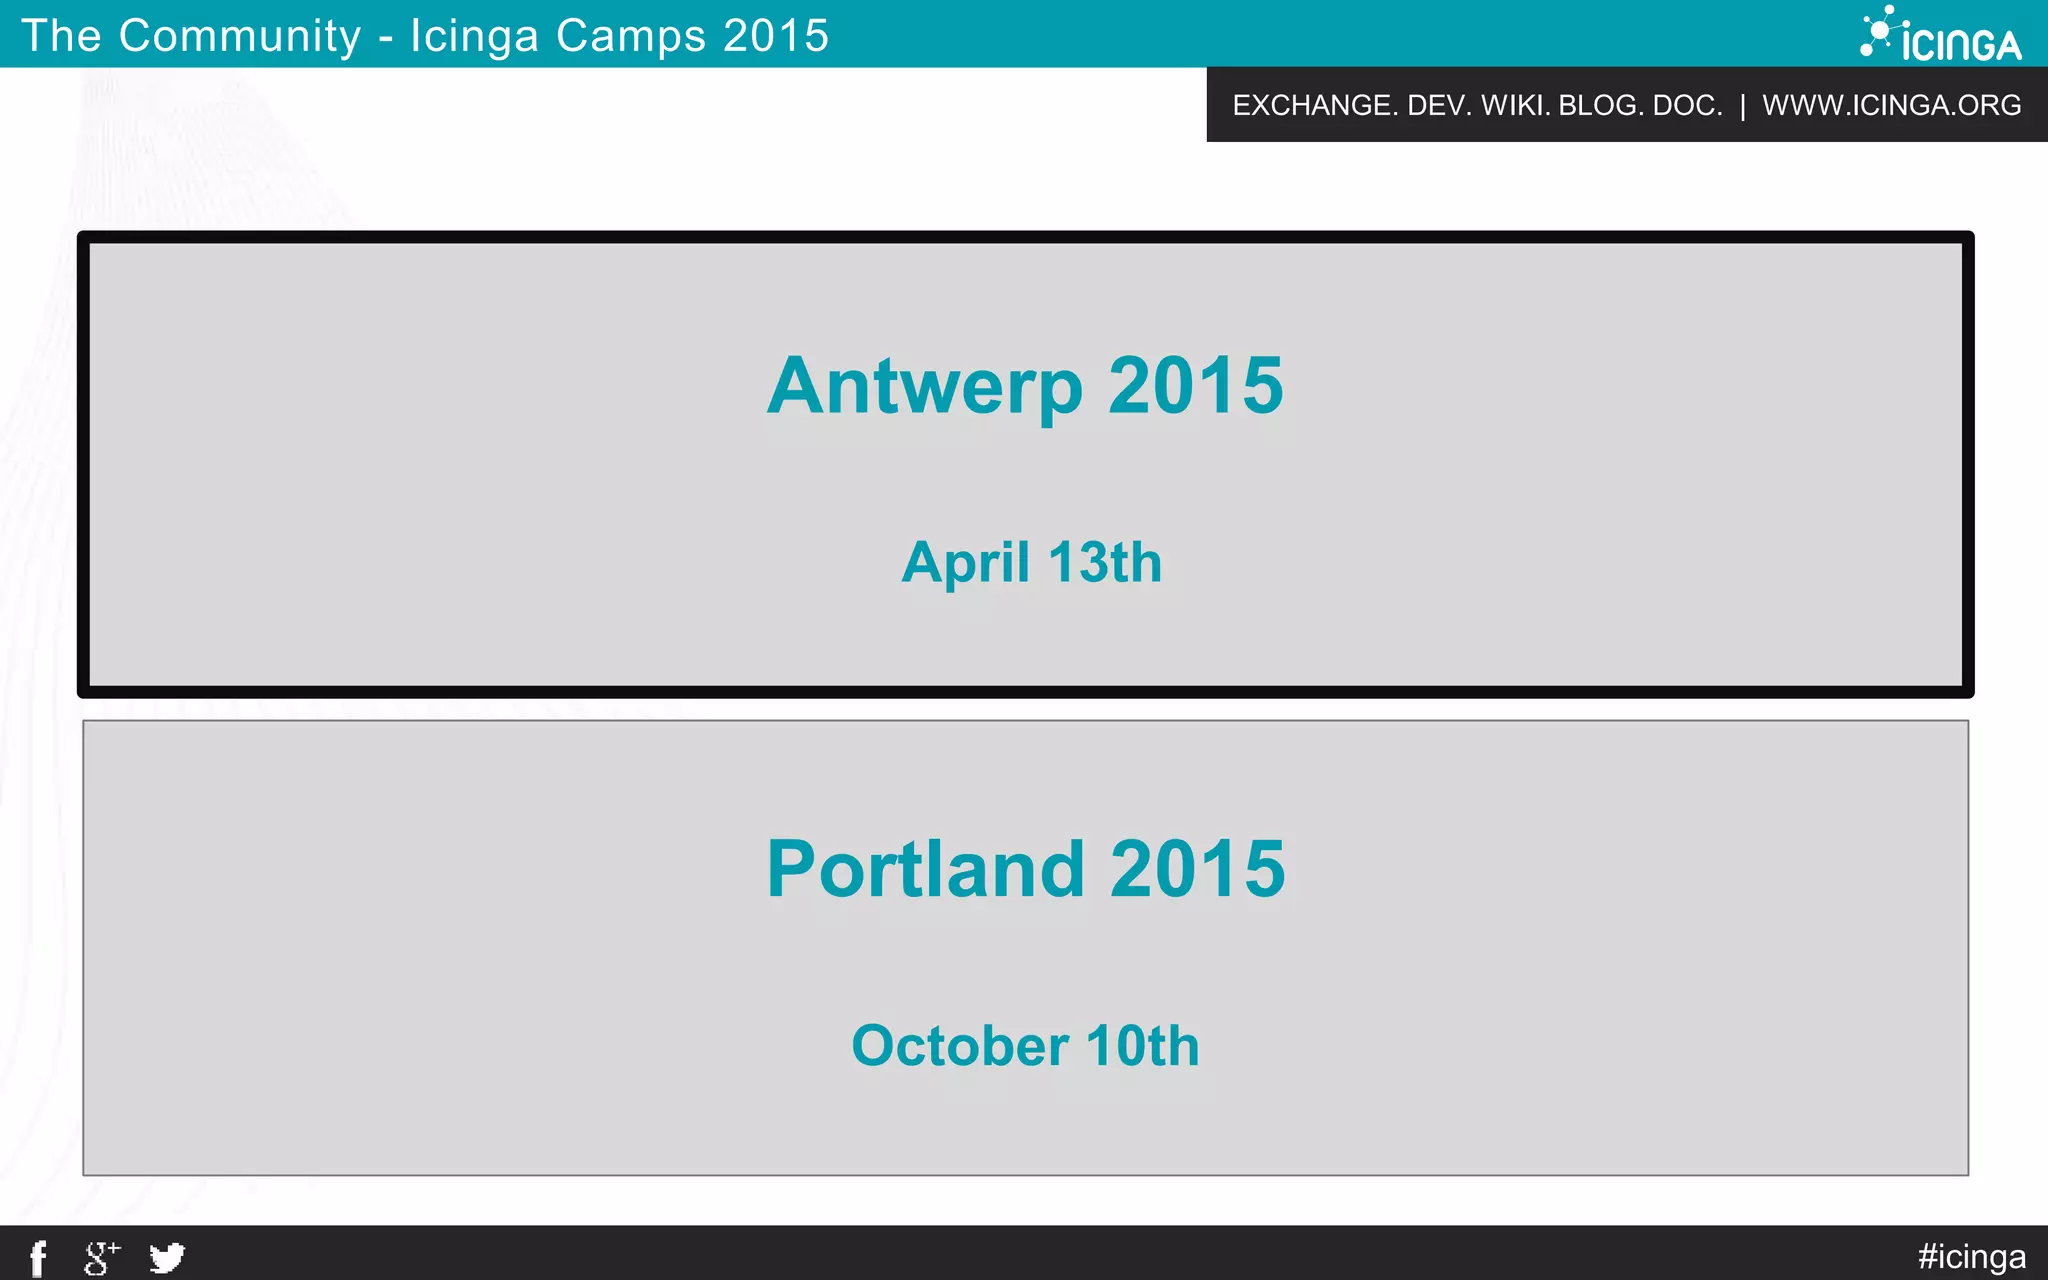
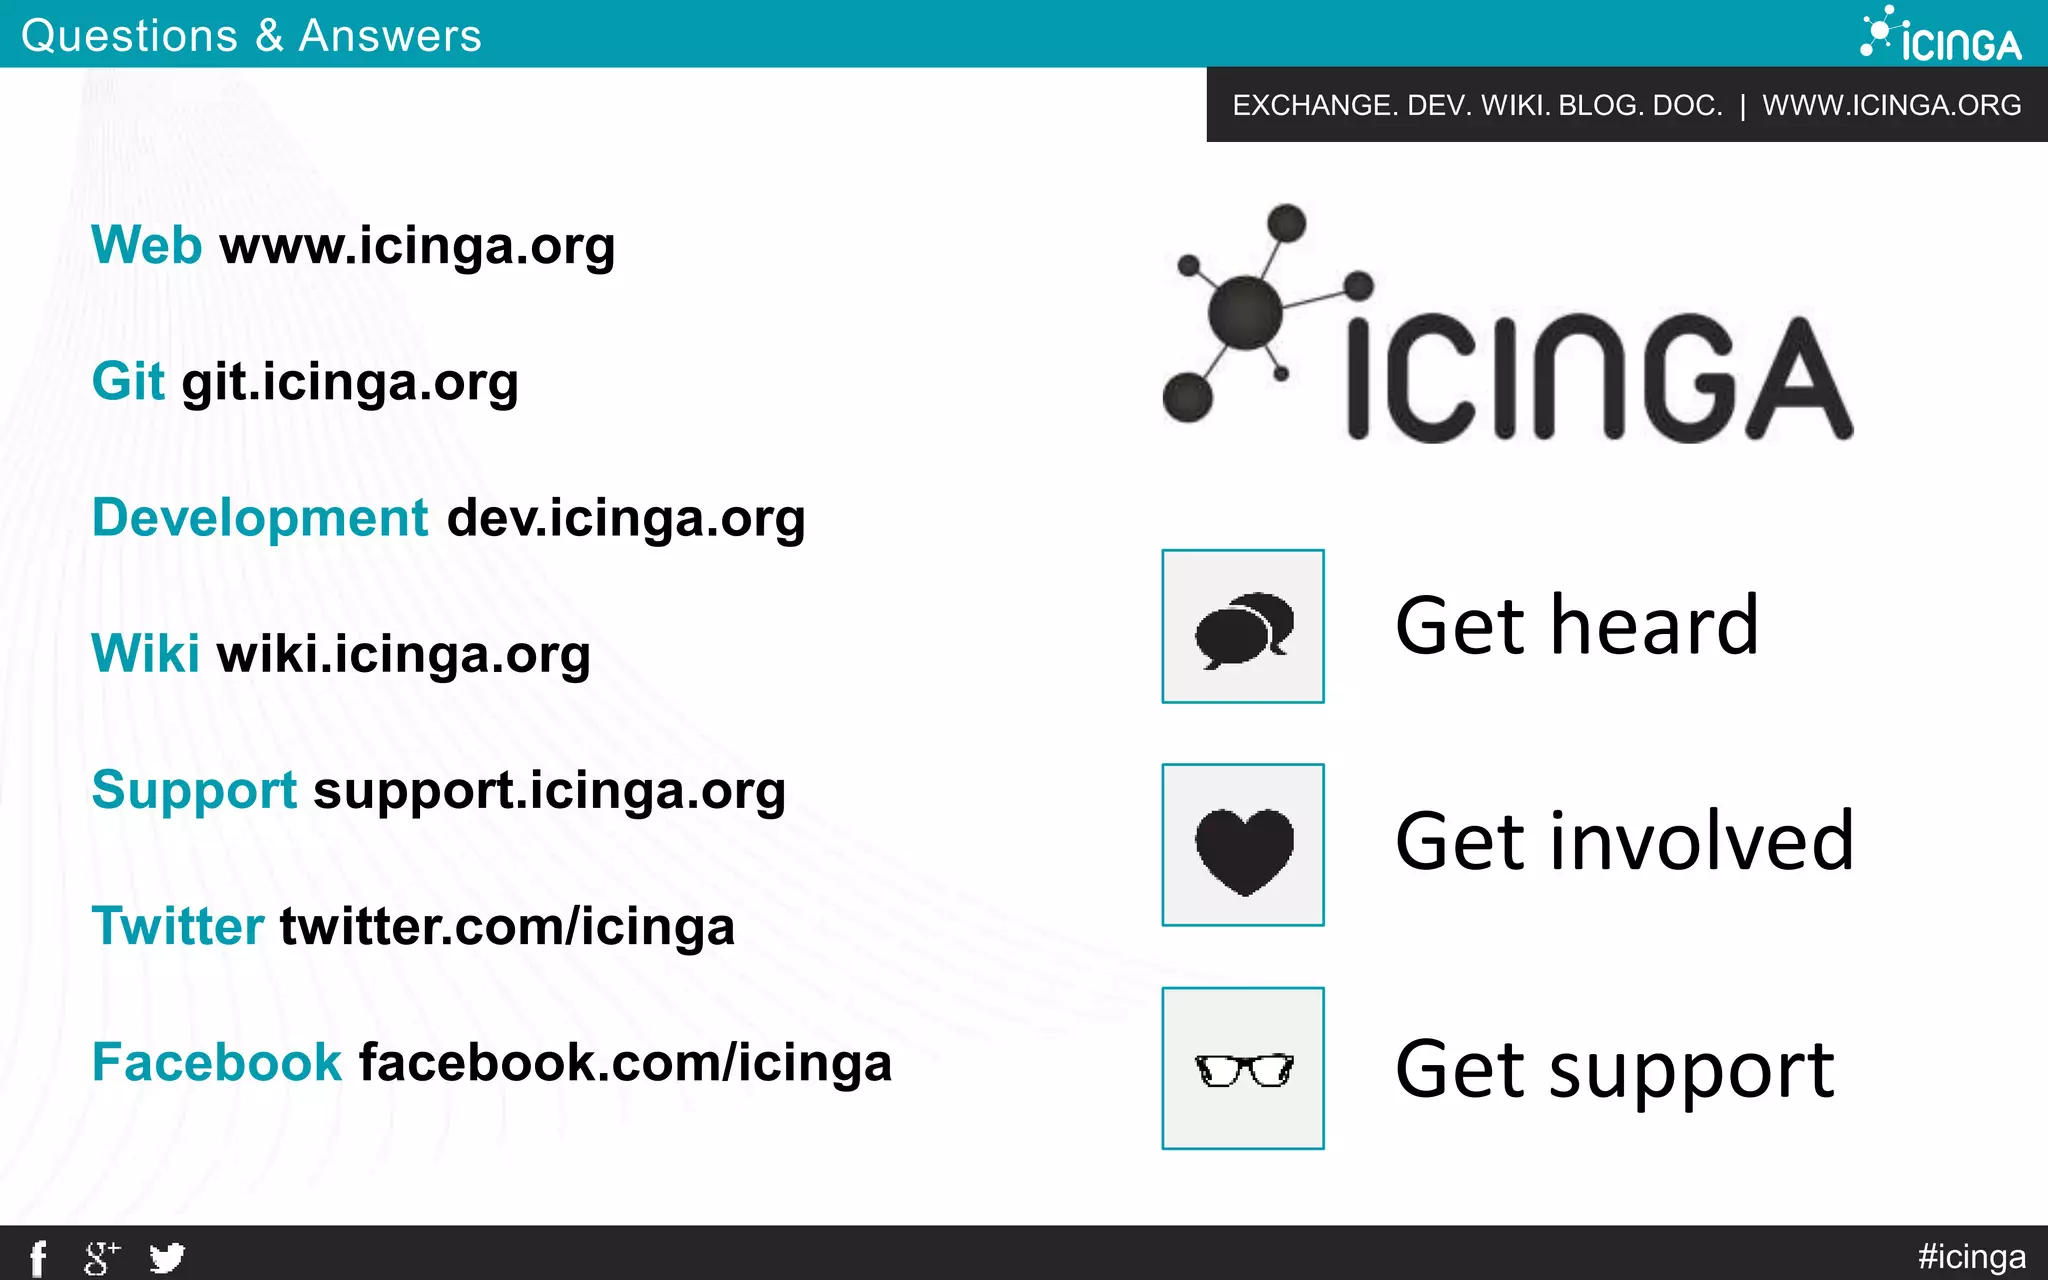
Bernd Erk presented on Icinga, an open source monitoring system. Icinga is scalable and extensible, checking resources for availability and providing notifications and reports. It was originally forked from Nagios in 2009. Icinga 2, released in 2014, is redesigned in C++. Icinga includes tools like Icinga Core, Icinga Web, and supports clustering. The community uses Icinga Camps to meet and provides documentation, support and ways to get involved on its website and social media.
Icinga 2012 Development at 6th TF-NOC MeetingIcinga
Presentation about current Icinga development by Michael Friedrich at the 6th TF-NOC Meeting in Dublin.
Original Source: http://www.terena.org/activities/tf-noc/meeting6/programme.html
Icinga 2012 Development at 6th TF-NOC MeetingIcinga
Presentation about current Icinga development by Michael Friedrich at the 6th TF-NOC Meeting in Dublin.
Original Source: http://www.terena.org/activities/tf-noc/meeting6/programme.html
OSMC 2014 | Curret State of Icinga by Icinga TeamNETWAYS
Seit der ersten Preview auf der OSMC 2012 ist viel passiert und Icinga 2 ist seit einigen Monaten fertig. Neben verbesserter Performance und flexibler Architektur und zentrales und dezentrales Cluster, zeichnet sich Icinga 2 vor allem durch vereinfachte Konfiguration aus. Auch bei Icinga 1 sowie bei den verschiedenen Add-ons und Webinterfaces hat sich viel getan. Highlight des Vortrags wird die Vorstellung des neuen Webinterfaces Icinga Web 2. Neben einem aktuellen Status gibt der Vortrag einen Überblick über die kommenden Entwicklungen und zeigt die aktuellen Versionen in Live Demos.
OSMC 2013 | Current State of Icinga by Icinga TeamNETWAYS
Seit der ersten Preview auf der OSMC 2012 ist viel passiert und Icinga2 hat Gestalt angenommen. Neben verbesserter Performance und flexibler Architektur und zentrales und dezentrales Cluster zeichnet sich Icinga2 vor allem durch vereinfachte Konfiguration aus. Auch bei Icinga1 sowie bei den verschiedenen Add-ons und Webinterfaces hat sich viel getan. Neben einem aktuellen Status gibt der Vortrag einen Überblick über die kommenden Entwicklung und zeigt die aktuellen Versionen in Live Demos.
OSMC 2014: Current state of Icinga | Icinga TeamNETWAYS
Seit der ersten Preview auf der OSMC 2012 ist viel passiert und Icinga 2 ist seit einigen Monaten fertig. Neben verbesserter Performance und flexibler Architektur und zentrales und dezentrales Cluster, zeichnet sich Icinga 2 vor allem durch vereinfachte Konfiguration aus. Auch bei Icinga 1 sowie bei den verschiedenen Add-ons und Webinterfaces hat sich viel getan. Highlight des Vortrags wird die Vorstellung des neuen Webinterfaces Icinga Web 2. Neben einem aktuellen Status gibt der Vortrag einen Überblick über die kommenden Entwicklungen und zeigt die aktuellen Versionen in Live Demos.
Zum Zeitpunkt der Konferenz ist Icinga mit der Version 1.8 bei der dritten und letzten Version für dieses Jahr angekommen. Ein Beispiel für die gesteigerte Usability sind die integrierten Modulanbindungen für PNP4Nagios und dem BP-Addon aber auch die vielen neuen Features von Icinga-Classic und Icinga-Web. Neben einer kurzen Zusammenfassung der vergangenen Änderungen wird der Vortrag die neue Icinga-Version und deren Möglichkeiten präsentieren.
Upgrading Incident Management with Icinga - Icinga Camp Milan 2023Icinga
Talk by: Blerim Sheqa
We started an initiative to rebuild and upgrade the way how incidents are handled in Icinga. Our approach includes better contact management, easier configuration of notification rules and better accessibility through the Icinga web interface. In this talk we will guide you through our concepts and demonstrate the current state of development.
Extending Icinga Web with Modules: powerful, smart and easily created - Icing...Icinga
Talk by: Nicolas Schneider
At the Icinga Camp Berlin 2023 Nicolas shared his knowledge on how to build modules for Icinga Web. This time he will demonstrate what he has build so far, including extended functionalities to impersonate within Icinga Web, enforce team dashboards and many more.
Infrastructure Monitoring for Cloud Native Enterprises - Icinga Camp Milan 2023Icinga
Talk by: Simone Nocentini and Vladimir Mozharov
Being a manged service provider comes with its very own challenges, especially when it comes to monitoring. In this session we will dive in into Kiratech’s infrastructure to get an overview from the provider and the client perspective, and what it takes to monitor a variety of technologies with Icinga. The strategy contains an approach of deploying Icinga with Ansible for comprehensive visibility and linking it with FreshService for seamless integration. We will have an outlook to future projects including event-driven automations, Icinga-style observability and application monitoring.
Incident management: Best industry practices your team should know - Icinga C...Icinga
Talk by: Birol Yildiz
Developers and OPS engineers face the relentless challenge of responding to incidents swiftly and effectively, ensuring seamless system operations and customer satisfaction. At this talk attendants will learn how to implement proactive alerting strategies, effectively triage incidents, and collaborate seamlessly during high-pressure situations.
Monitoring Cooling Units in a pharmaceutical GxP regulated environment - Icin...Icinga
Talk by: Felix Joussein
Icinga is used to monitor and alert in case of temperature deviations in a GxP (pharmaceutical industry) regulated environment. The holy grale in a laboratpry environment are the study samples (animal but also human). So regulators (EMA, FDA,..) around the world want to ensure, that the sample-stability is at it’s best. To ensure this, depending on the known stability, certain temperature ranges in cooling-units are defined and have to be trackable thourghout the whole lifecycle of such a sample.
SNMP Monitoring at scale - Icinga Camp Milan 2023Icinga
Talk by: Rocco Pezzani and Thomas Gelf
This presentation unveils a new addon component for the Icinga ecosystem, developed in collaboration with Würth Phoenix and with the support of Irideos. It enables distributed SNMP network monitoring for large segmented networks, capable of monitoring huge numbers of devices in near real-time, while displaying trend graphs for sensor and performance metrics.
An interactive MIB browser with distributed SNMP polling support and some nice network device visualization components will also be shown.
Monitoring Kubernetes with Icinga - Icinga Camp Milan 2023Icinga
Talk by: Eric Lippmann
We recently started researching and developing a Module for Icinga to monitor Kubernetes environments. During the past months we learned a lot about the platform and how we can monitor Kubernetes with Icinga efficiently. In this talk I will present our challenges but also the progress that we made. The talk will include a sneak peak into the current state of the Module and outline our vision of monitoring Kubernetes with Icinga.
Current State of Icinga - Icinga Camp Milan 2023Icinga
Talk by: Bernd Erk
This talk is a summary of all news and updates of the last months. We will cover all relevant fields and share updates about the current state of Icinga.
Efficient IT operations using monitoring systems and standardized tools - Ici...Icinga
Talk by: Magnus Lübeck
This talk will discuss Icinga as the “one stop shop” for finding the “single truth of systems state”. KMG Group use a “four field” model when designing systems, where Icinga have an important place in a section called “technical monitoring/technical performance monitoring”. We touch two methodologies (MOPS – Metrics, Operational tools, Processes, and Metrics), and Ted Dziuba’s actionable response to monitoring events.
Talk by: Stefano Bruno
Tornado is a high performance and scalable application written in Rust. It is able to handle millions of events each second on standard server hardware. The main objective of this talk is to show how you can extend an Icinga2 with Tornado through the three main modules: Tornado data collector, Tornado rule engine, Tornado executor. With Tornado we will able to receive events from different channels like SNMP Trap, Syslog, Email, SMS, Telegram and match them against a rule engine and decide which action to associate.
Talk by: Simon Gerber
Signalilo is a small webhook server for ingesting Prometheus alerts into Icinga2. Our motivation for creating Signalilo was to integrate alerts from existing Prometheus-based monitoring suites (e.g. for OpenShift Container Platform) into our company-wide Icinga2. Signalilo is currently deployed on 10 OpenShift clusters and forwards Prometheus alerts to Icinga2.
In this talk, I will present the basic design of Signalilo and give a short overview of how we use Signalilo in our production monitoring to forward Prometheus alerts to Icinga2.
Moving from Icinga 1 to Icinga 2 + Director - Icinga Camp Zurich 2019Icinga
Talk by: Christof Hanke
The Max Planck Computing and Data Facility (MPCDF, formerly known as RZG) is using Icinga / Nagios for more than 10 years now. We have/had several instances for different areas, such as miscellaneous servers, clusters or even EU-Projects spanning several European sites. This talk is about our (still ongoing) transition from our icinga1 installation for general servers which is based on many config-files, changed by two people only, to a director based self-service. The goal is that our fellow admins can integrate new hosts by a few steps. The configuration is declarative. In the host-object they just choose templates and fill in fields and arrays. The actual icinga2-configuration is then done via apply-rules.
Icinga Director and vSphereDB - how they play together - Icinga Camp Zurich 2019Icinga
Talk by: Thomas Gelf
While the Icinga Director is the main configuration tool for Icinga, vSphereDB is a completely different beast. Icinga models everything around Hosts and Services, vSphereDB instead discovers your whole VMware infrastructure and builds a huge and deep inventory.
This talk wants to explain the reasoning behind this, shows what’s possible right now and where those powerful Icinga components are heading to in the near future.
NetEye 4 based on Icinga 2 - Icinga Camp Milan 2019Icinga
Talk by Michele Santuari:
This slot will give insights in the new architecture of the actual NetEye 4 version based on Icinga 2, allowing further scalability to perform also complex event processing (CEP) over a large number of event streams. CEP scenarios will process the events based on the resource consumption limits. The ability to do fast in-memory processing of events such as filtering, grouping and aggregating this way enables to do real time analysis.
Integrating Icinga 2 and ntopng - Icinga Camp Milan 2019Icinga
Talk by Simone Mainardi:
Icinga2 offers useful checks when it comes to monitoring hosts and services in the network. It can ping, test HTTP and DNS services, or establish network connections to make sure everything is up and running. However, such checks are not always enough to ensure the network is operating smoothly with healthy hosts and services. Can you be sure there is no unwanted traffic towards hosts believed to be malicious? What about unencrypted communications and weak TLS? Why has the throughput of an host surged today?
This talk discusses how Icinga2 can be integrated with ntopng to bring network checks a step forward. ntopng, a widely-known network visibility tool, will be used in combination with Icinga2 to create a framework for the timely detection of unwanted or suspicious activities in the network, beyond basic up-or-down checks.
DevOps monitoring: Best Practices using OpenShift combined with Icinga & Big ...Icinga
Talk by Marco Bizzantino:
In my talk I will demonstrate how monitoring works with the DevOps approach. Within an organisation, different people with different roles need to have a complete view over the whole infrastructure. One of the greatest benefits of Icinga is its ability to integrate with various tools and modules to satisfy the company’s requests. An example is OpenShift monitoring. I will point out the most important parts of monitoring OpenShift infrastructure while maintaining it’s complexity. In my approach I will show how we combine Icinga, Prometheus, Grafana and Elasticsearch for an overall OpenShift monitoring solution. Additional examples will show the benefits of using Icinga’s Business Process modelling to add more value to the result.
Best of Icinga Modules - Icinga Camp Milan 2019Icinga
Talk by Bernd Erk:
Humans are creatures of habit – we have our environments, our tasks, our routine. Building up a routine takes a lot out of us – so as soon as we find something that works for us we stick with it. But is it effective? Are there tools that can make our life so much easier if we manage to integrate them into our routine? Of course, we’re in IT, there are always new and good tools! Only 2 more hurdles to clear – find the right tools for you and actually make the effort to integrate them into your routine.
The purpose of this talk is to help you with exactly that – I will show you the most important quality-of-life modules and add-ons for Icinga.All of them officially supported by the Icinga team and super easy to integrate into your system!
hallenges of Monitoring Big Infrastructure - Icinga Camp Milan 2019Icinga
Talk by Blerim Sheqa:
Most monitoring environments are automated with configuration management tools like Puppet, Chef or Ansible. While these tools solve many problems, such as the initial setup, reproducibility and visibility, there are many other challenges that need to be tackled to truly monitor big environments. As a vendor of monitoring software, Icinga came up with unique approaches to solve some extraordinary problems to monitor large scale infrastructures. The methods are a result of real world problems as seen in the wild and applicable to many scenarios.
Transcript: Selling digital books in 2024: Insights from industry leaders - T...BookNet Canada
The publishing industry has been selling digital audiobooks and ebooks for over a decade and has found its groove. What’s changed? What has stayed the same? Where do we go from here? Join a group of leading sales peers from across the industry for a conversation about the lessons learned since the popularization of digital books, best practices, digital book supply chain management, and more.
Link to video recording: https://bnctechforum.ca/sessions/selling-digital-books-in-2024-insights-from-industry-leaders/
Presented by BookNet Canada on May 28, 2024, with support from the Department of Canadian Heritage.
Connector Corner: Automate dynamic content and events by pushing a buttonDianaGray10
Here is something new! In our next Connector Corner webinar, we will demonstrate how you can use a single workflow to:
Create a campaign using Mailchimp with merge tags/fields
Send an interactive Slack channel message (using buttons)
Have the message received by managers and peers along with a test email for review
But there’s more:
In a second workflow supporting the same use case, you’ll see:
Your campaign sent to target colleagues for approval
If the “Approve” button is clicked, a Jira/Zendesk ticket is created for the marketing design team
But—if the “Reject” button is pushed, colleagues will be alerted via Slack message
Join us to learn more about this new, human-in-the-loop capability, brought to you by Integration Service connectors.
And...
Speakers:
Akshay Agnihotri, Product Manager
Charlie Greenberg, Host
Elevating Tactical DDD Patterns Through Object CalisthenicsDorra BARTAGUIZ
After immersing yourself in the blue book and its red counterpart, attending DDD-focused conferences, and applying tactical patterns, you're left with a crucial question: How do I ensure my design is effective? Tactical patterns within Domain-Driven Design (DDD) serve as guiding principles for creating clear and manageable domain models. However, achieving success with these patterns requires additional guidance. Interestingly, we've observed that a set of constraints initially designed for training purposes remarkably aligns with effective pattern implementation, offering a more ‘mechanical’ approach. Let's explore together how Object Calisthenics can elevate the design of your tactical DDD patterns, offering concrete help for those venturing into DDD for the first time!
UiPath Test Automation using UiPath Test Suite series, part 4DianaGray10
Welcome to UiPath Test Automation using UiPath Test Suite series part 4. In this session, we will cover Test Manager overview along with SAP heatmap.
The UiPath Test Manager overview with SAP heatmap webinar offers a concise yet comprehensive exploration of the role of a Test Manager within SAP environments, coupled with the utilization of heatmaps for effective testing strategies.
Participants will gain insights into the responsibilities, challenges, and best practices associated with test management in SAP projects. Additionally, the webinar delves into the significance of heatmaps as a visual aid for identifying testing priorities, areas of risk, and resource allocation within SAP landscapes. Through this session, attendees can expect to enhance their understanding of test management principles while learning practical approaches to optimize testing processes in SAP environments using heatmap visualization techniques
What will you get from this session?
1. Insights into SAP testing best practices
2. Heatmap utilization for testing
3. Optimization of testing processes
4. Demo
Topics covered:
Execution from the test manager
Orchestrator execution result
Defect reporting
SAP heatmap example with demo
Speaker:
Deepak Rai, Automation Practice Lead, Boundaryless Group and UiPath MVP
JMeter webinar - integration with InfluxDB and GrafanaRTTS
Watch this recorded webinar about real-time monitoring of application performance. See how to integrate Apache JMeter, the open-source leader in performance testing, with InfluxDB, the open-source time-series database, and Grafana, the open-source analytics and visualization application.
In this webinar, we will review the benefits of leveraging InfluxDB and Grafana when executing load tests and demonstrate how these tools are used to visualize performance metrics.
Length: 30 minutes
Session Overview
-------------------------------------------
During this webinar, we will cover the following topics while demonstrating the integrations of JMeter, InfluxDB and Grafana:
- What out-of-the-box solutions are available for real-time monitoring JMeter tests?
- What are the benefits of integrating InfluxDB and Grafana into the load testing stack?
- Which features are provided by Grafana?
- Demonstration of InfluxDB and Grafana using a practice web application
To view the webinar recording, go to:
https://www.rttsweb.com/jmeter-integration-webinar
The Art of the Pitch: WordPress Relationships and SalesLaura Byrne
Clients don’t know what they don’t know. What web solutions are right for them? How does WordPress come into the picture? How do you make sure you understand scope and timeline? What do you do if sometime changes?
All these questions and more will be explored as we talk about matching clients’ needs with what your agency offers without pulling teeth or pulling your hair out. Practical tips, and strategies for successful relationship building that leads to closing the deal.
UiPath Test Automation using UiPath Test Suite series, part 3DianaGray10
Welcome to UiPath Test Automation using UiPath Test Suite series part 3. In this session, we will cover desktop automation along with UI automation.
Topics covered:
UI automation Introduction,
UI automation Sample
Desktop automation flow
Pradeep Chinnala, Senior Consultant Automation Developer @WonderBotz and UiPath MVP
Deepak Rai, Automation Practice Lead, Boundaryless Group and UiPath MVP
Slack (or Teams) Automation for Bonterra Impact Management (fka Social Soluti...Jeffrey Haguewood
Sidekick Solutions uses Bonterra Impact Management (fka Social Solutions Apricot) and automation solutions to integrate data for business workflows.
We believe integration and automation are essential to user experience and the promise of efficient work through technology. Automation is the critical ingredient to realizing that full vision. We develop integration products and services for Bonterra Case Management software to support the deployment of automations for a variety of use cases.
This video focuses on the notifications, alerts, and approval requests using Slack for Bonterra Impact Management. The solutions covered in this webinar can also be deployed for Microsoft Teams.
Interested in deploying notification automations for Bonterra Impact Management? Contact us at sales@sidekicksolutionsllc.com to discuss next steps.
GDG Cloud Southlake #33: Boule & Rebala: Effective AppSec in SDLC using Deplo...James Anderson
Effective Application Security in Software Delivery lifecycle using Deployment Firewall and DBOM
The modern software delivery process (or the CI/CD process) includes many tools, distributed teams, open-source code, and cloud platforms. Constant focus on speed to release software to market, along with the traditional slow and manual security checks has caused gaps in continuous security as an important piece in the software supply chain. Today organizations feel more susceptible to external and internal cyber threats due to the vast attack surface in their applications supply chain and the lack of end-to-end governance and risk management.
The software team must secure its software delivery process to avoid vulnerability and security breaches. This needs to be achieved with existing tool chains and without extensive rework of the delivery processes. This talk will present strategies and techniques for providing visibility into the true risk of the existing vulnerabilities, preventing the introduction of security issues in the software, resolving vulnerabilities in production environments quickly, and capturing the deployment bill of materials (DBOM).
Speakers:
Bob Boule
Robert Boule is a technology enthusiast with PASSION for technology and making things work along with a knack for helping others understand how things work. He comes with around 20 years of solution engineering experience in application security, software continuous delivery, and SaaS platforms. He is known for his dynamic presentations in CI/CD and application security integrated in software delivery lifecycle.
Gopinath Rebala
Gopinath Rebala is the CTO of OpsMx, where he has overall responsibility for the machine learning and data processing architectures for Secure Software Delivery. Gopi also has a strong connection with our customers, leading design and architecture for strategic implementations. Gopi is a frequent speaker and well-known leader in continuous delivery and integrating security into software delivery.
GraphRAG is All You need? LLM & Knowledge GraphGuy Korland
Guy Korland, CEO and Co-founder of FalkorDB, will review two articles on the integration of language models with knowledge graphs.
1. Unifying Large Language Models and Knowledge Graphs: A Roadmap.
https://arxiv.org/abs/2306.08302
2. Microsoft Research's GraphRAG paper and a review paper on various uses of knowledge graphs:
https://www.microsoft.com/en-us/research/blog/graphrag-unlocking-llm-discovery-on-narrative-private-data/
Encryption in Microsoft 365 - ExpertsLive Netherlands 2024Albert Hoitingh
In this session I delve into the encryption technology used in Microsoft 365 and Microsoft Purview. Including the concepts of Customer Key and Double Key Encryption.
4. EXCHANGE. DEV. WIKI. BLOG. DOC. | WWW.ICINGA.ORG
The Icinga Project – Introduction
#icinga
Open Source Enterprise Monitoring
Icinga is a scalable and extensible monitoring system
which checks the availability of your resources, notifies
users of outages and provides extensive BI data.
5. EXCHANGE. DEV. WIKI. BLOG. DOC. | WWW.ICINGA.ORG
#icinga
The Icinga Project – About us
• Originally forked from Nagios in April 2009
• Independent, redesigned version Icinga 2 since 2014
• Different teams with autonomic responsibilities
8. EXCHANGE. DEV. WIKI. BLOG. DOC. | WWW.ICINGA.ORG
#icinga
The Icinga Project – Tools & Platform
Icinga Core
C-based source
MySQL, PostgreSQL, Oracle
Icinga Quality, Testing and Community Support
Website and Open Source Ticketing System
Icinga Reports
based on Jasper
Reports
Icinga Doc
based on
Markdown
3rd Party Tools
Icinga Web
based on PHP using ExtJS, Agavi MVC
IDOUTILS
Icinga 2 Web
Based on PHP / responsive design
Icinga 2
C++-based source with
multiple components
IDO Livestatus Cluster …
11. EXCHANGE. DEV. WIKI. BLOG. DOC. | WWW.ICINGA.ORG
Icinga 2 – What it does?
#icinga
Alerts
Mail
SMS
Voice
Ticket
12. EXCHANGE. DEV. WIKI. BLOG. DOC. | WWW.ICINGA.ORG
Icinga 2 – What it does?
#icinga
Reports
13. EXCHANGE. DEV. WIKI. BLOG. DOC. | WWW.ICINGA.ORG
#icinga
Icinga 2 - Overview
• Based on C++ and Boost
– Supports all major *NIX and Windows platforms
• Powerful CLI
• Supports MySQL and PostgreSQL
• Includes a extensive template library
• Version 2.3 is out since early March
• Puppet, Chef and Ansible support
• Packages and Vagrant Box available now!
18. EXCHANGE. DEV. WIKI. BLOG. DOC. | WWW.ICINGA.ORG
Icinga 2 - Configuration
• Different config format
• Won’t miss the old config!
• It is really time for change
• You will love it!
#icinga
19. EXCHANGE. DEV. WIKI. BLOG. DOC. | WWW.ICINGA.ORG
Icinga 2 – Configuration - Assign a service to multiple hosts in the old world
define service{
host_name linux1,linux2,linux3,...,linux9
service_description ssh-check
other service directives ...
}
#icinga
20. EXCHANGE. DEV. WIKI. BLOG. DOC. | WWW.ICINGA.ORG
#icinga
Icinga 2 – Configuration – Assign service using apply
apply Service "ssh" {
import "generic-service”
check_command = "ssh”
assign where host.address && host.vars.os == "Linux”
}
21. EXCHANGE. DEV. WIKI. BLOG. DOC. | WWW.ICINGA.ORG
#osmc
Icinga 2 – Configuration – Assign to Hostgroup in the old world
define hostgroup{
hostgroup_name linux-servers
alias Linux Servers
members linux1,linux2,linux3
}
26. EXCHANGE. DEV. WIKI. BLOG. DOC. | WWW.ICINGA.ORG
CA Zones API
Icinga 2 - Cluster Overview
Cluster
#icinga
27. EXCHANGE. DEV. WIKI. BLOG. DOC. | WWW.ICINGA.ORG
#osmc
Icinga 2 - Cluster Architecture
• API communication using SSL
• Bidirectional connections supported
• Zone support for logic splits in the configuration
• Hash-based load distribution
• “binlog” like retention for monitoring events and messages
• Distributed components throughout the cluster
• Automatic redistribution of checks
• Integrated health check
31. EXCHANGE. DEV. WIKI. BLOG. DOC. | WWW.ICINGA.ORG
#icinga
Icinga Web 2
• Lightweight like Icinga classic and flexible like Icinga Web
• Easy to extend and embed into other projects
• Support for multiple authentication providers
– Internal DB
– LDAP
– HTTP Auth
• Support for all standard backends
• Supports multiple backends simultaneously, as failover backend
• Responsive actions
• FAST!
36. EXCHANGE. DEV. WIKI. BLOG. DOC. | WWW.ICINGA.ORG
#icinga
The Community - Users
You?
37. EXCHANGE. DEV. WIKI. BLOG. DOC. | WWW.ICINGA.ORG
#icinga
The Community - Icinga Camps 2015
Kuala Lumpur 2015
June 9th
Portland 2015
October 10th
Antwerp 2015
April 13th
39. EXCHANGE. DEV. WIKI. BLOG. DOC. | WWW.ICINGA.ORG
Conclusion
• Download Icinga 2
– Use the packages
– Play with Vagrant and VirtualBox
– You can download the sources but we prefer the packages
• Rethink you configuration
– You can use the migration, but it is time for a change
• Install Icinga Web 2 and play with it
• Give us feedback
#icinga
40. EXCHANGE. DEV. WIKI. BLOG. DOC. | WWW.ICINGA.ORG
#icinga
Questions & Answers
Web www.icinga.org
Git git.icinga.org
Development dev.icinga.org
Wiki wiki.icinga.org
Support support.icinga.org
Twitter twitter.com/icinga
Facebook facebook.com/icinga Get support
Get involved
Get heard