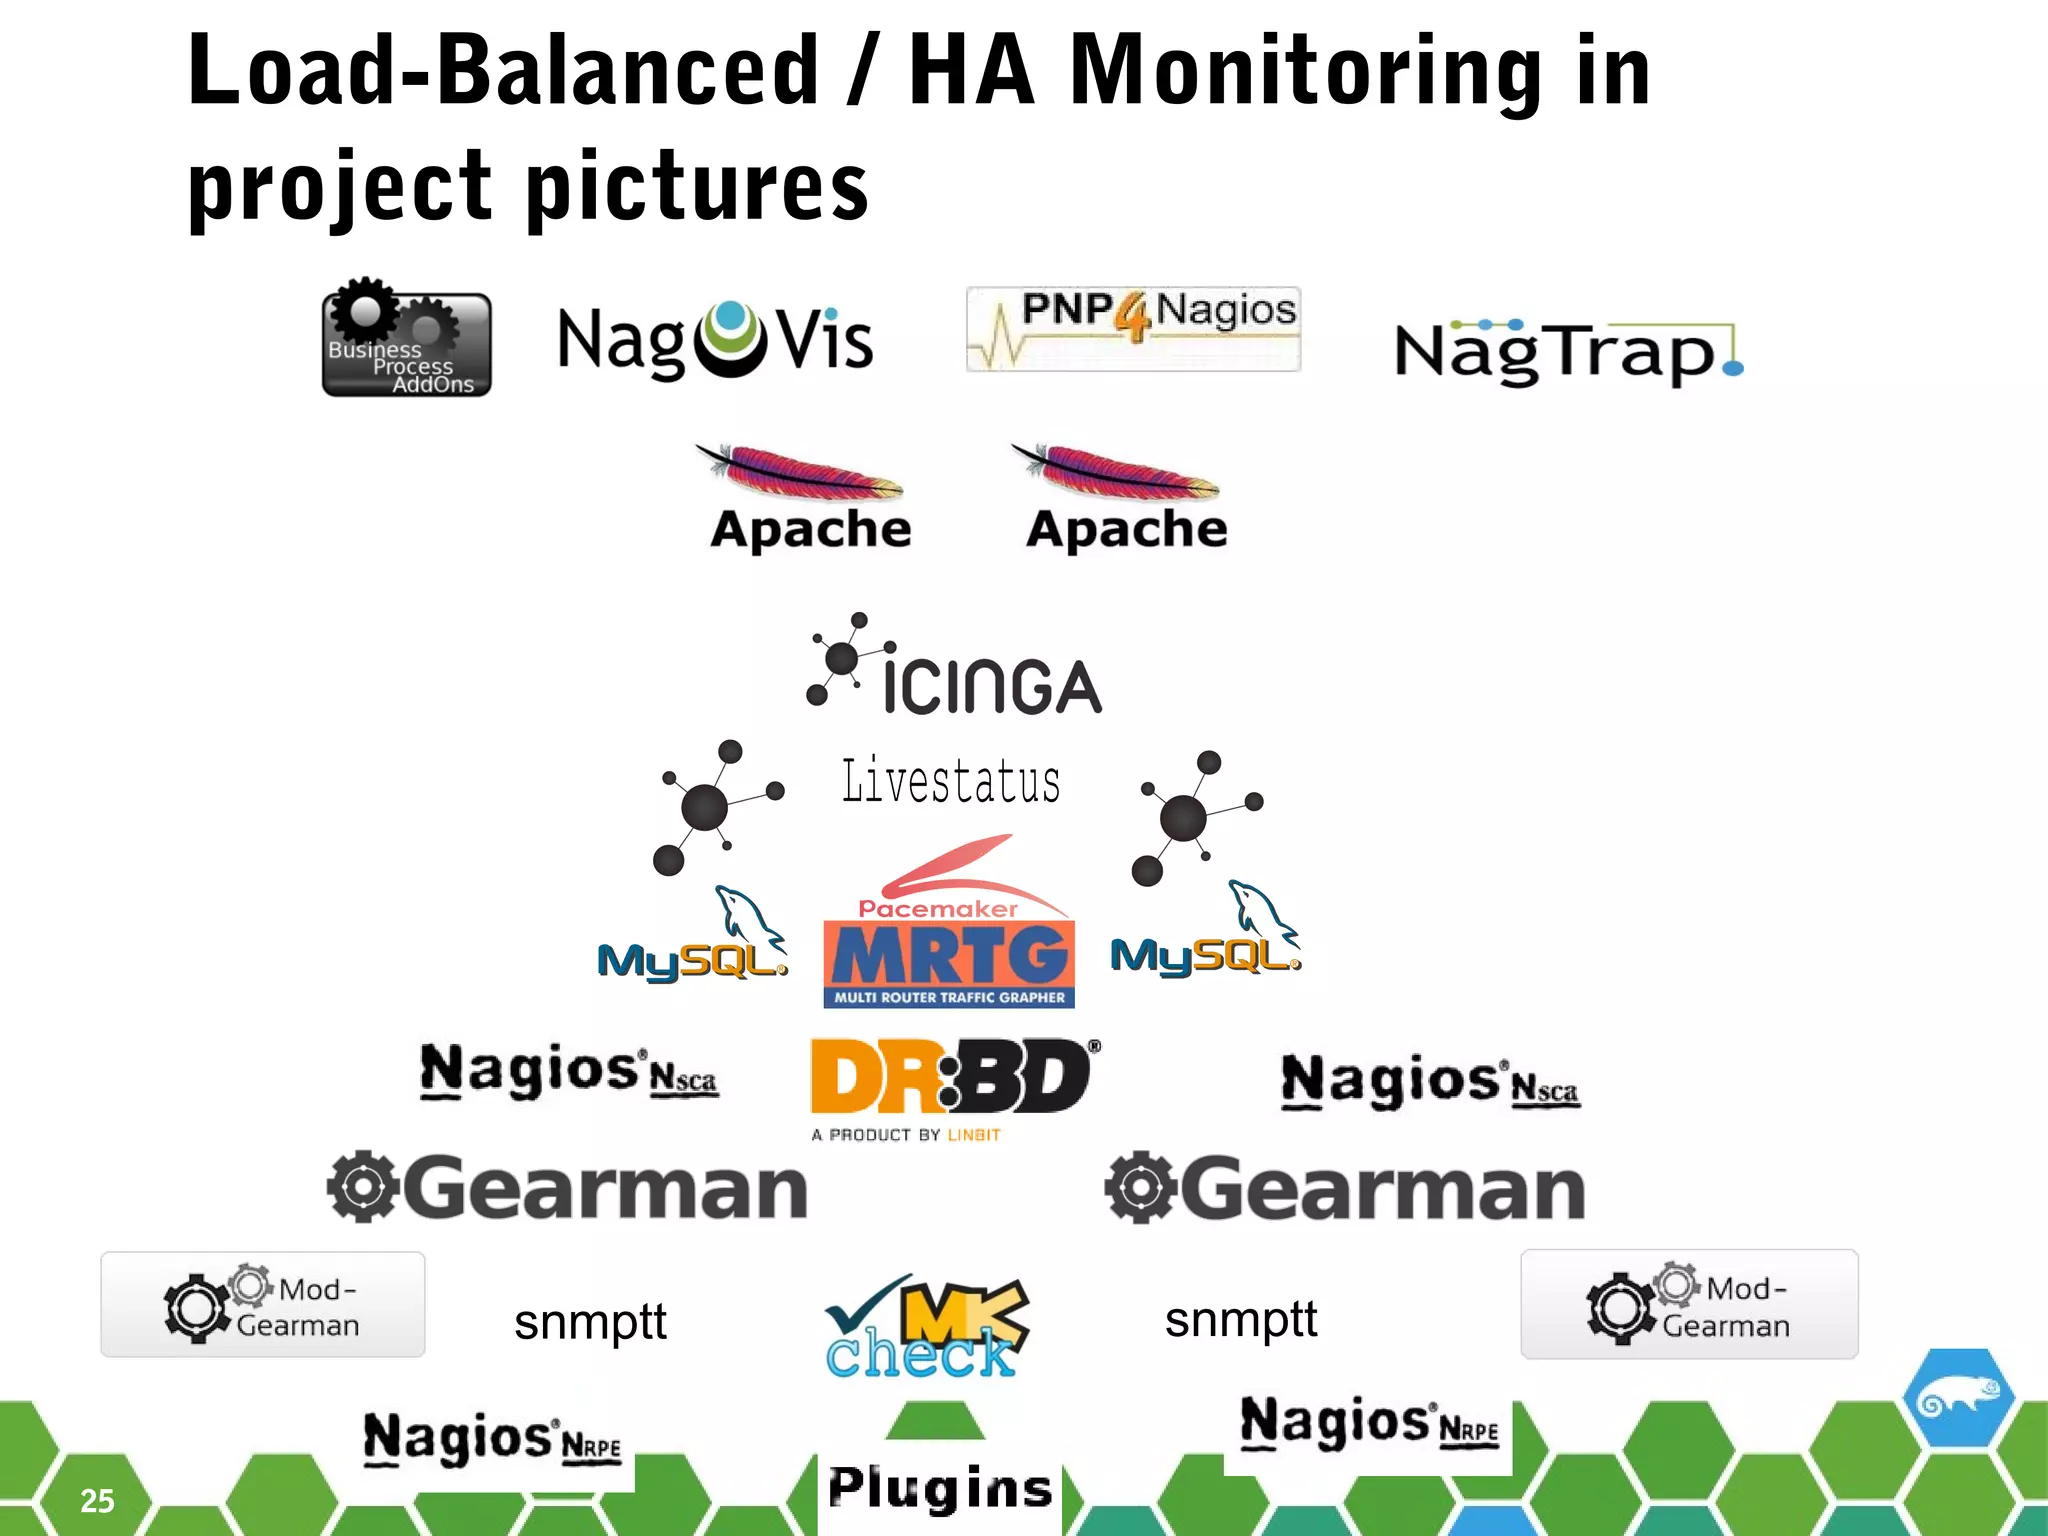
Thousands of running services on hundreds of machines ask the admins to pay attention. At all times, on all channels, with all available software packages that openSUSE has to offer.
Lars does not only keep an eye on all devices inside SUSE R&D, he is also maintaining some of the biggest packages in the server:monitoring repository like Nagios, Icinga, Shinken, check_mk, mod_gearman, Naemon, PNP4Nagios or the monitoring-plugins (and others).
The integration of some of those packages into a complex, secure and high available monitoring setup together with some tips and tricks and insights into the SUSE R&D infrastructure will be demonstrated.
2. 2
Agenda
• Official history
• What are you using at SUSE?
• Where are the Nagios Plugins?
• SUSE R&D internal usage
• Tips & Tricks
• High available, load balanced monitoring
• Demo (if possible)
3. 3
The short history of
Monitoring in SUSE, Part 1
• Saturday, October 23, 2001
SuSE Linux 7.3
* The first monitoring tool NetSaint version 0.0.7b6
• Monday, September 30, 2002
SuSE Linux 8.1
* Welcome Nagios in SuSE (version 1.0b4)
• Saturday, April 16, 2005
SuSE Linux 9.3
* Nagios (in SuSE v 1.2 ) was project of month on SourceForge.net.
4. 4
The short history of
Monitoring in SUSE, Part 2
• Monday, June 18 2007
SUSE Linux Enterprise Server 10 SP1
* Nagios version 2.6 was with us until 2013
• Tuesday, March 24, 2009
SUSE Linux Enterprise Server 11
* Nagios version 3.0.6 as monitoring tool is stronger then never...
• Wednesday , April 6, 2009
Icinga forked Nagios
Icinga will be part of the next SUSE Manager release
=> Migrating from Nagios to Icinga 1.x is easy
5. 5
What are you using at SUSE?
• SUSE Linux Enterprise Server with High
Availability Extension
• Additional packages from obs://server:monitoring,
obs://devel:languages:perl and
obs://network:telephony
• Internal packages (for no-src/legal-problematic
packages – mostly license problems…)
We release all “internal tools” in obs://server:monitoring as soon as
possible and if there are no legal reasons (which only
affects a handful of packages/scripts).
6. 6
Where are the Nagios Plugins?
• https://bugzilla.suse.com/show_bug.cgi?id=859105
and especially
https://bugzilla.redhat.com/show_bug.cgi?id=1054340
have all details
• 2014-07-15: nagios-plugins* got renamed to
monitoring-plugins*. Since that day, we have
‒ unmaintained nagios-core-plugins* and
‒ maintained monitoring-plugins*
packages in server:monitoring
8. 8
SUSE R&D “specials”
• Crazy customers (developers)
• “No need for monitoring or statistics” – until
something breaks or gets relevant for
business ???
• Multiple dual-stacked networks (IPv4 + IPv6)
separated via Firewalls
• Production vs. Development => high amount of
moving targets
• Multiple hardware vendors, even NDA hardware
without any further details or manuals
• Luckily mostly unique Operating Systems :-) but
many different services
9. 9
The Past
Services
43 2000
15 65
12 120
70 2185
Maximal
Location Core System Addons Hosts
Nuremberg Nagios
Prague Nagios
Provo Nagios
Summary
Latency in Nuremberg Average
Host Check Latency ~7 seconds ~1.5 seconds
Service Check Latency ~8 seconds ~1 second
10. 10
Current Situation
Services
430 4700
96 1150
140 1700
30 170
696 7720
Maximal
Location Core System Hosts
Nuremberg 1 Icinga
Nuremberg 2 Nagios
Prague Icinga
Provo Nagios
Summary
Latency in Nuremberg Average
Host Check Latency ~5 seconds ~1.5 seconds
Service Check Latency ~3 seconds ~1 second
Nuremberg Prague Provo
0
2000
4000
6000
8000
Services monitored
Past
Current
13. 13
What should be monitored?
Administrator View Business View
Hardware health Service health
Service availability – host based Service availability – business based
Overview about the services and
incidents of single hosts
Overview about the final business
impact, not the service components
Only important for Administrators Important for Managers and
Customers
14. 14
What can be checked?
Nearly everything is possible!
Minimal requirements listed below:
Your script returns one of the following Exit-Codes:
3 : UnknownUnknown – something outside the normal control
range (of your script?) happened
2 : Something criticalcritical happend! Help needed!
1 : well, it works currently – but be warnedwarned
0 : everything okok
Some (human readable) output on STDOUT would be nice, but is not
necessary for Nagios or Icinga itself.
Print performance data on STDOUT, separated from normal output via '|'
https://nagios-plugins.org/doc/guidelines.html.
16. 16
Eventhandlers
If a service or host is in a defined, unwanted state, trigger external
scripts to “solve” the problem automatically.
(Restart apache if it crashes, send SMS if nobody acknowledges a problem, shutdown
all OBS workers if Lars is not available, …)
17. 17
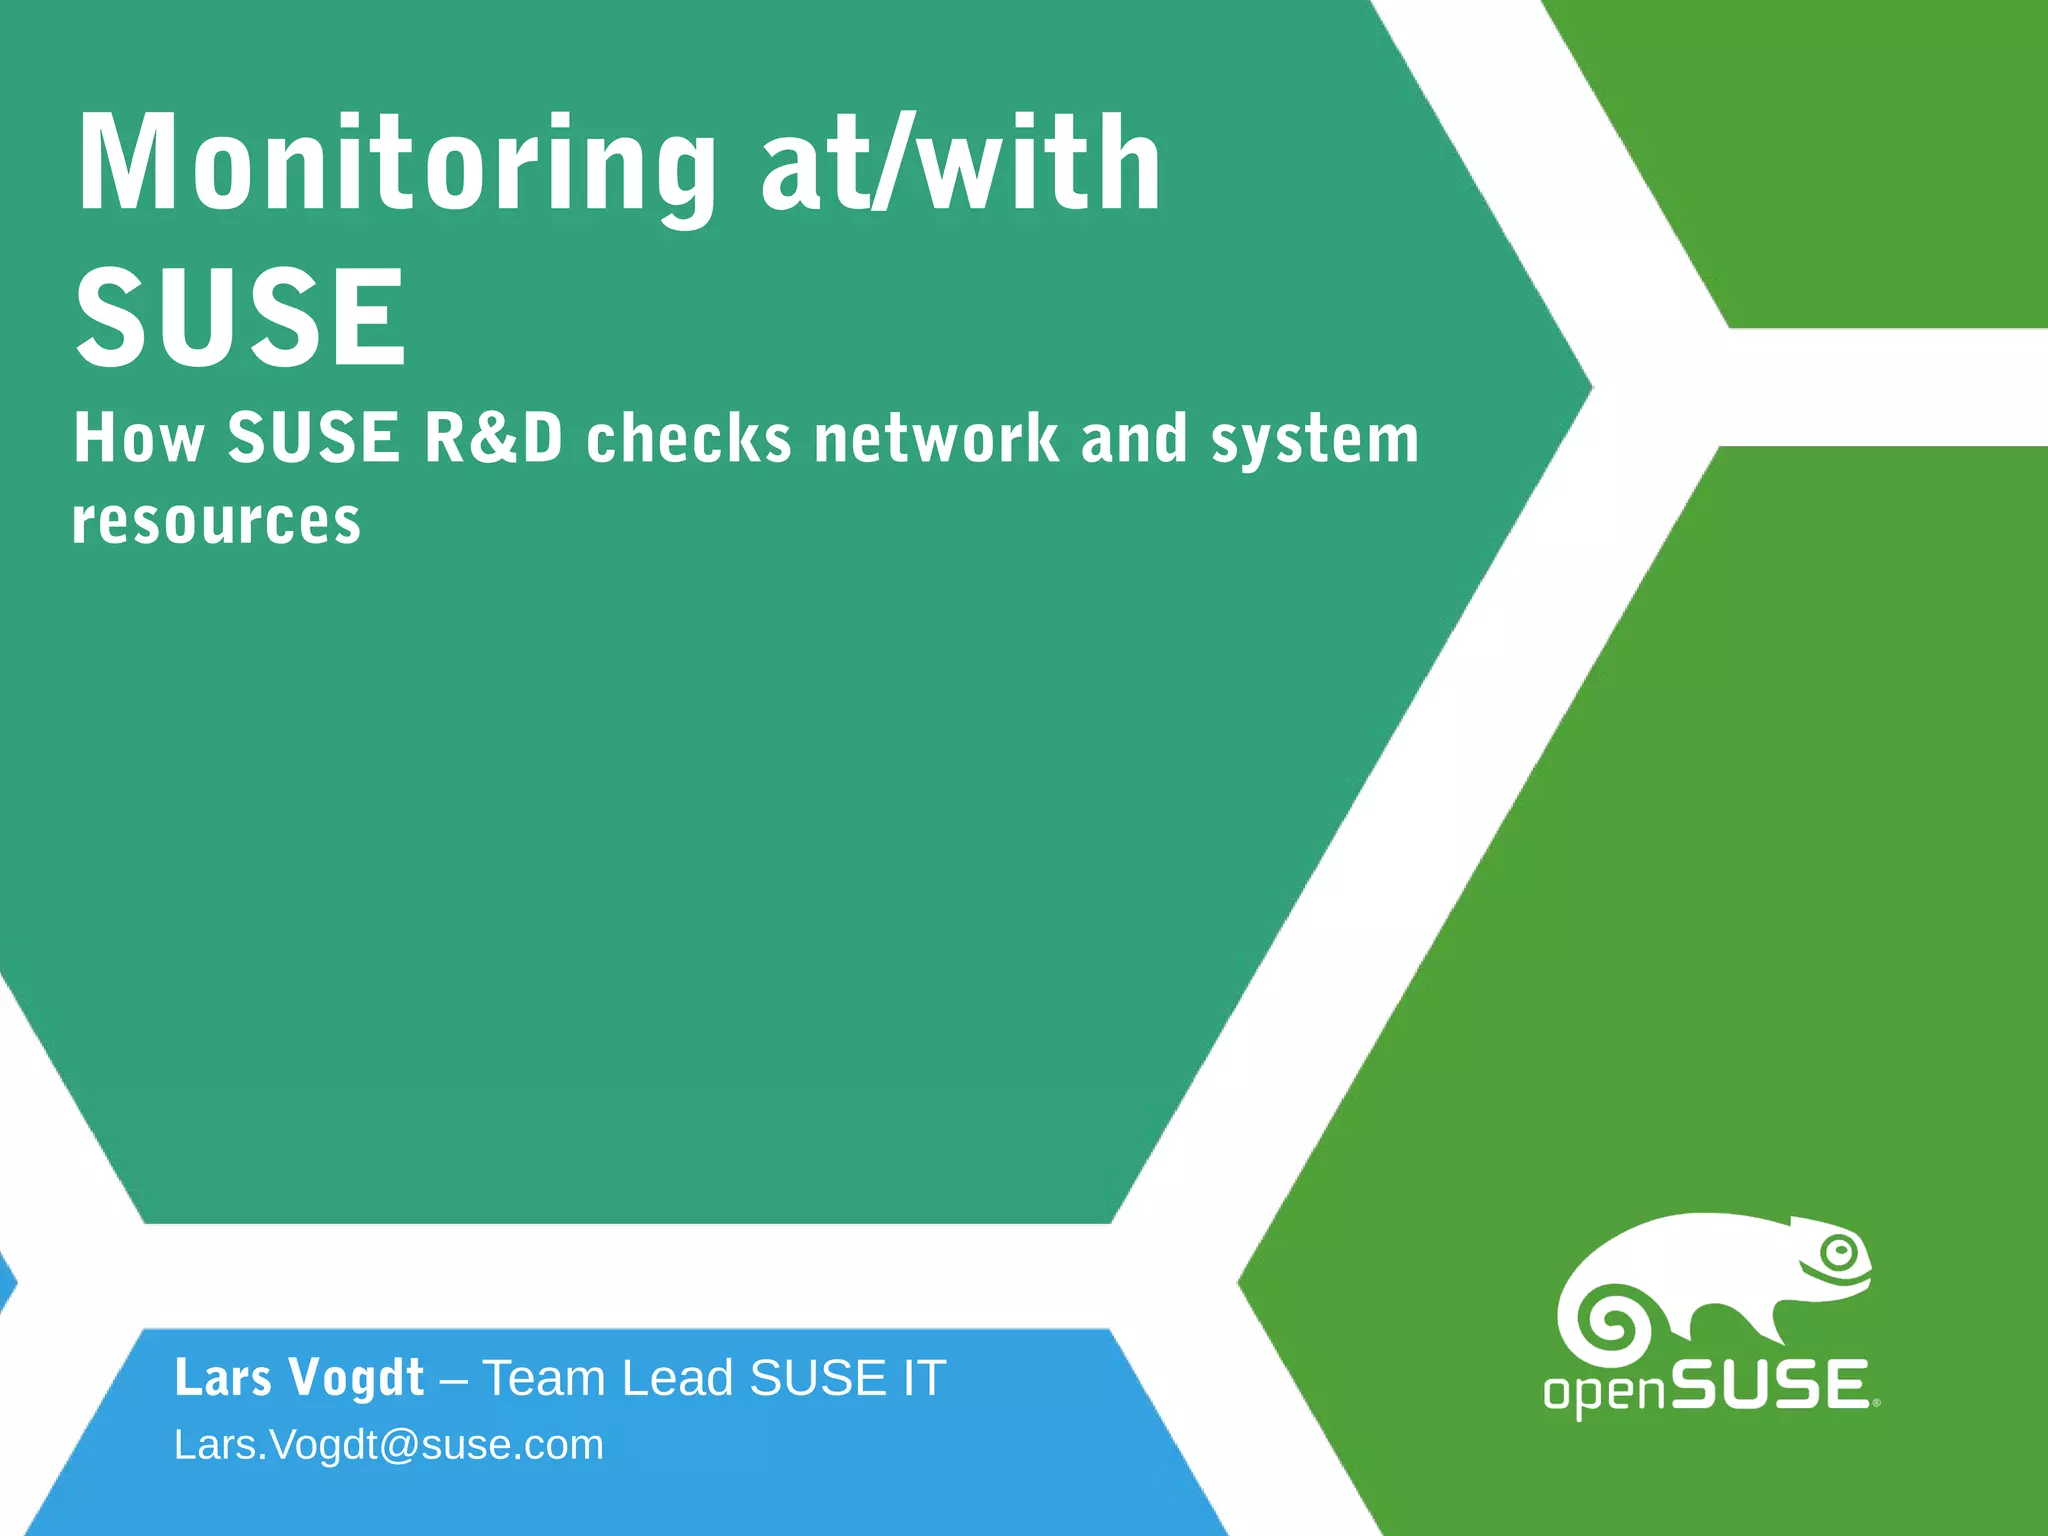
Monitoring SANBoxes with MRTG
For Qlogic, run the following command on your MRTG machine:
/usr/bin/cfgmaker --global "WorkDir: /srv/www/htdocs/mrtg"
--global "Options[_]: growright, bits, unknaszero"
--ifdesc=alias,name --ifref=name --noreversedns --no-down
--show-op-down --subdirs=sanbox-1 –output=/etc/mrtg/sanbox-
1.conf --snmp-options=:::::2 192.168.0.1
...or for Cisco MD:
/usr/bin/cfgmaker --global "WorkDir: /srv/www/htdocs/mrtg"
--global "Options[_]: growright, bits, unknaszero"
--ifdesc=alias --noreversedns --no-down --show-op-down –
subdirs=sanbox-2 –output=sanbox-2.conf --snmp-options=:::::2
192.168.0.2
18. 18
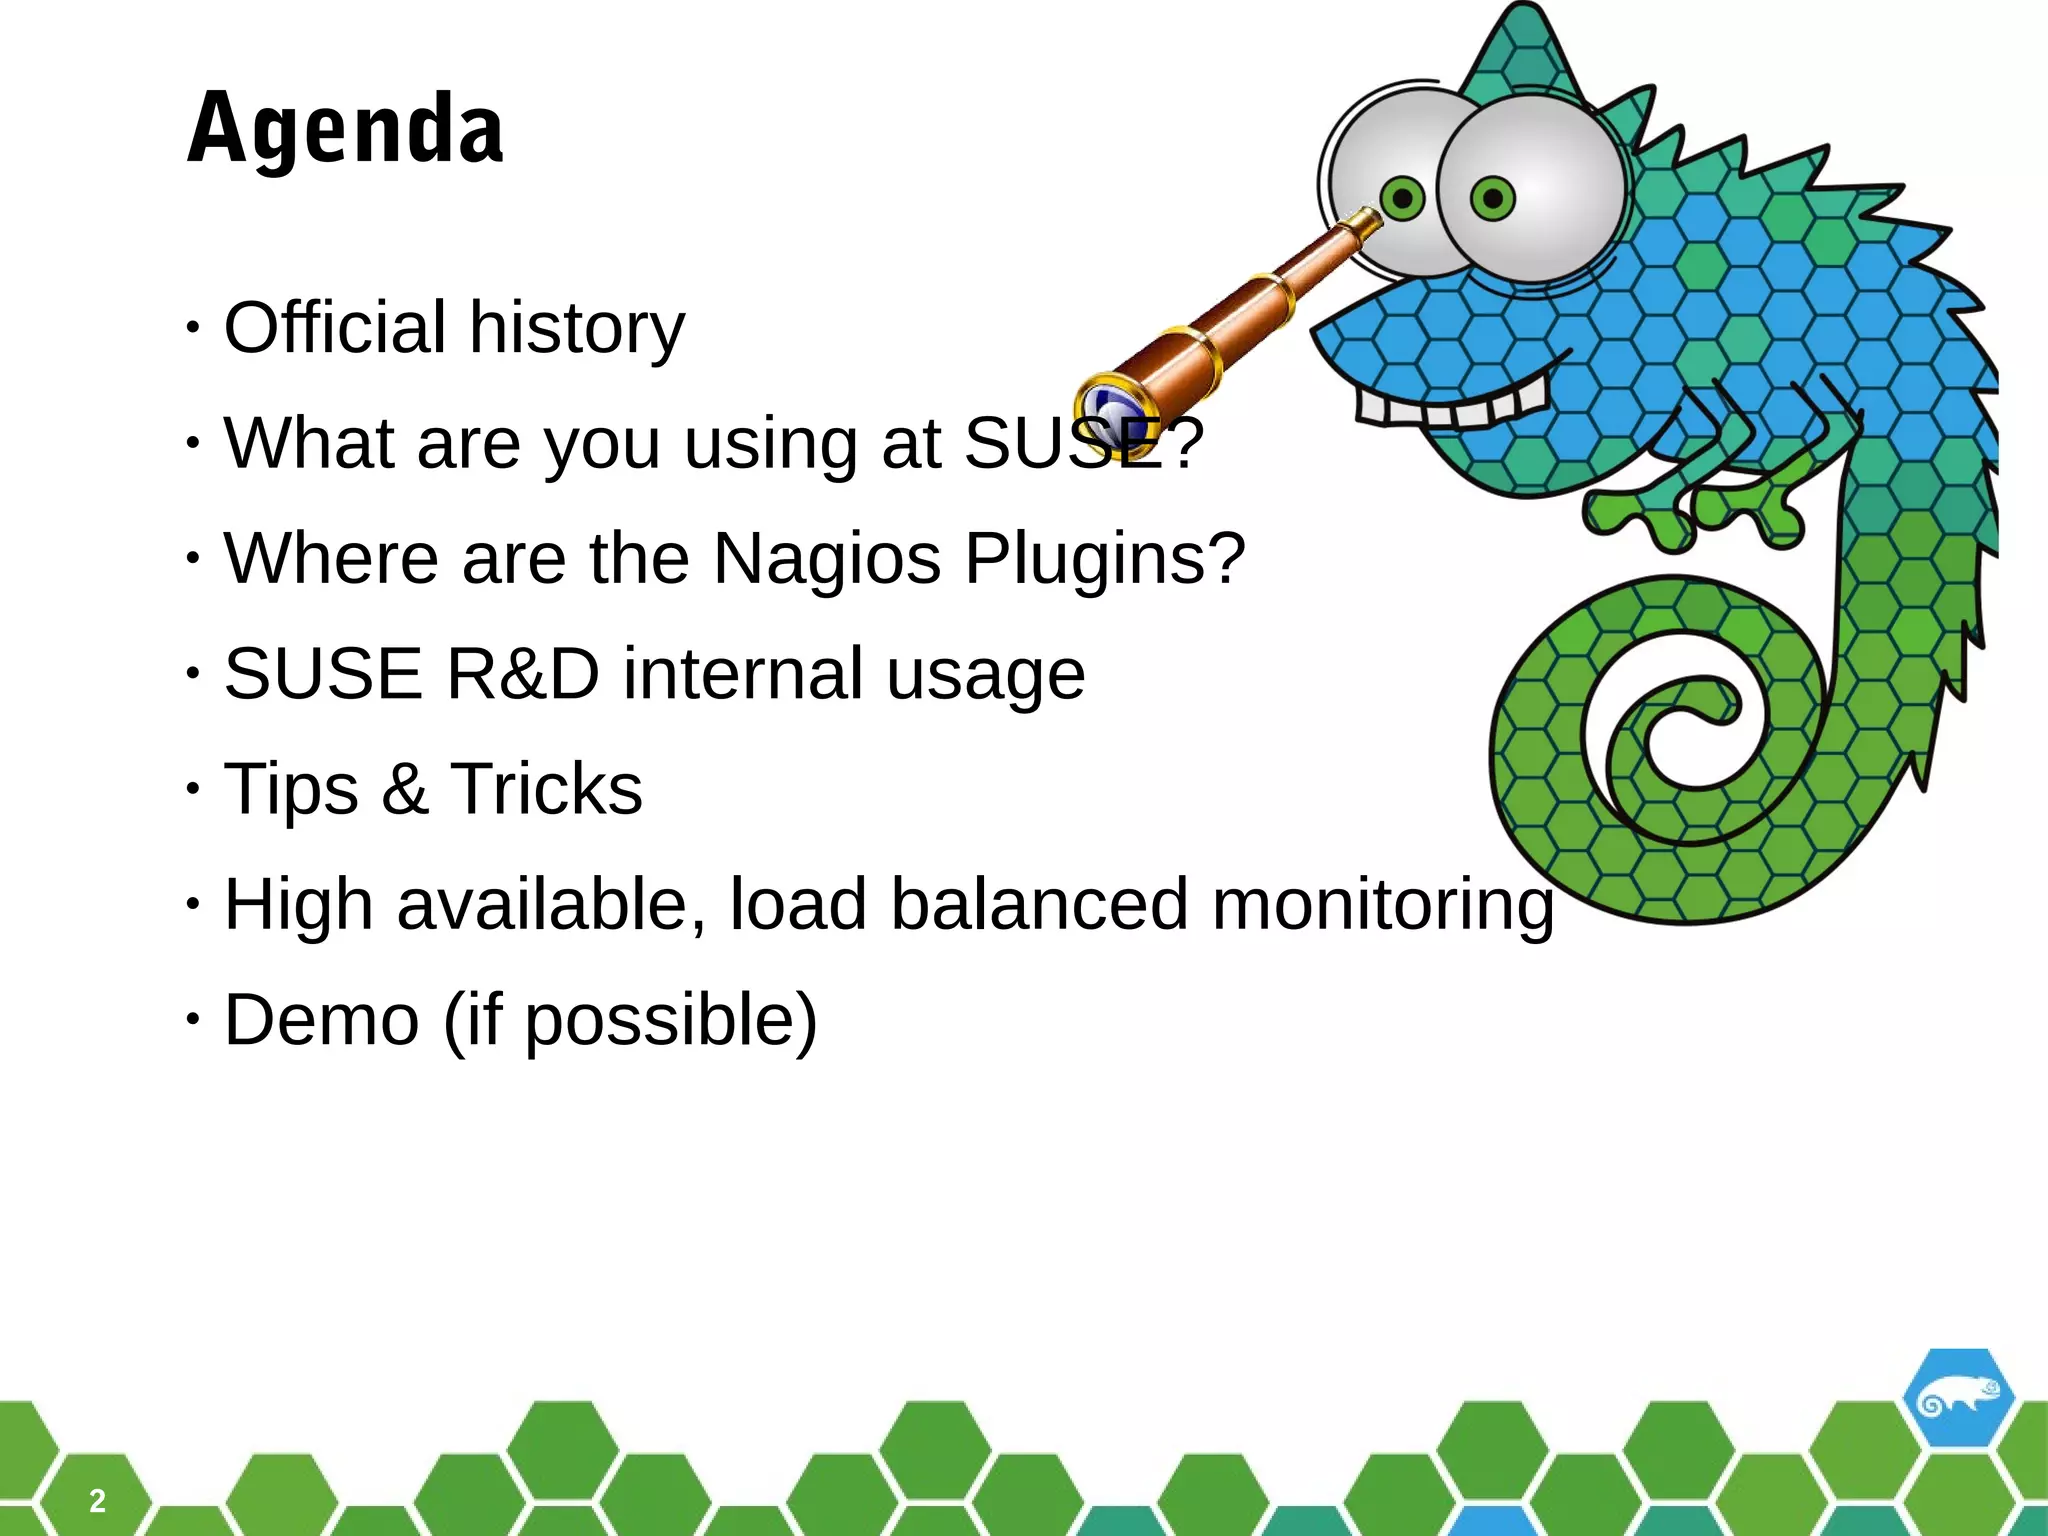
Monitoring IO on your machines
On the machine your want to monitor:
• Install monitoring-plugins-sar-perf
• Prepare a command like (NRPE example):
command[check_iostat_home]=/usr/lib/nagios/plugins/check_iost
at -d root-fs_home -w 120000,120000,120000 -c
150000,150000,150000 -W 30 -C 50
• Maybe also enable sysstat (chkconfig boot.sysstat on), to have
the data available on the host directly
19. 19
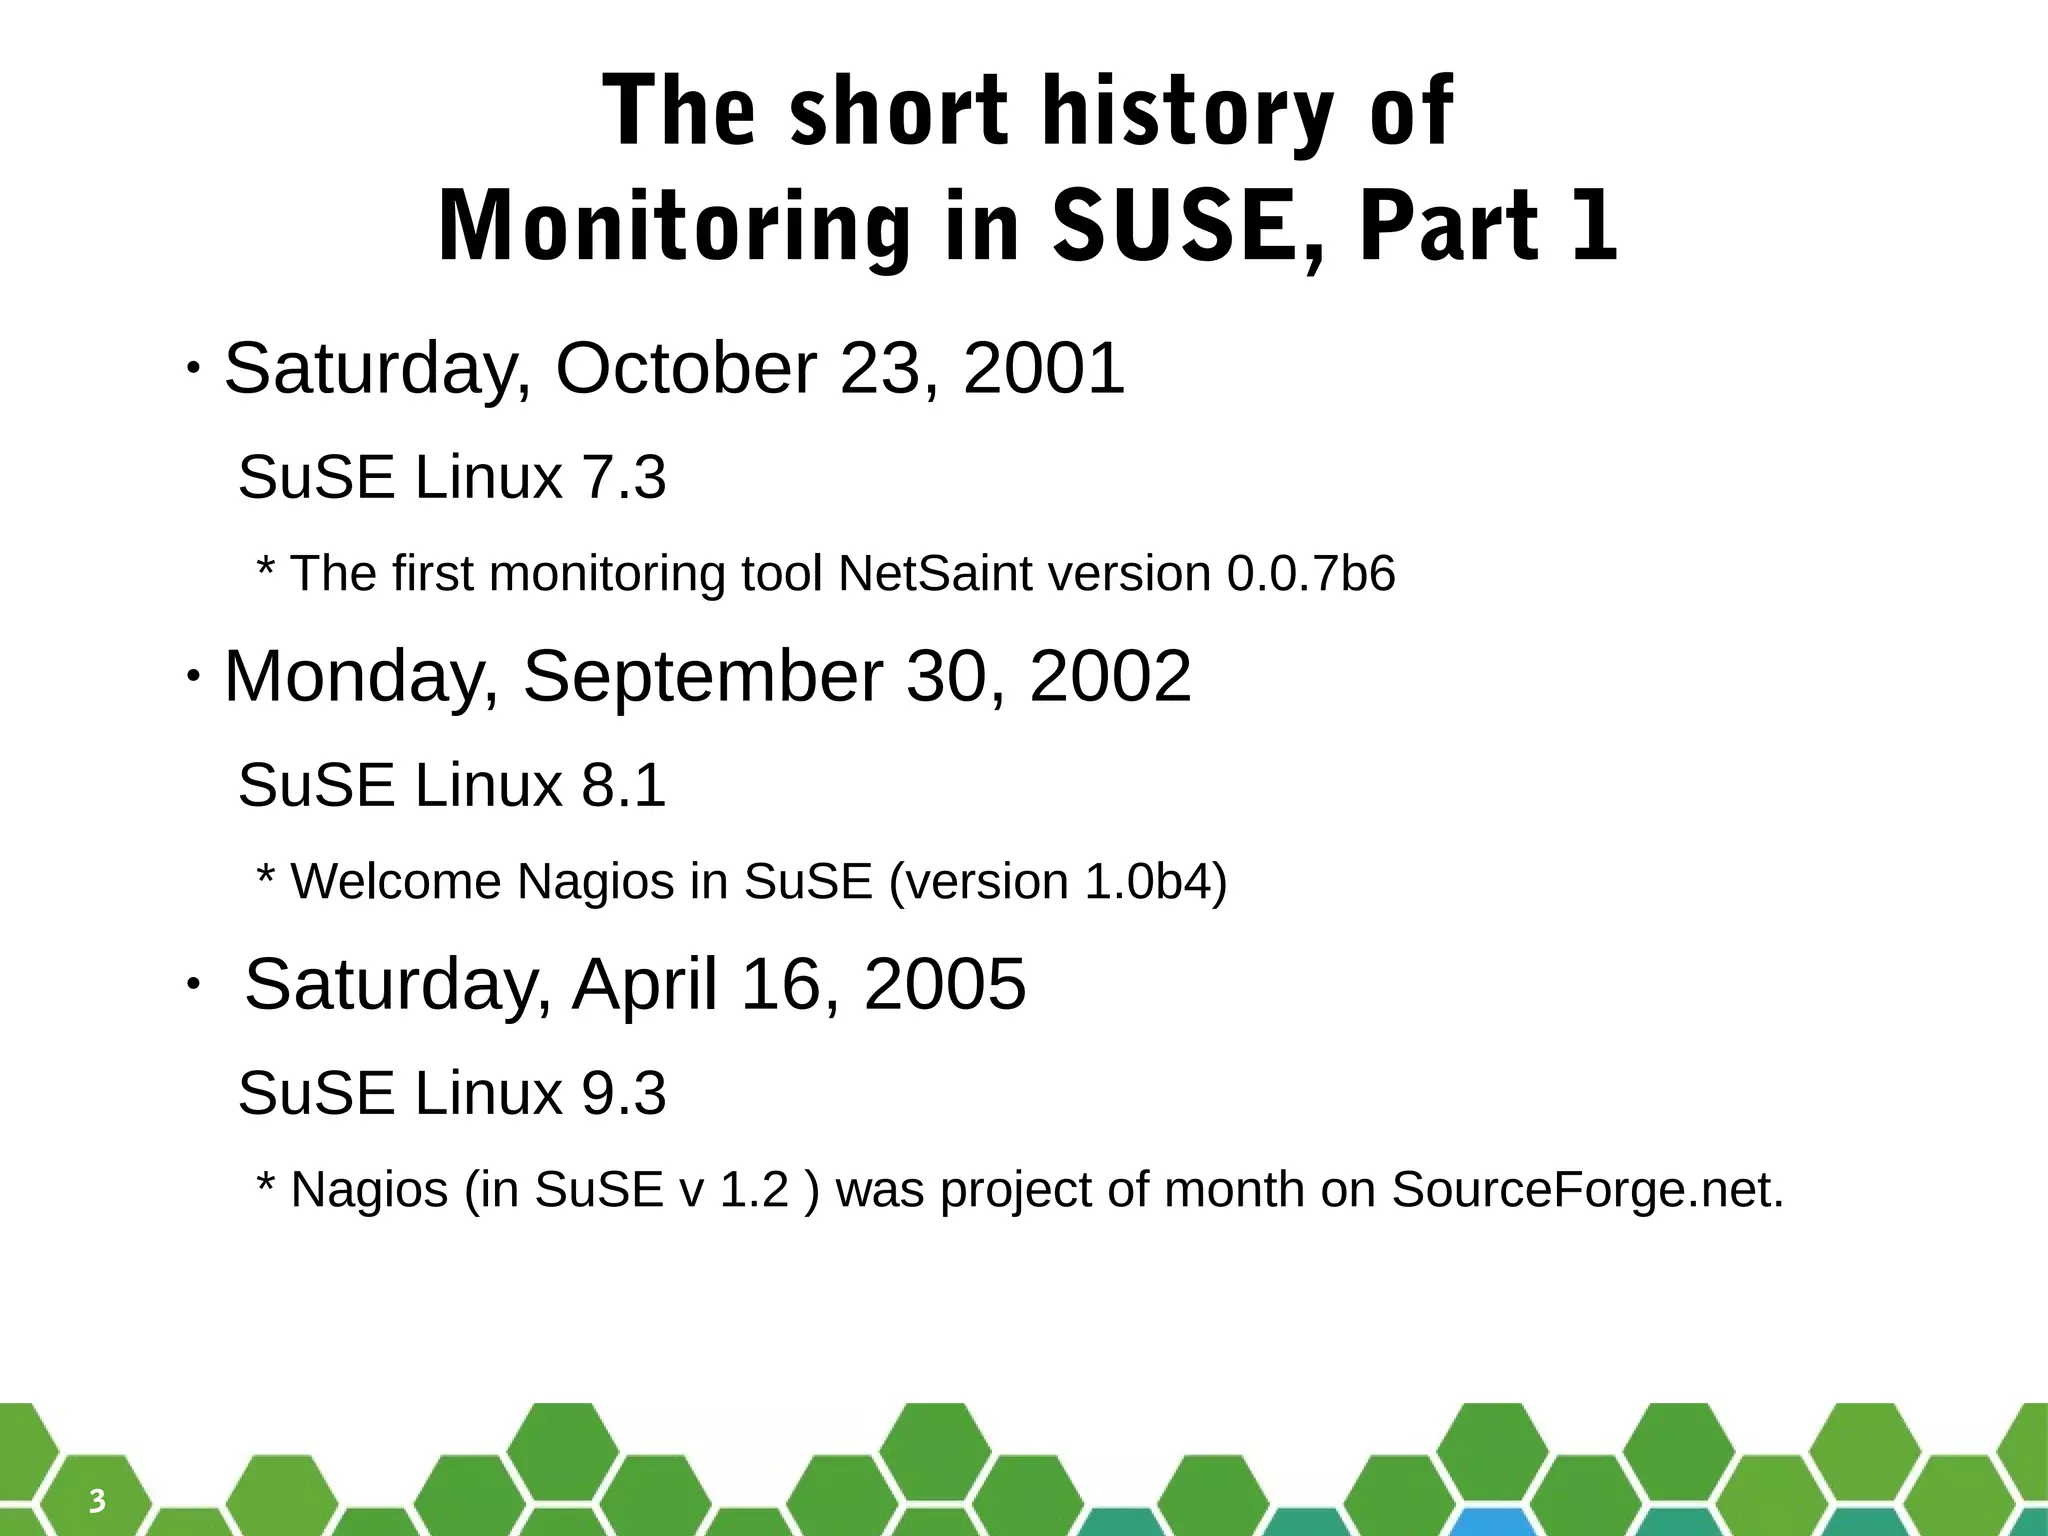
MRTG graphs for network interfaces
of virtual machines
On the Server running the virtual machines, edit /etc/snmp/snmpd.conf :
[...]
rocommunity public 10.0.0.0/16
[...]
On your MRTG machine, run:
/usr/bin/cfgmaker --global "WorkDir:
/srv/www/htdocs/mrtg" --global "Options[_]:
growright, bits, unknaszero" --ifdesc=alias,name
--ifref=name --noreversedns --no-down --show-op-down
--subdirs=vmserv1 --output=vmserv1.conf --snmp-
options=:::::2 10.0.0.101
...and edit the xml definition of your virtual machine:
<interface type='bridge'>
[...]
<target dev='vm1'/>
[...]
</interface>
Now (re-)start snmpd and your virtual machine.
20. 20
Monitoring of MySQL servers
We are currently using two different checks:
• check_mysql (monitoring-plugins-mysql package)
• check_mysql_health (monitoring-plugins-mysql_health package)
You need a database user with "SELECT" access for both options. Usually, this
means that you create a user named "nagios" in MySQL:
mysql> GRANT SELECT on nagios.* TO 'nagios'@'localhost' IDENTIFIED
BY 'nag1os';
mysql> flush privileges;
mysql> quit
Afterward you should be able to check the database via:
/usr/lib/nagios/plugins/check_mysql -H $HOST -u §USER -p $PASS
or:
/usr/lib/nagios/plugins/check_mysql_health --units MB -–mode
threads-connected --username $USER --password $PASS
--warning 40 --critical 50
21. 21
Monitoring of PostgreSQL
• check the file pg_hba.conf on the database server to contain
the correct IP addresses of the monitoring cluster
• create the monitor user via the createuser command as user
postgres:
postgres@pg1:~> createuser --pwprompt --interactive monitor
Enter password for new role:
Enter it again:
Shall the new role be a superuser? (y/n) y
Shall the new role be allowed to create databases? (y/n) n
Shall the new role be allowed to create more new roles?
(y/n) n
• Note: the SUPERUSER privilege is needed for some special
checks like "archive_ready".
• restart the database
• Try on the monitoring cluster:
~> ./check_postgres.pl --dbpass=$PASSWORD –dbuser=$USERNAME
--action=archive_ready -H pg1
POSTGRES_ARCHIVE_READY OK: DB "postgres" (host:pg1) WAL
".ready" files found: 0 | time=0.02s files=0;10;15
22. 22
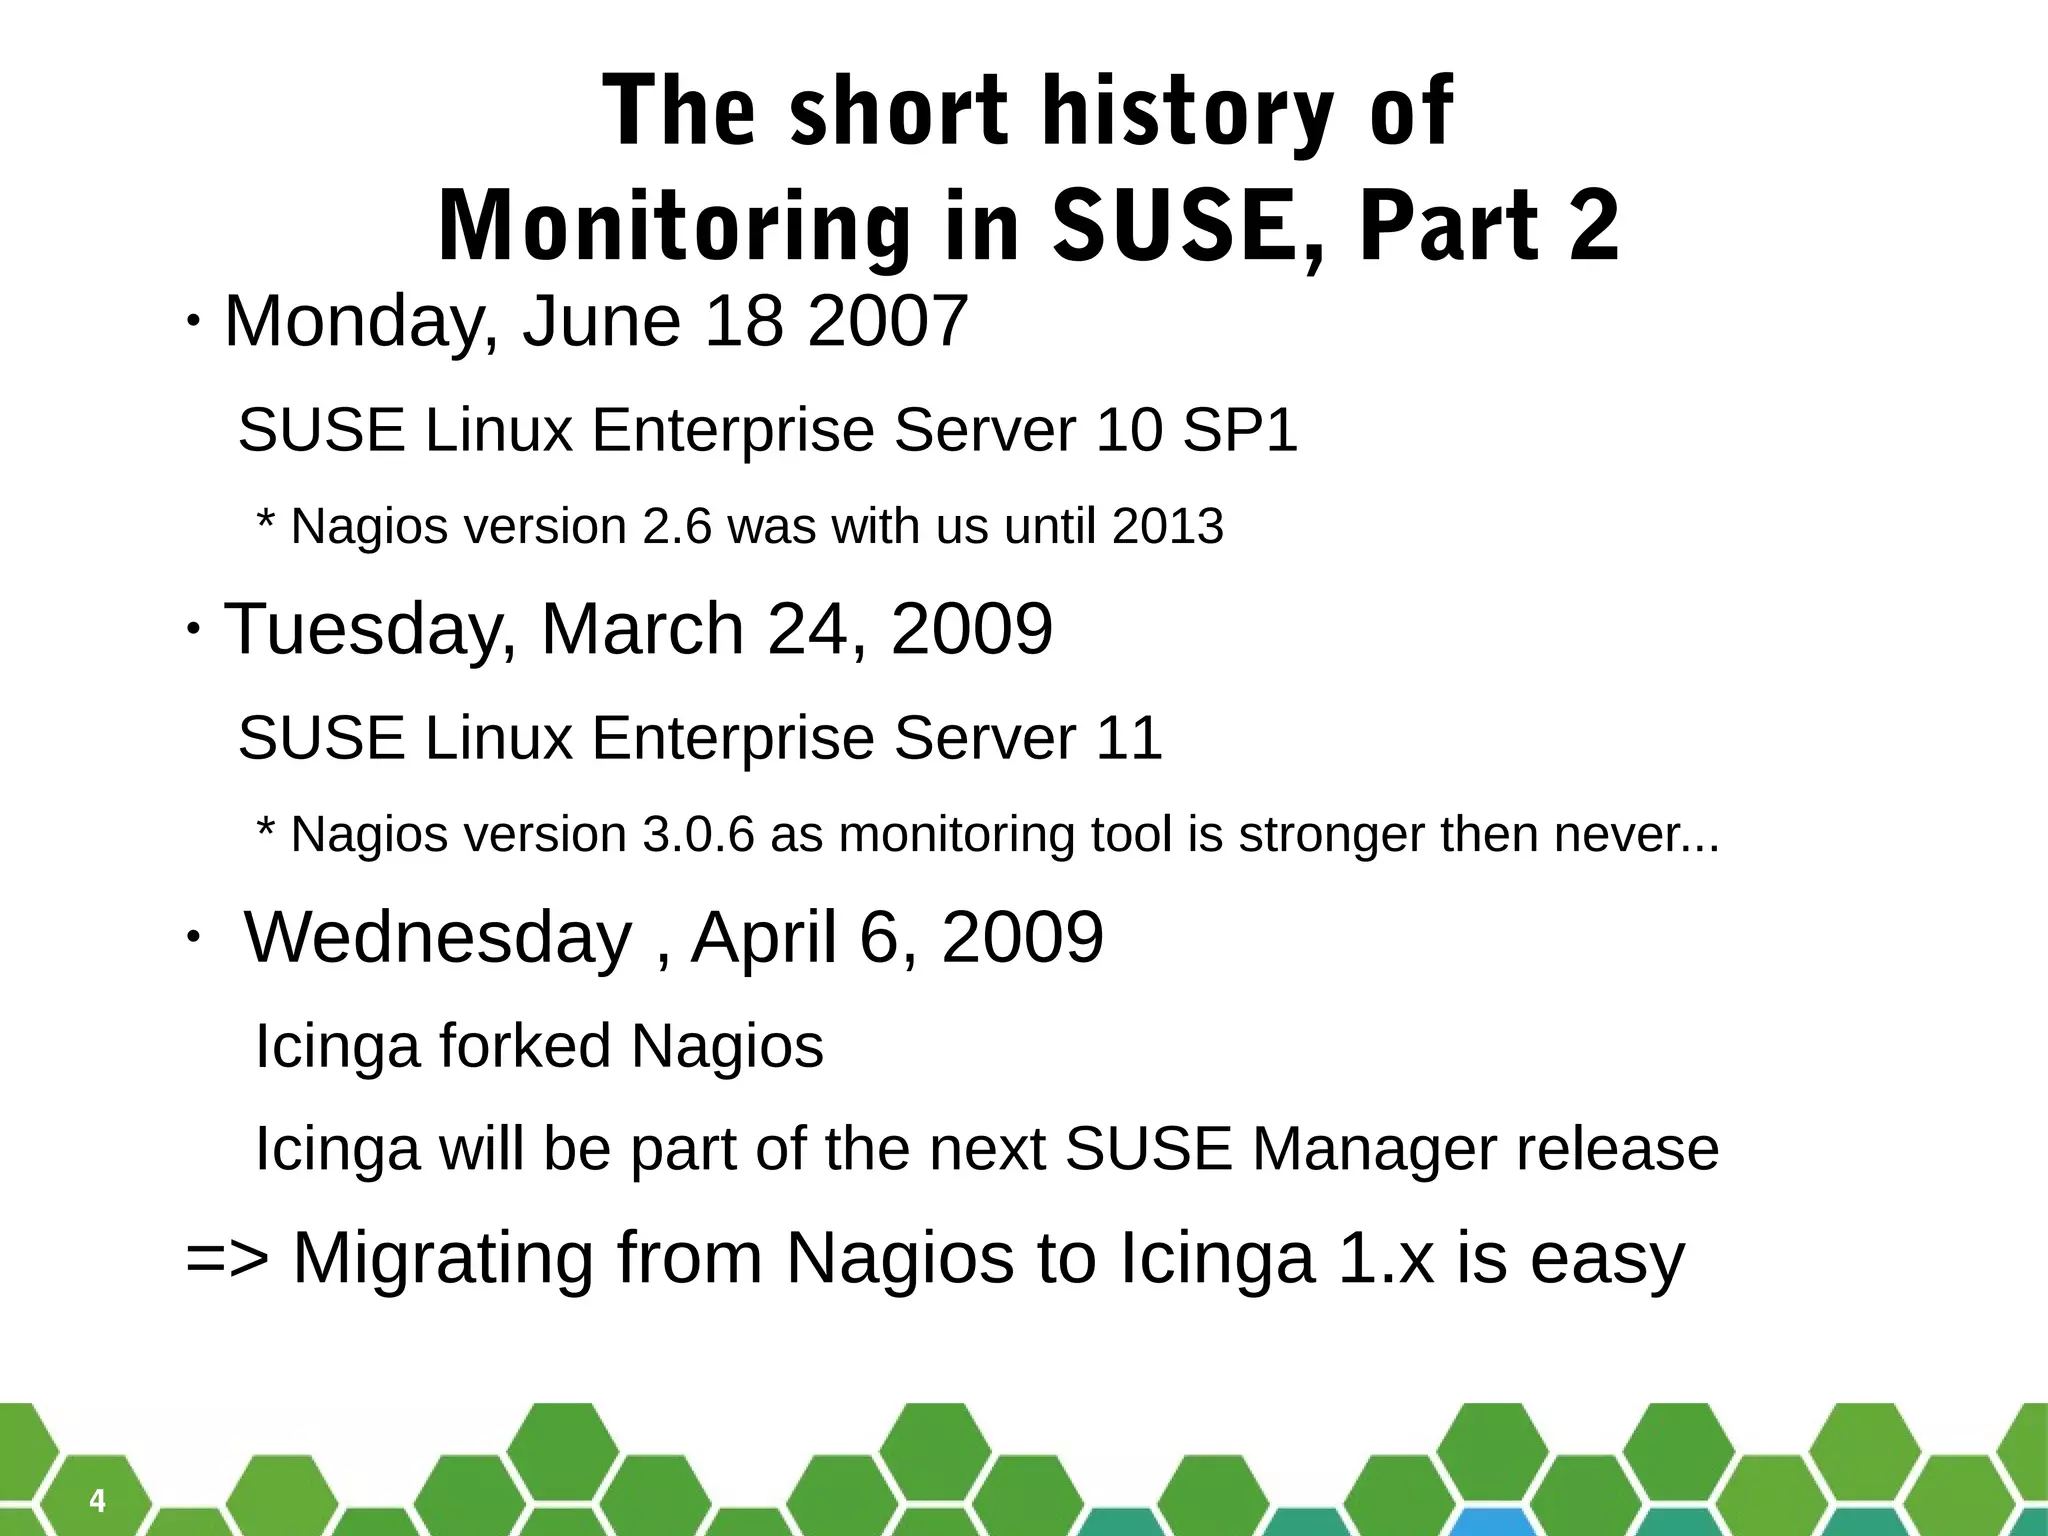
...and there is more...
• More and more monitoring-plugins* packages come with enabled Apparmor
profiles: check /var/log/audit/audit.log if something seems to be crazy
• Re-enable notifications automatically via cron – to not forget it:
#!/bin/bash
CFG=/etc/icinga/icinga.cfg
commandfile=$(grep ^command_file "$CFG" | awk -F'=' '{ print $2 }')
if [ -p "$commandfile" ]; then
now=`date +%s`
printf "[%lu] ENABLE_NOTIFICATIONSn" $now > "$commandfile"
fi
• Monitor your NSCA daemon via monitoring-plugins-nsca and a dummy test (see
README)
• Create performance data for your monitoring:
#!/bin/bash
if /etc/init.d/icinga status >/dev/null 2>/dev/null ; then
if [ -p /var/run/icinga/icinga.cmd ]; then
su – icinga -c "/usr/lib/nagios/plugins/check_nagiostats
--EXEC /usr/sbin/icingastats --passive $HOST
icingastats >> /var/run/icinga/icinga.cmd"
fi
fi
• Monitor your monitoring setup!
24. 24
Basic overview
• Corosync Pacemaker Cluster (two main machines
+ one VM just for Quorum) – using IPMI for
STONITH
• DRBD to provide storage (PNP, Logs) on both
main machines
• Services like MySQL (cluster), snmptrapd or
NSCA run “unmanaged” on all nodes
• mod_gearman for Load-Balancing/Failover of
normal checks
• check_mk for automatic checks and Load-
Reducing
• MRTG for statistics from Network and SAN (for
historical reasons)
28. Thank you.
Join the conversation,
contribute & have a lot of fun!
www.opensuse.org
29. 29
Have a Lot of Fun, and Join Us
At:
www.opensuse.org
30. General Disclaimer
This document is not to be construed as a promise by any participating organisation to
develop, deliver, or market a product. It is not a commitment to deliver any material, code,
or functionality, and should not be relied upon in making purchasing decisions. openSUSE
makes no representations or warranties with respect to the contents of this document, and
specifically disclaims any express or implied warranties of merchantability or fitness for
any particular purpose. The development, release, and timing of features or functionality
described for openSUSE products remains at the sole discretion of openSUSE. Further,
openSUSE reserves the right to revise this document and to make changes to its content,
at any time, without obligation to notify any person or entity of such revisions or changes.
All openSUSE marks referenced in this presentation are trademarks or registered
trademarks of SUSE LLC, in the United States and other countries. All third-party
trademarks are the property of their respective owners.
License
This slide deck is licensed under the Creative Commons Attribution-ShareAlike 4.0
International license. It can be shared and adapted for any purpose (even
commercially) as long as Attribution is given and any derivative work is distributed
under the same license.
Details can be found at https://creativecommons.org/licenses/by-sa/4.0/
Credits
Template
Richard Brown
rbrown@opensuse.org
Design & Inspiration
openSUSE Design Team
http://opensuse.github.io/branding-
guidelines/
Editor's Notes
ITIL draws your focus to the business/service side