Download as PDF, PPTX

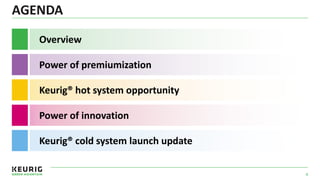


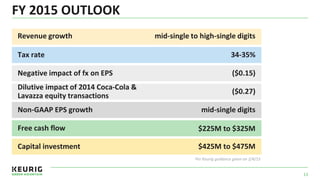
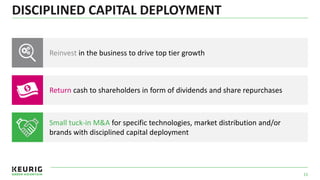
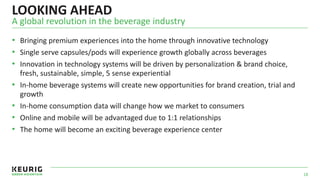


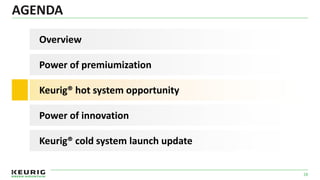


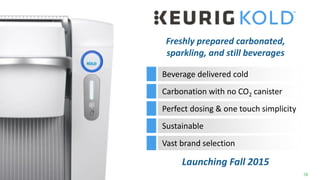


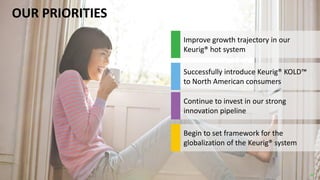
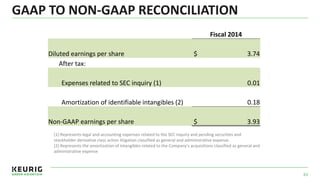


Brian Kelley, CEO of Keurig Green Mountain, discussed the company's outlook and priorities at the CAGNY Conference on February 19, 2015. The company expects mid-single digit non-GAAP EPS growth in fiscal year 2015 despite negative impacts from foreign exchange rates and equity transactions. Keurig's priorities are to successfully launch the Keurig Cold system, continue investing in innovation, improve growth of the Keurig hot system, and begin global expansion of the Keurig system.


![2022 Beverage Forum Non-Alcoholic Workshop[87].pdf](https://cdn.slidesharecdn.com/ss_thumbnails/2022beverageforumnon-alcoholicworkshop87-230227152104-daa6433a-thumbnail.jpg?width=640&height=640&fit=bounds)


