Download as PDF, PPTX


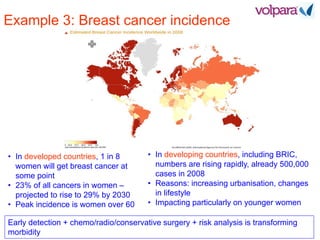
![74M annually worldwide
Compare to previous mammograms
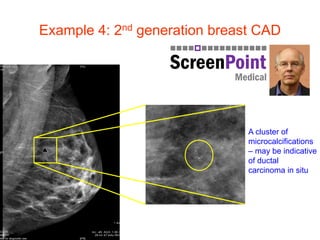
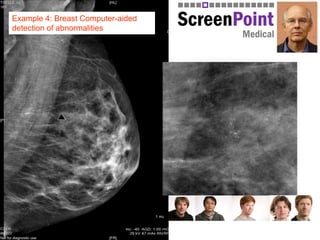
Computer-aided detection
Personalised Screening: Stratification
[5] Berg, W.A. Detection of breast cancer with addition of annual screening ultrasound or a single screening MRI to mammography in women
with elevated breast cancer risk. JAMA 2012, 307: 1394 – 1404.
European Union FP7 Project ASSURE, led by Nico Karssemeijer, with Matakina leading WP1 on density
Mammogram
Low density
Await next screening round
(2-3 years)
High density➔ stratification
Additional imaging
Breast MRI Breast Tomosynthesis Breast Ultrasound Molecular Breast Imaging
+
Mammography is 98% effective in fatty
breasts; but only 48% dense breasts
Lesson 10: work to replace ill-
informed debate with sound
science](https://image.slidesharecdn.com/cypruswhitecoat-160125133418/85/White-Board-to-White-Coats-25-320.jpg)


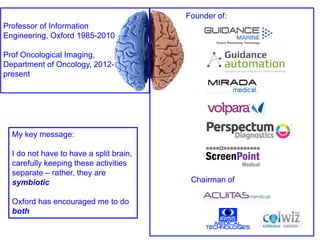
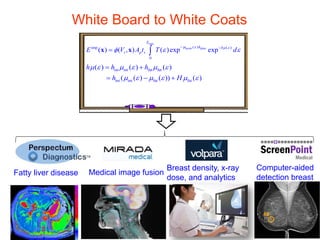
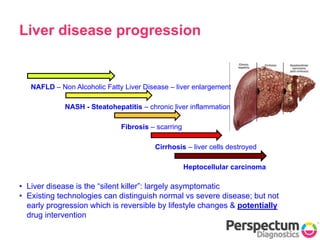
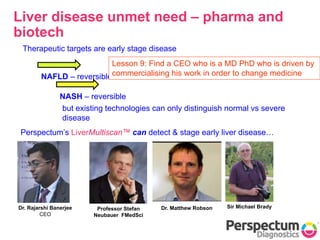
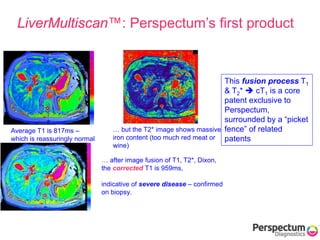
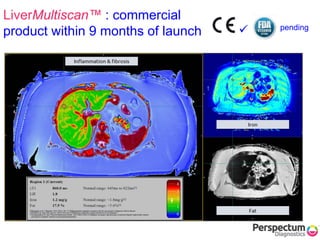
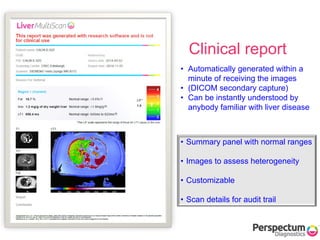
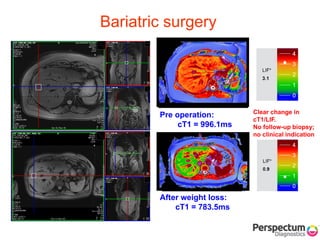
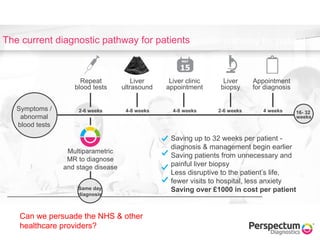
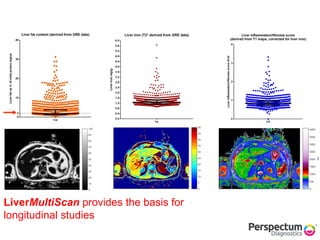
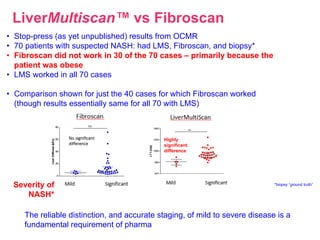
The document presents insights from Professor Sir Michael Brady on the integration of imaging and data analysis in oncology, highlighting advances in liver disease detection and management. It discusses the rise of fatty liver disease and the need for innovative imaging technologies, like Perspectum's LiverMultiScan, to assess early stage liver conditions effectively and reduce the reliance on invasive biopsies. The presentation also emphasizes the importance of commercializing medical imaging research while maintaining a symbiotic relationship between academia and industry.