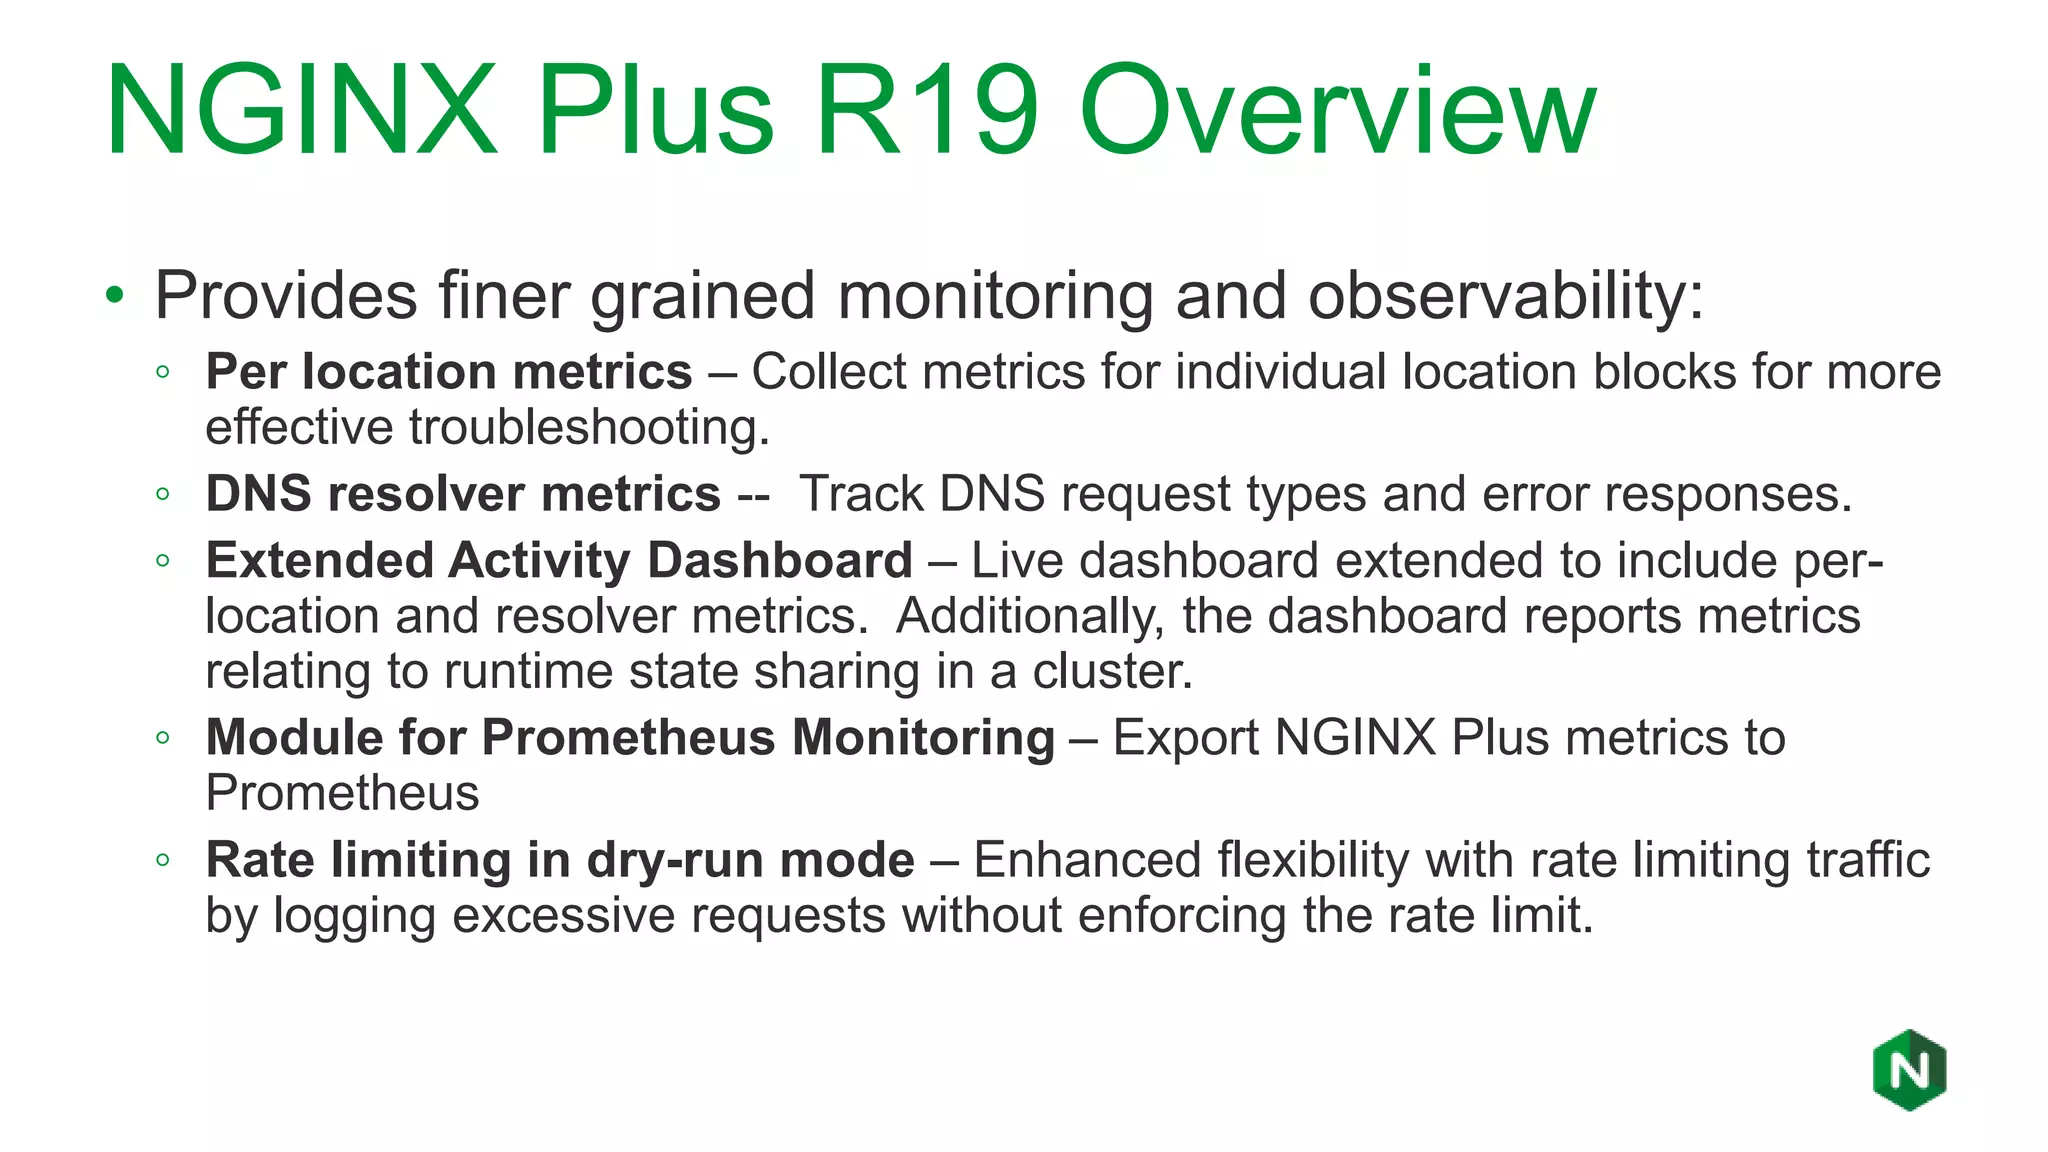
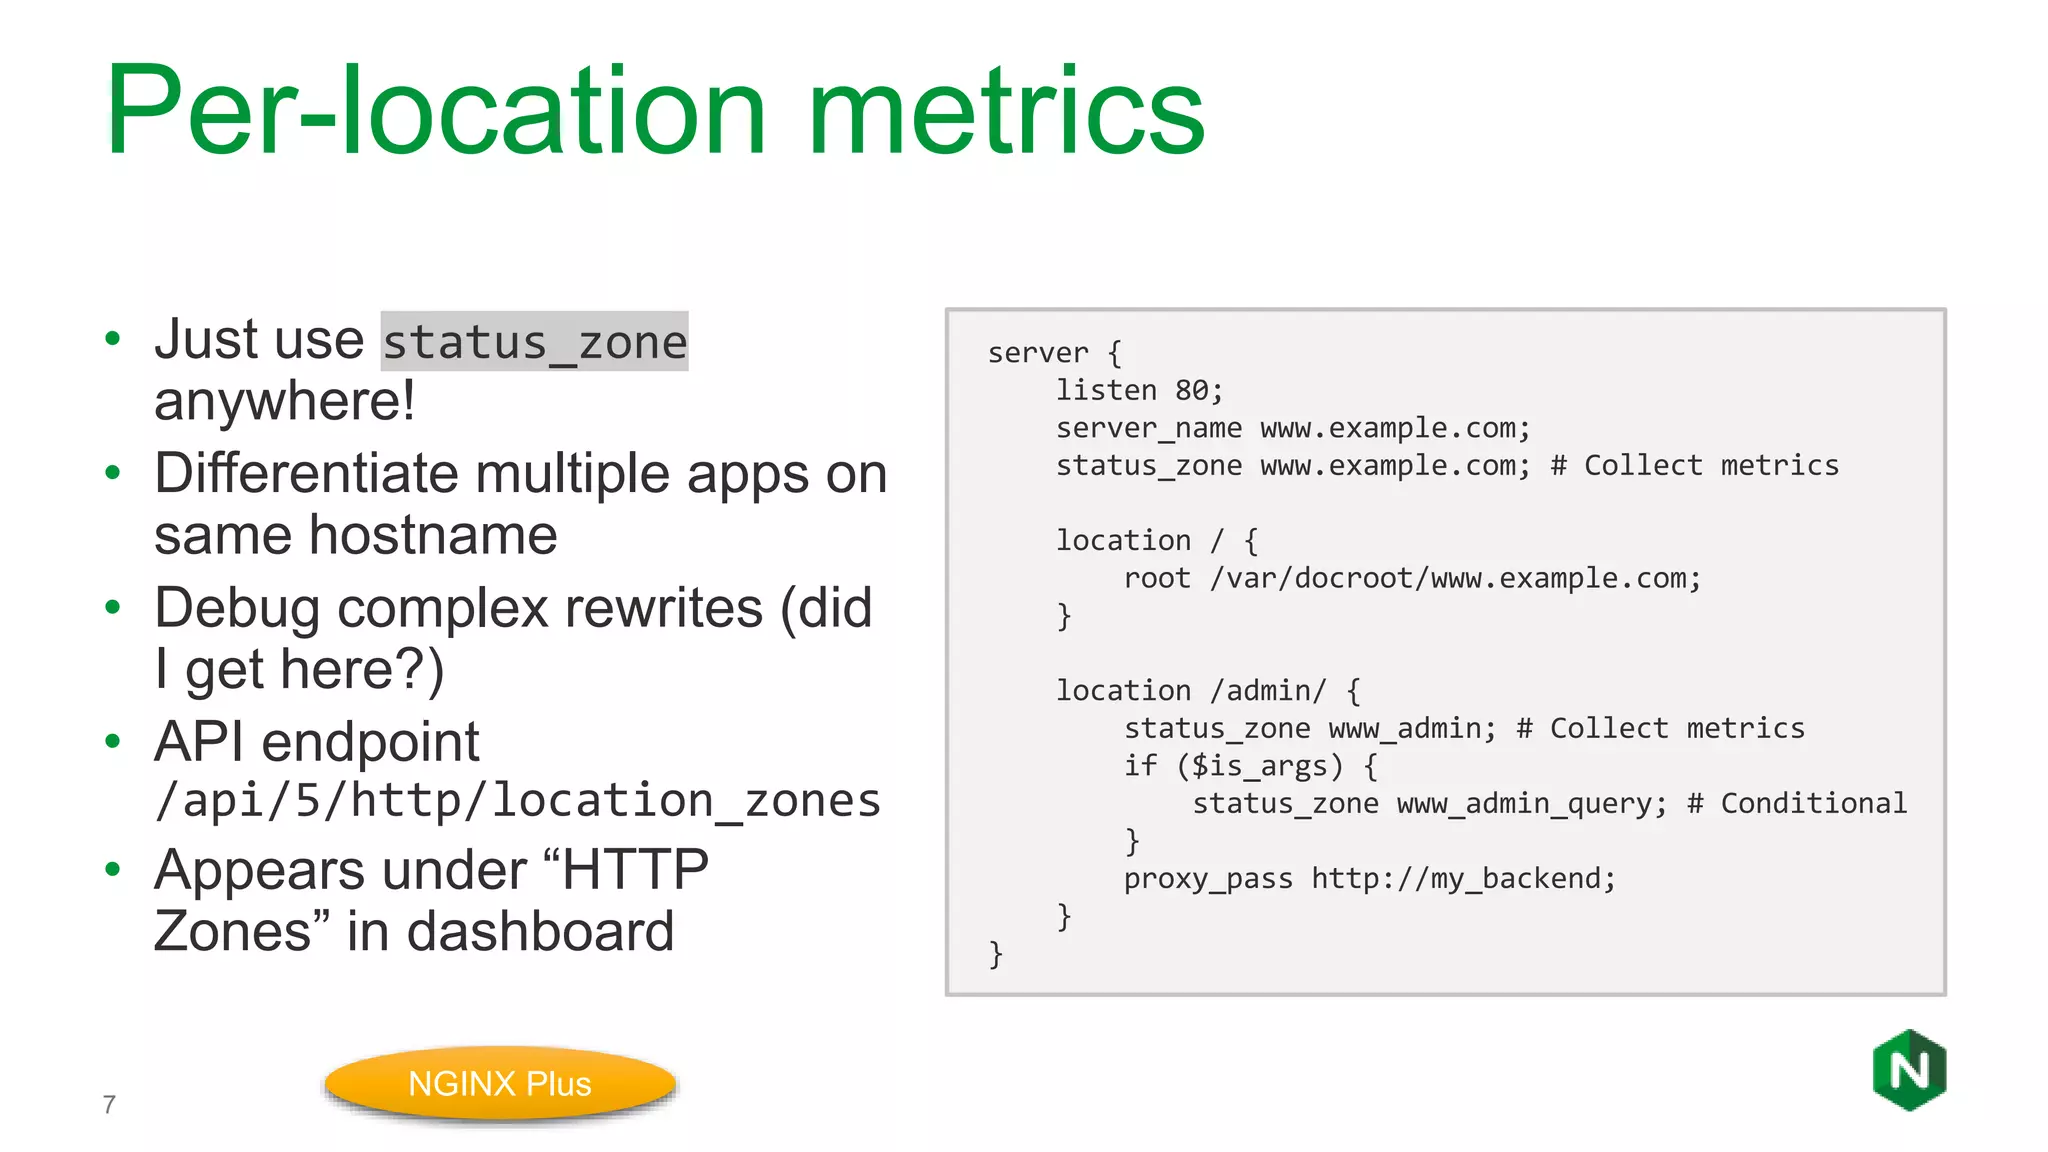
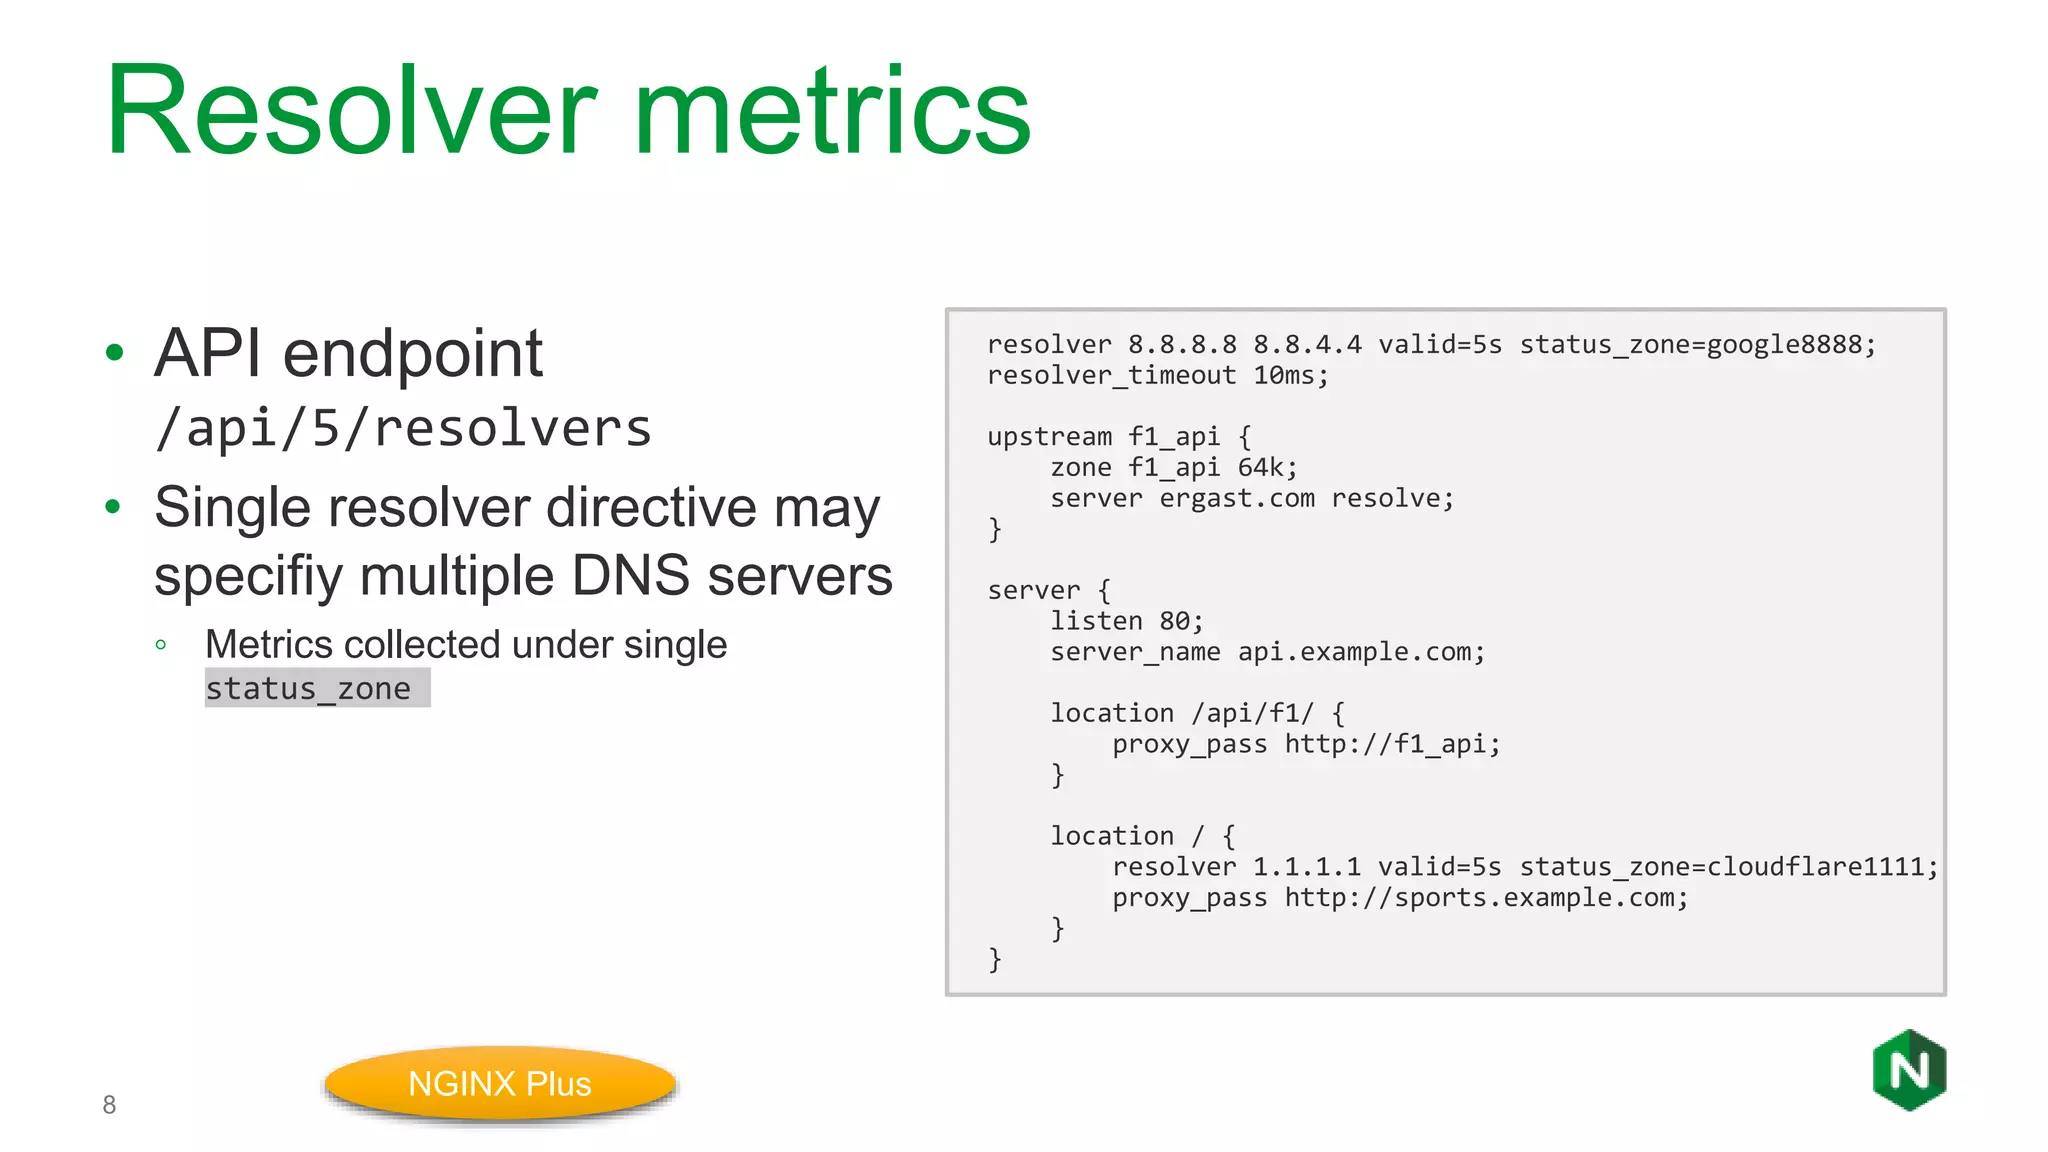
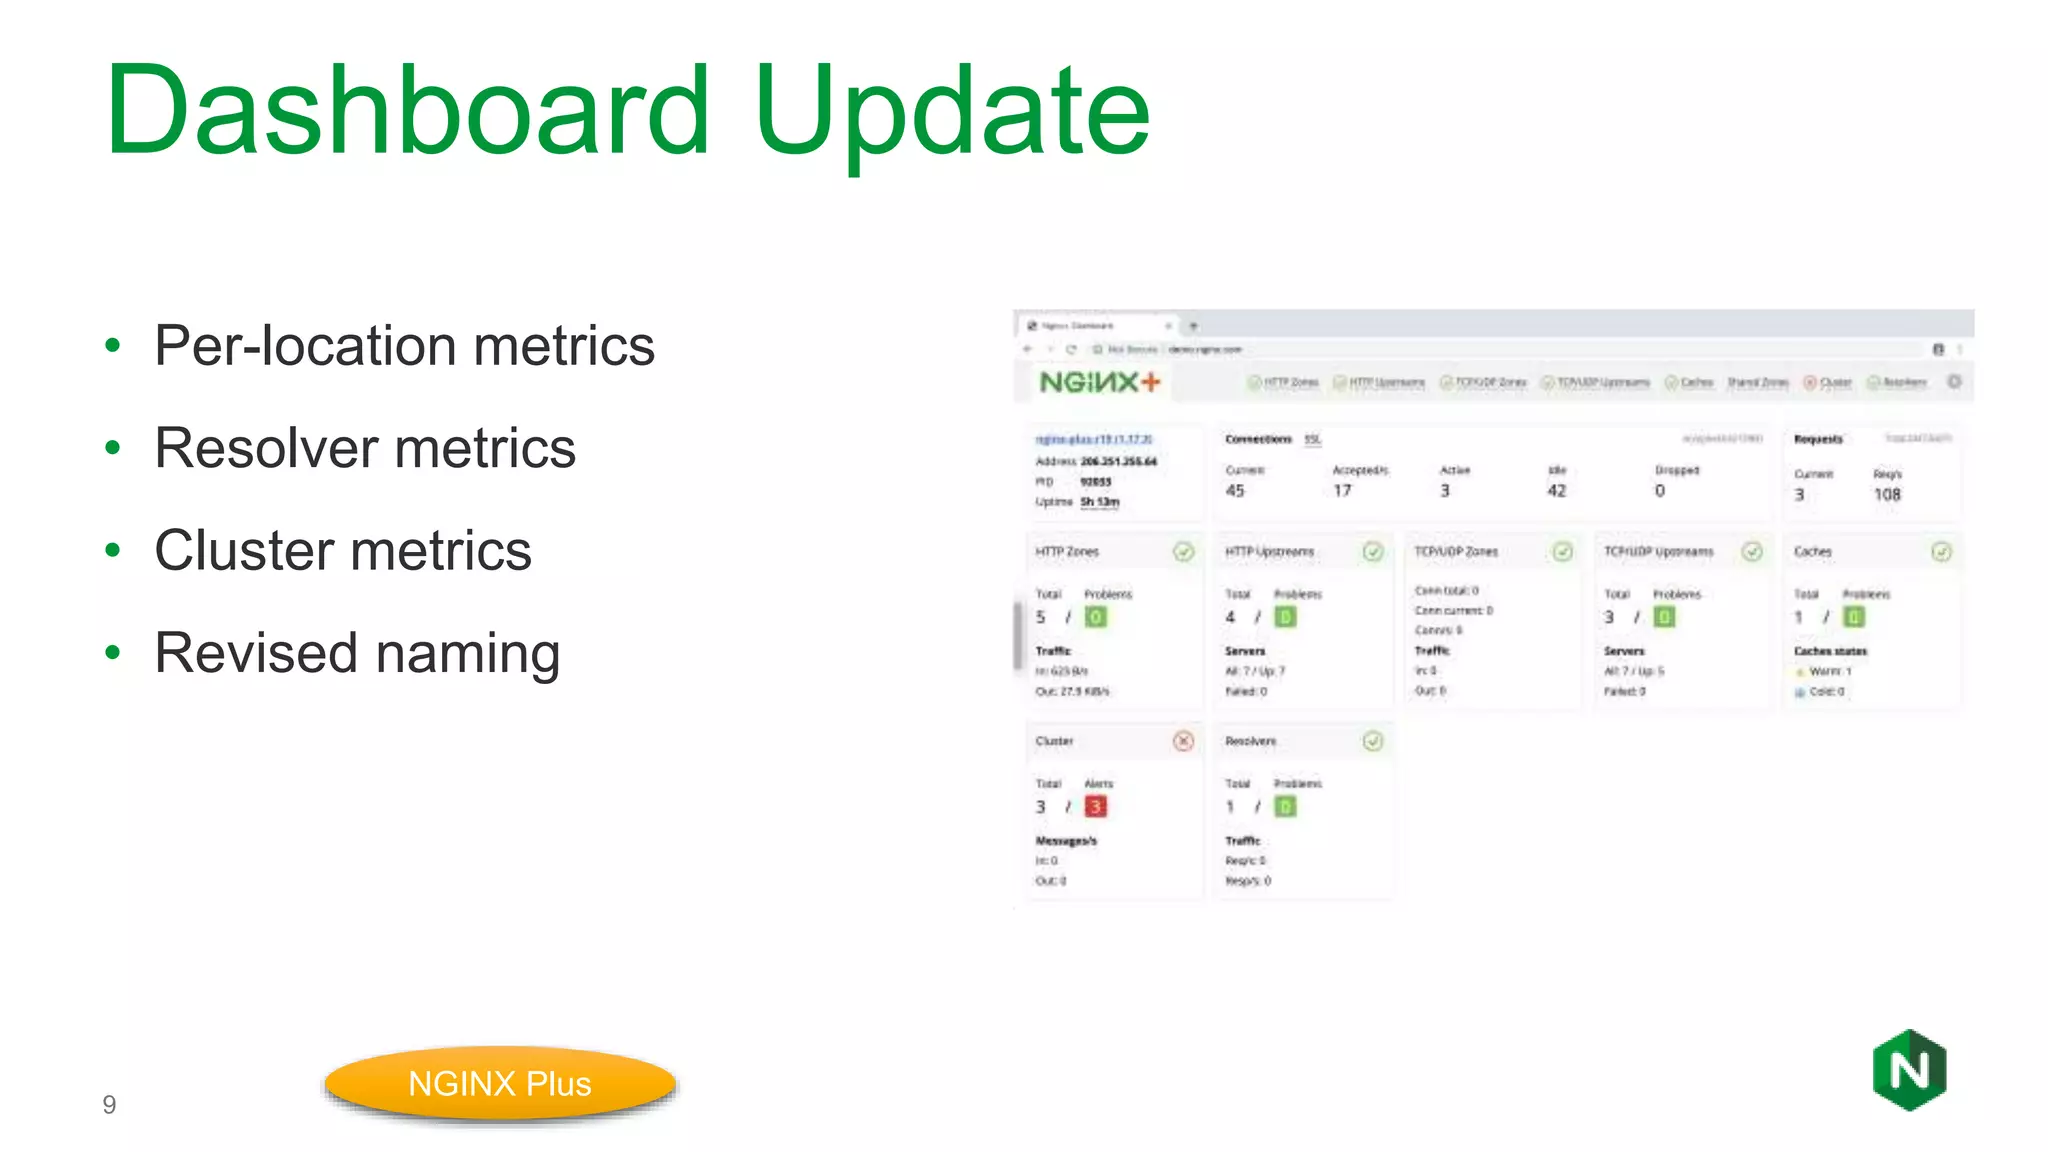
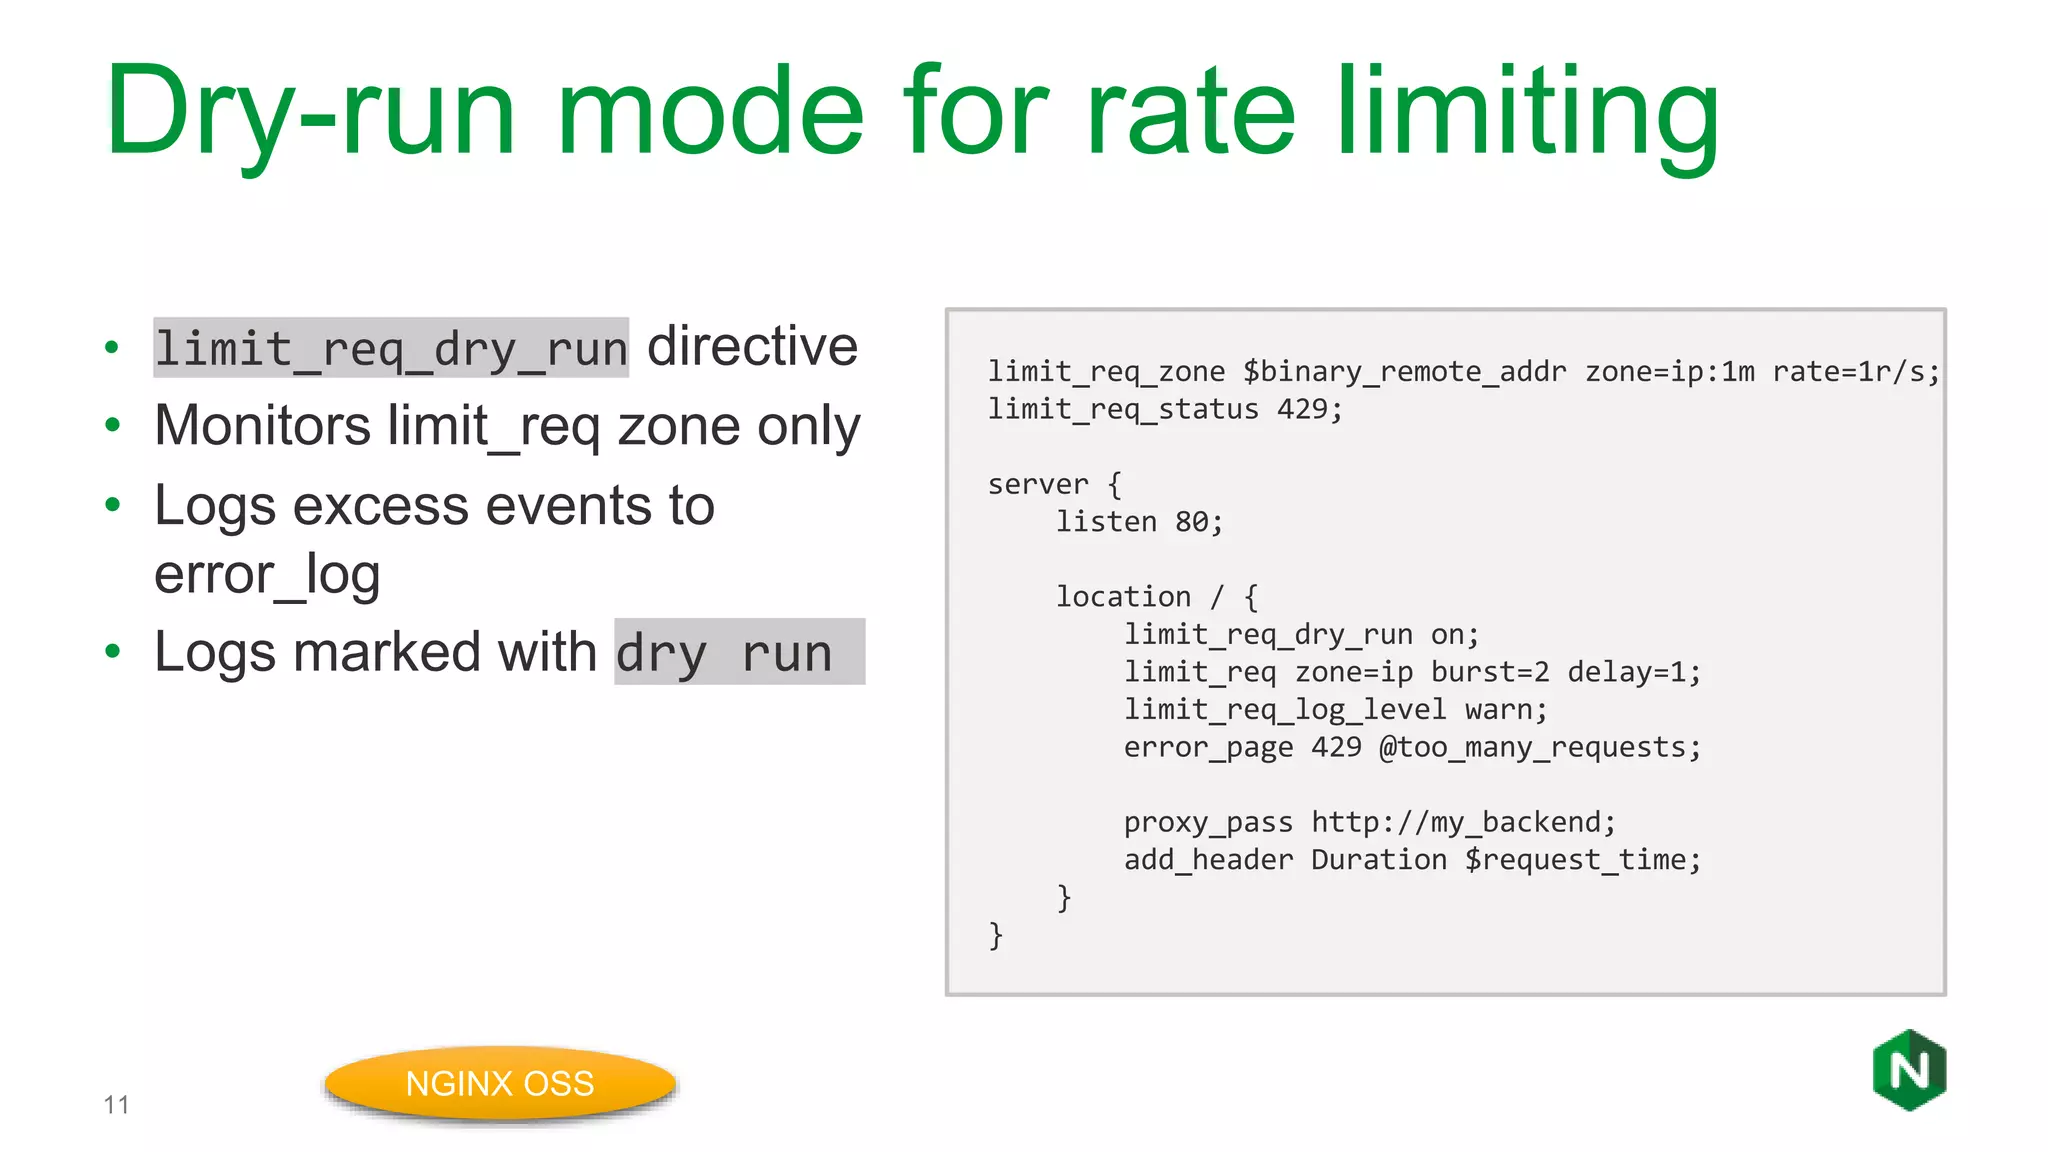
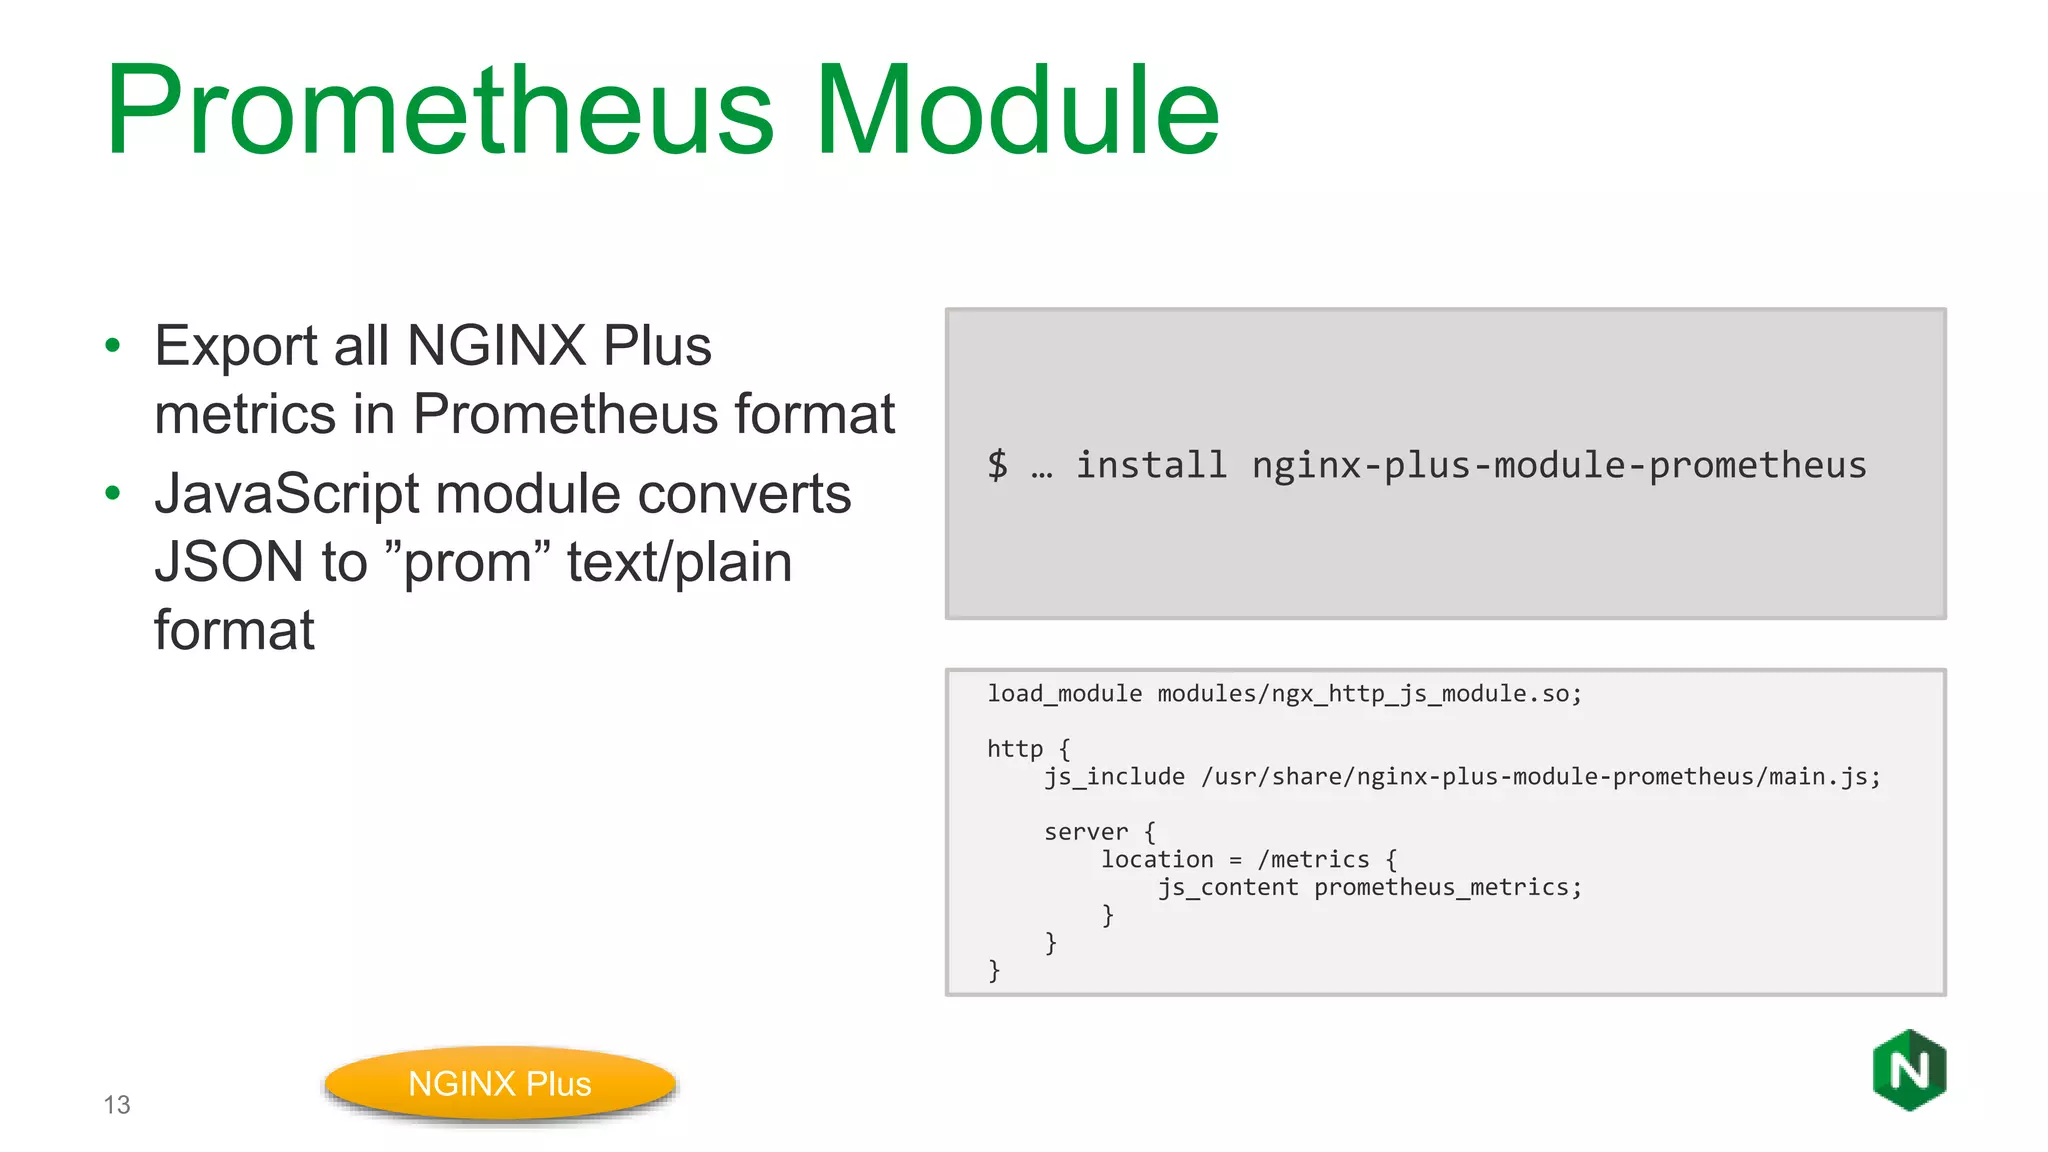
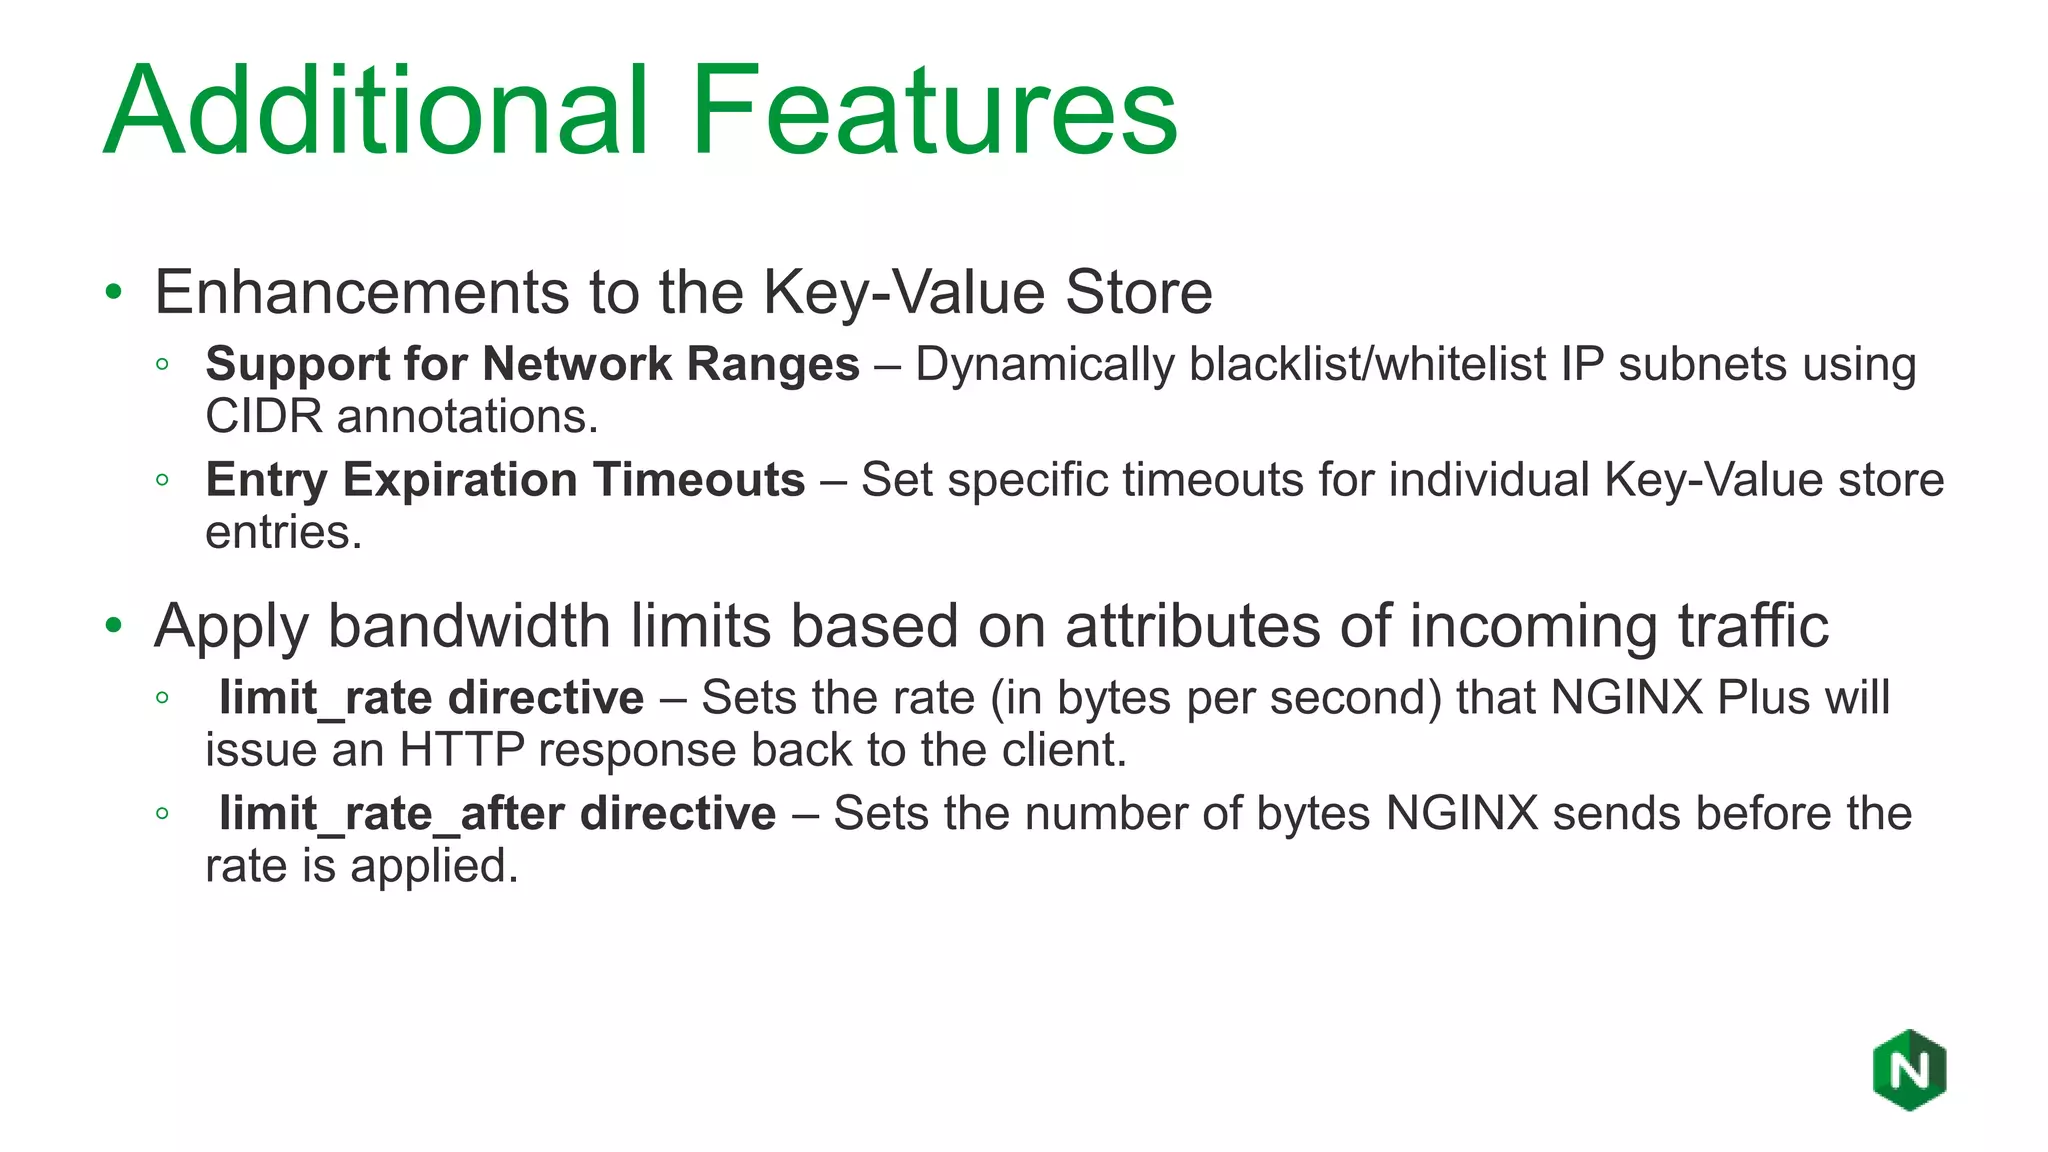
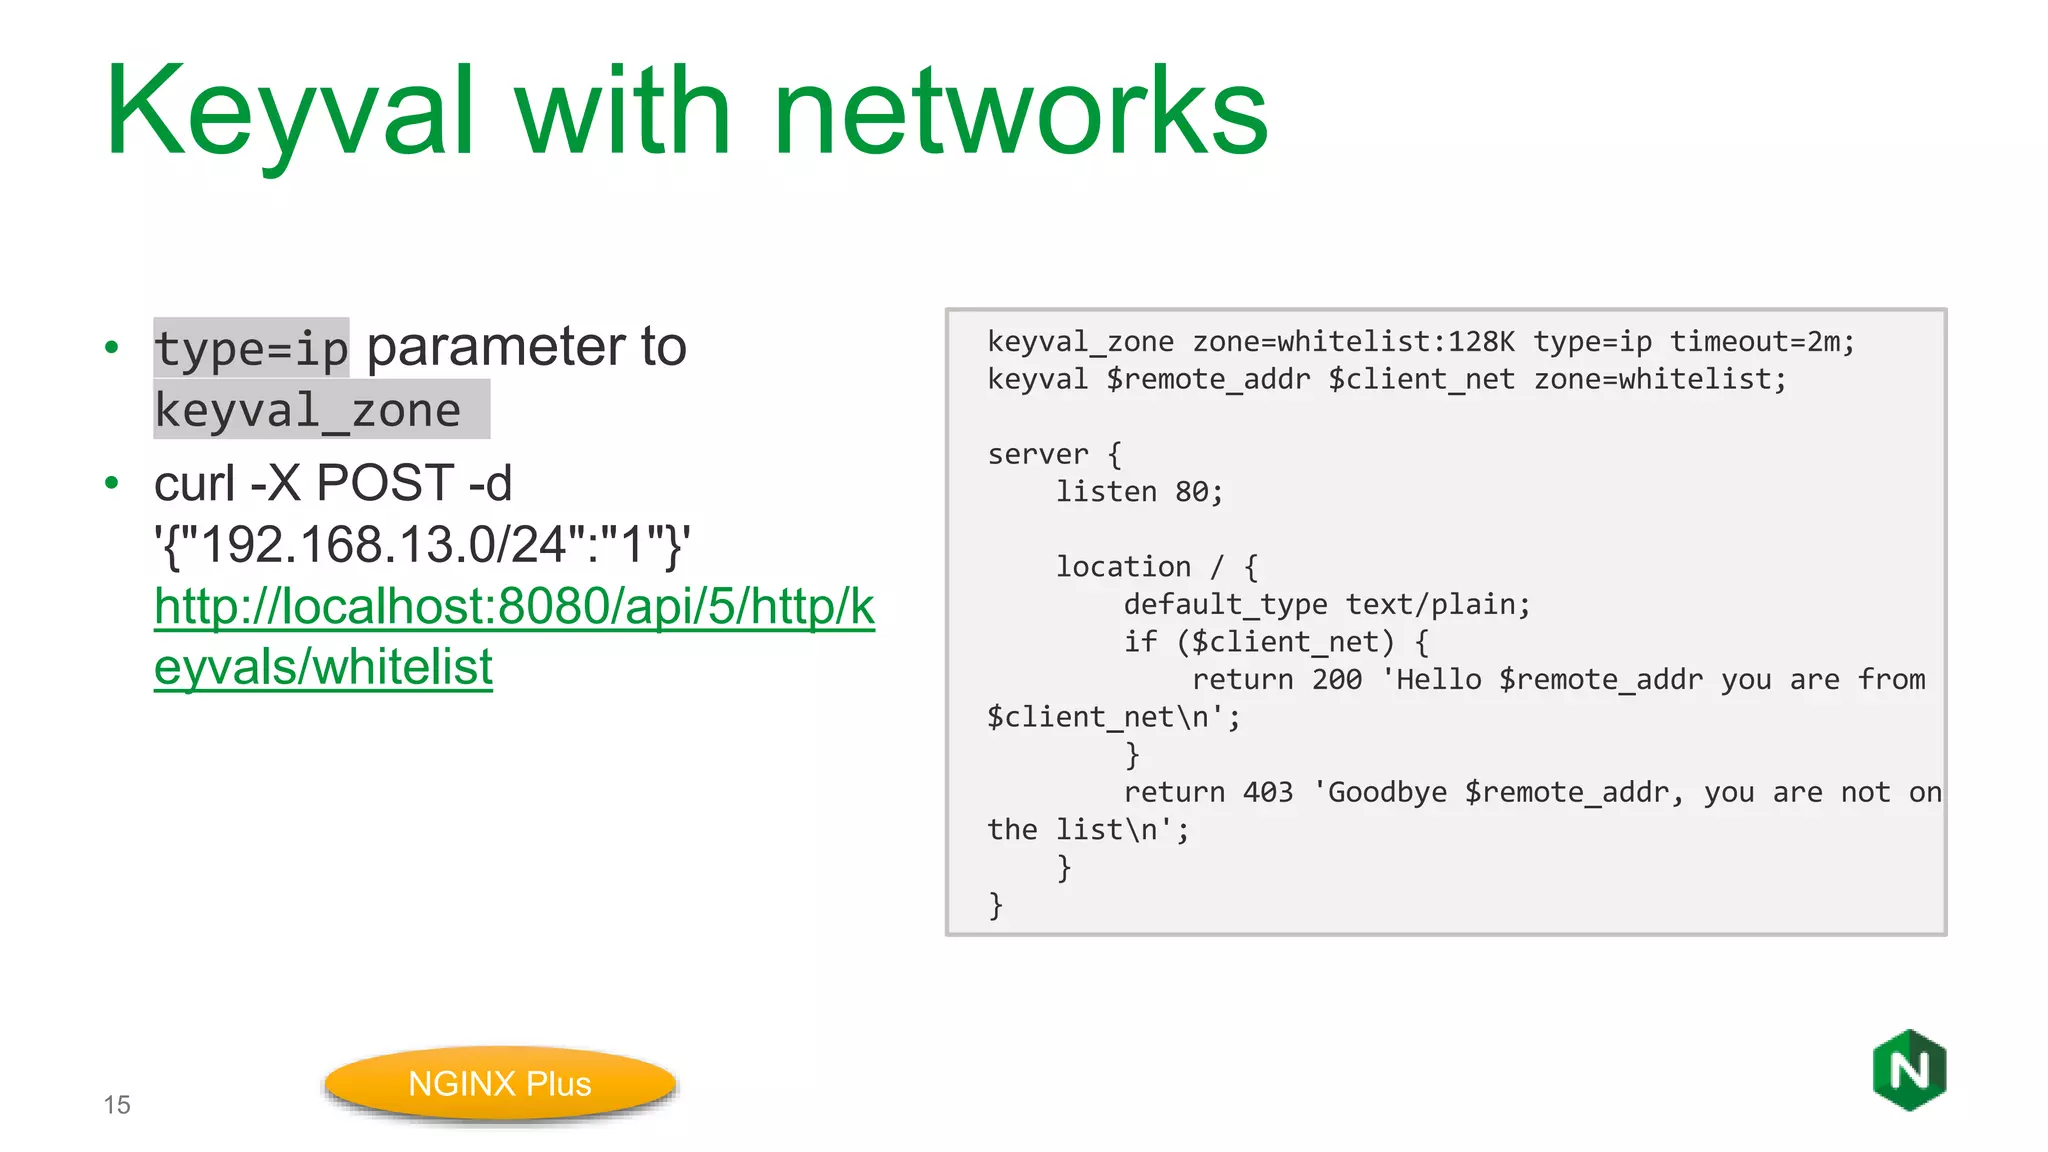
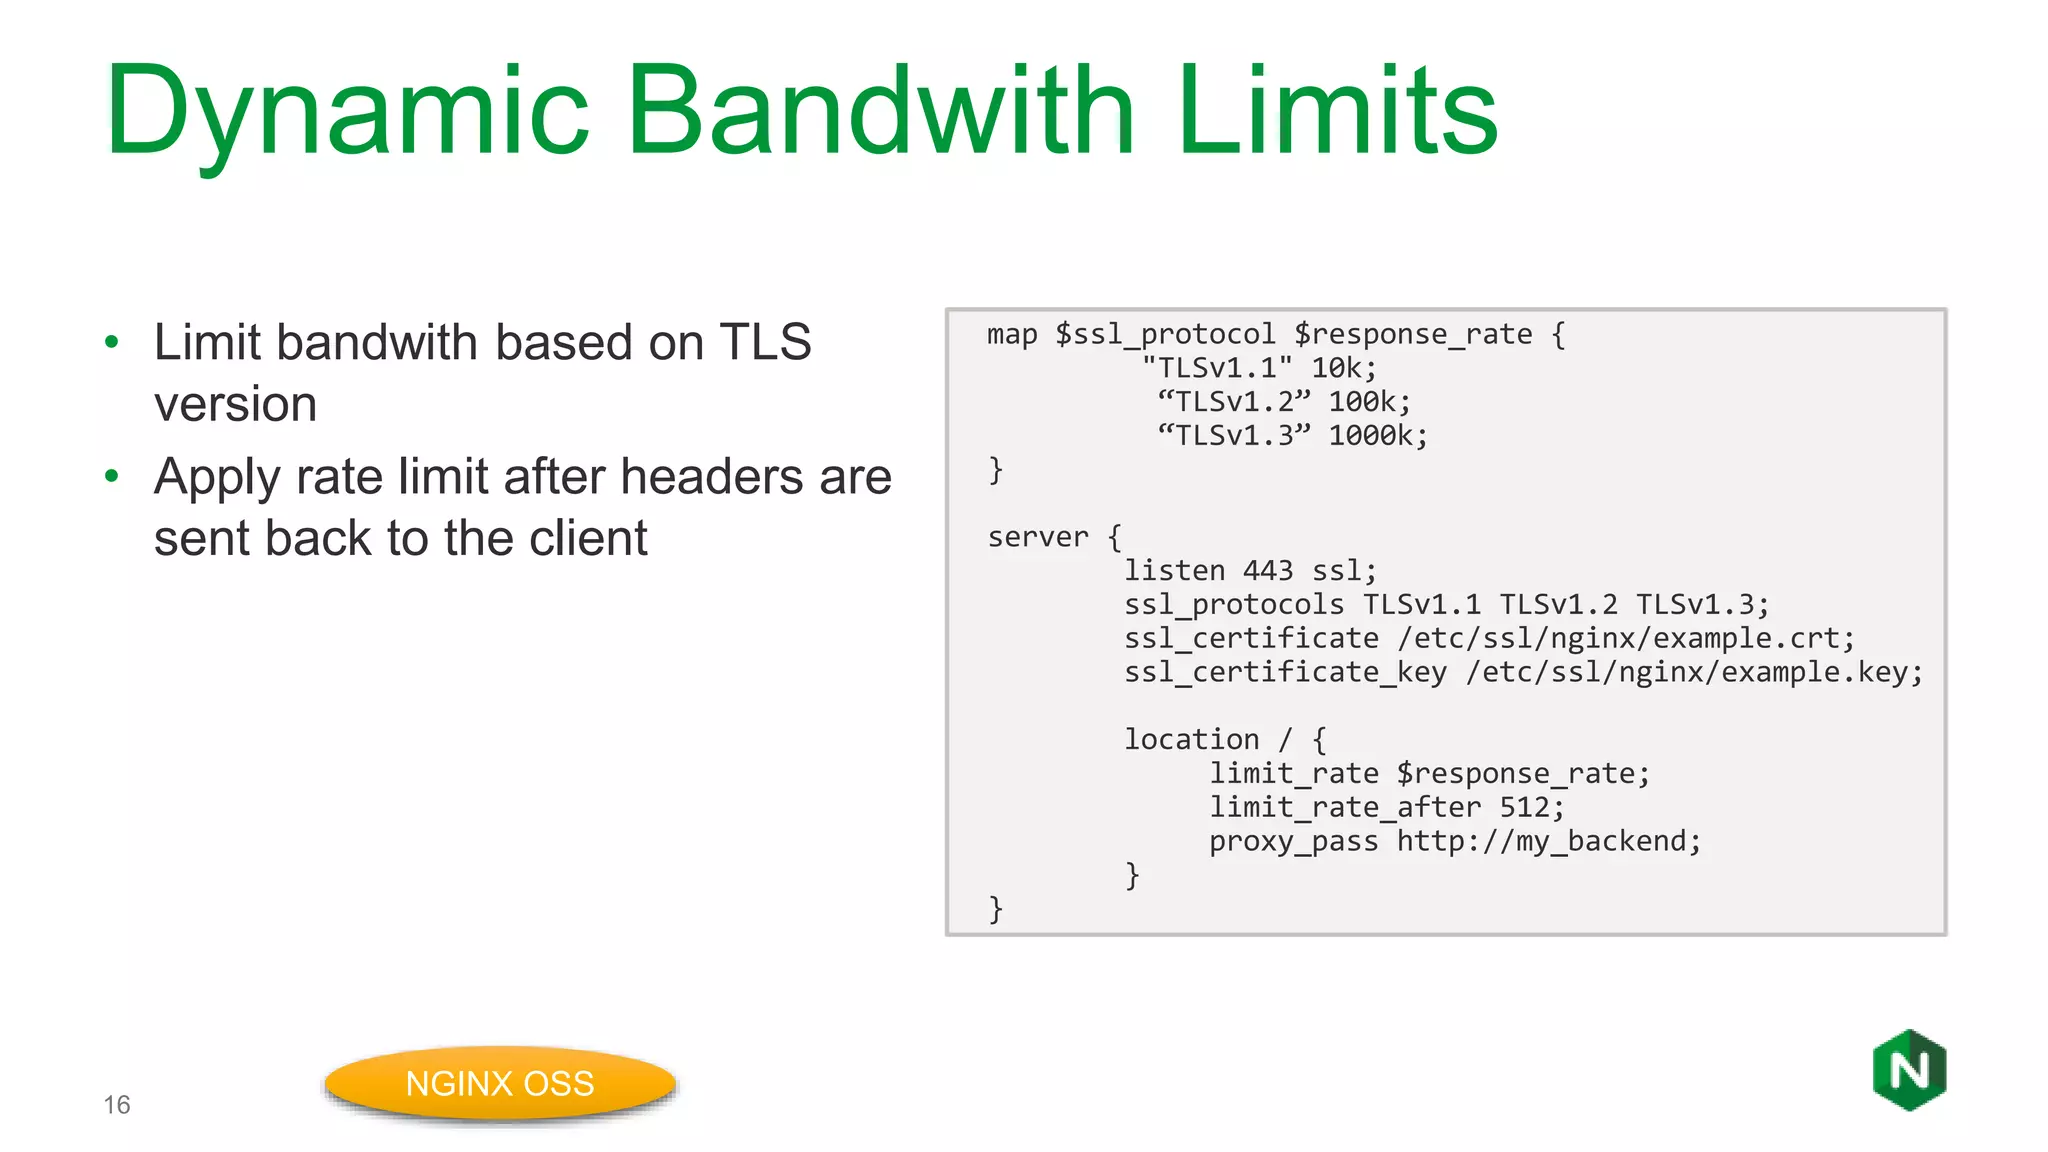
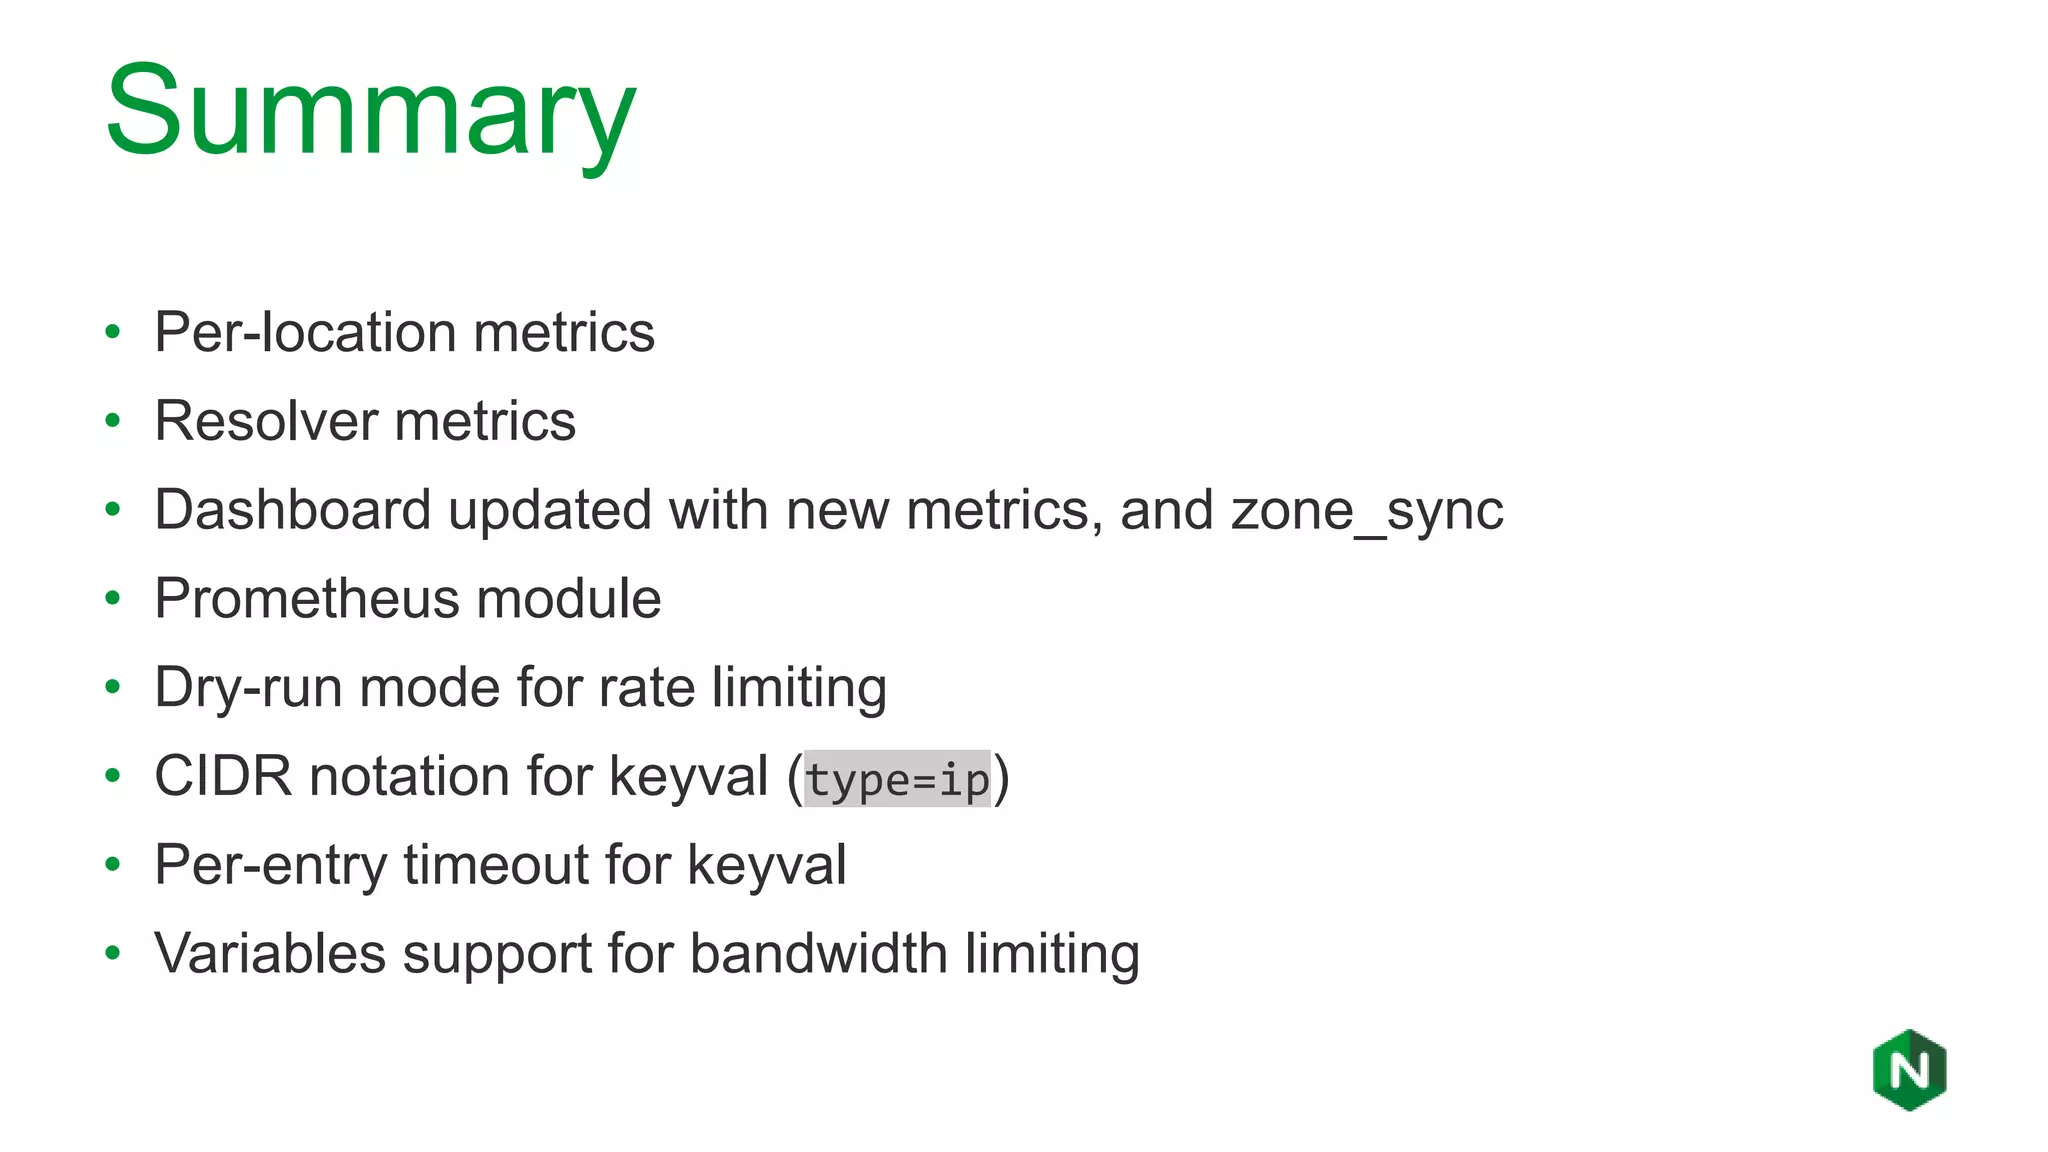
NGINX Plus R19
New Features & Highlights
1
Amir Rawdat
Technical Marketing Manager at NGINX
Formerly:
• Customer Applications Engineer at Alcatel-Lucent
• R&D Java Developer at Mitel Networks
Who am I ?
NGINX Overview
UNIFIED APPLICATION DELIVERY AND API MANAGEMENT SOLUTION
What is NGINX?
Internet
Web Server
Serve content from disk
Reverse Proxy
FastCGI, uWSGI, gRPC…
Load Balancer
Caching, SSL termination…
HTTP traffic
- Basic load balancer
- Content Cache
- Web Server
- Reverse Proxy
- SSL termination
- Rate limiting
- Basic authentication
- 7 metrics
NGINX Open Source NGINX Plus
+ Advanced load balancer
+ Health checks
+ Session persistence
+ Least time alg
+ Cache purging
+ High Availability
+ JWT Authentication
+ OpenID Connect SSO
+ NGINX Plus API
+ Dynamic modules
+ 90+ metrics
Previously on NGINX Plus R18
• Dynamic SSL/TLS certificate loading
◦ Upload SSL certificates and private keys in memory with the NGINX Plus API
• OpenID Connect (oidc) enhancements
◦ Authorization code workflow provides better security without inconveniencing users
◦ https://github.com/nginxinc/nginx-openid-connect for our oidc reference implementation
• Port ranges for virtual servers
◦ Support a broader range of applications
• Define health checks by testing the value of any variables
◦ Increased flexibility in active health checks
Visit https://www.nginx.com/blog/nginx-plus-r18-released/ for all details
NGINX Plus R19 Overview
• Provides finer grained monitoring and observability:
◦ Per location metrics – Collect metrics for individual location blocks for more
effective troubleshooting.
◦ DNS resolver metrics -- Track DNS request types and error responses.
◦ Extended Activity Dashboard – Live dashboard extended to include per-
location and resolver metrics. Additionally, the dashboard reports metrics
relating to runtime state sharing in a cluster.
◦ Module for Prometheus Monitoring – Export NGINX Plus metrics to
Prometheus
◦ Rate limiting in dry-run mode – Enhanced flexibility with rate limiting traffic
by logging excessive requests without enforcing the rate limit.
Per-location metrics
7
• Just use status_zone
anywhere!
• Differentiate multiple apps on
same hostname
• Debug complex rewrites (did
I get here?)
• API endpoint
/api/5/http/location_zones
• Appears under “HTTP
Zones” in dashboard
server {
listen 80;
server_name www.example.com;
status_zone www.example.com; # Collect metrics
location / {
root /var/docroot/www.example.com;
}
location /admin/ {
status_zone www_admin; # Collect metrics
if ($is_args) {
status_zone www_admin_query; # Conditional
}
proxy_pass http://my_backend;
}
}
NGINX Plus
Resolver metrics
8
• API endpoint
/api/5/resolvers
• Single resolver directive may
specifiy multiple DNS servers
◦ Metrics collected under single
status_zone
resolver 8.8.8.8 8.8.4.4 valid=5s status_zone=google8888;
resolver_timeout 10ms;
upstream f1_api {
zone f1_api 64k;
server ergast.com resolve;
}
server {
listen 80;
server_name api.example.com;
location /api/f1/ {
proxy_pass http://f1_api;
}
location / {
resolver 1.1.1.1 valid=5s status_zone=cloudflare1111;
proxy_pass http://sports.example.com;
}
}
NGINX Plus
Dashboard Update
9
• Per-location metrics
• Resolver metrics
• Cluster metrics
• Revised naming
NGINX Plus
DEMO
10
Dry-run mode for rate limiting
11
• limit_req_dry_run directive
• Monitors limit_req zone only
• Logs excess events to
error_log
• Logs marked with dry run
limit_req_zone $binary_remote_addr zone=ip:1m rate=1r/s;
limit_req_status 429;
server {
listen 80;
location / {
limit_req_dry_run on;
limit_req zone=ip burst=2 delay=1;
limit_req_log_level warn;
error_page 429 @too_many_requests;
proxy_pass http://my_backend;
add_header Duration $request_time;
}
}
NGINX OSS
DEMO
12
Prometheus Module
13
• Export all NGINX Plus
metrics in Prometheus format
• JavaScript module converts
JSON to ”prom” text/plain
format
load_module modules/ngx_http_js_module.so;
http {
js_include /usr/share/nginx-plus-module-prometheus/main.js;
server {
location = /metrics {
js_content prometheus_metrics;
}
}
}
NGINX Plus
$ … install nginx-plus-module-prometheus
Additional Features
• Enhancements to the Key-Value Store
◦ Support for Network Ranges – Dynamically blacklist/whitelist IP subnets using
CIDR annotations.
◦ Entry Expiration Timeouts – Set specific timeouts for individual Key-Value store
entries.
• Apply bandwidth limits based on attributes of incoming traffic
◦ limit_rate directive – Sets the rate (in bytes per second) that NGINX Plus will
issue an HTTP response back to the client.
◦ limit_rate_after directive – Sets the number of bytes NGINX sends before the
rate is applied.
Keyval with networks
15
• type=ip parameter to
keyval_zone
• curl -X POST -d
'{"192.168.13.0/24":"1"}'
http://localhost:8080/api/5/http/k
eyvals/whitelist
keyval_zone zone=whitelist:128K type=ip timeout=2m;
keyval $remote_addr $client_net zone=whitelist;
server {
listen 80;
location / {
default_type text/plain;
if ($client_net) {
return 200 'Hello $remote_addr you are from
$client_netn';
}
return 403 'Goodbye $remote_addr, you are not on
the listn';
}
}
NGINX Plus
Dynamic Bandwith Limits
16
• Limit bandwith based on TLS
version
• Apply rate limit after headers are
sent back to the client
map $ssl_protocol $response_rate {
"TLSv1.1" 10k;
“TLSv1.2” 100k;
“TLSv1.3” 1000k;
}
server {
listen 443 ssl;
ssl_protocols TLSv1.1 TLSv1.2 TLSv1.3;
ssl_certificate /etc/ssl/nginx/example.crt;
ssl_certificate_key /etc/ssl/nginx/example.key;
location / {
limit_rate $response_rate;
limit_rate_after 512;
proxy_pass http://my_backend;
}
}
NGINX OSS
Summary
• Per-location metrics
• Resolver metrics
• Dashboard updated with new metrics, and zone_sync
• Prometheus module
• Dry-run mode for rate limiting
• CIDR notation for keyval (type=ip)
• Per-entry timeout for keyval
• Variables support for bandwidth limiting
nginx.com | @nginxnginx.com | @nginx
Q&A

What's new in NGINX Plus R19

  • 1.
    NGINX Plus R19 NewFeatures & Highlights 1
  • 2.
    Amir Rawdat Technical MarketingManager at NGINX Formerly: • Customer Applications Engineer at Alcatel-Lucent • R&D Java Developer at Mitel Networks Who am I ?
  • 3.
    NGINX Overview UNIFIED APPLICATIONDELIVERY AND API MANAGEMENT SOLUTION
  • 4.
    What is NGINX? Internet WebServer Serve content from disk Reverse Proxy FastCGI, uWSGI, gRPC… Load Balancer Caching, SSL termination… HTTP traffic - Basic load balancer - Content Cache - Web Server - Reverse Proxy - SSL termination - Rate limiting - Basic authentication - 7 metrics NGINX Open Source NGINX Plus + Advanced load balancer + Health checks + Session persistence + Least time alg + Cache purging + High Availability + JWT Authentication + OpenID Connect SSO + NGINX Plus API + Dynamic modules + 90+ metrics
  • 5.
    Previously on NGINXPlus R18 • Dynamic SSL/TLS certificate loading ◦ Upload SSL certificates and private keys in memory with the NGINX Plus API • OpenID Connect (oidc) enhancements ◦ Authorization code workflow provides better security without inconveniencing users ◦ https://github.com/nginxinc/nginx-openid-connect for our oidc reference implementation • Port ranges for virtual servers ◦ Support a broader range of applications • Define health checks by testing the value of any variables ◦ Increased flexibility in active health checks Visit https://www.nginx.com/blog/nginx-plus-r18-released/ for all details
  • 6.
    NGINX Plus R19Overview • Provides finer grained monitoring and observability: ◦ Per location metrics – Collect metrics for individual location blocks for more effective troubleshooting. ◦ DNS resolver metrics -- Track DNS request types and error responses. ◦ Extended Activity Dashboard – Live dashboard extended to include per- location and resolver metrics. Additionally, the dashboard reports metrics relating to runtime state sharing in a cluster. ◦ Module for Prometheus Monitoring – Export NGINX Plus metrics to Prometheus ◦ Rate limiting in dry-run mode – Enhanced flexibility with rate limiting traffic by logging excessive requests without enforcing the rate limit.
  • 7.
    Per-location metrics 7 • Justuse status_zone anywhere! • Differentiate multiple apps on same hostname • Debug complex rewrites (did I get here?) • API endpoint /api/5/http/location_zones • Appears under “HTTP Zones” in dashboard server { listen 80; server_name www.example.com; status_zone www.example.com; # Collect metrics location / { root /var/docroot/www.example.com; } location /admin/ { status_zone www_admin; # Collect metrics if ($is_args) { status_zone www_admin_query; # Conditional } proxy_pass http://my_backend; } } NGINX Plus
  • 8.
    Resolver metrics 8 • APIendpoint /api/5/resolvers • Single resolver directive may specifiy multiple DNS servers ◦ Metrics collected under single status_zone resolver 8.8.8.8 8.8.4.4 valid=5s status_zone=google8888; resolver_timeout 10ms; upstream f1_api { zone f1_api 64k; server ergast.com resolve; } server { listen 80; server_name api.example.com; location /api/f1/ { proxy_pass http://f1_api; } location / { resolver 1.1.1.1 valid=5s status_zone=cloudflare1111; proxy_pass http://sports.example.com; } } NGINX Plus
  • 9.
    Dashboard Update 9 • Per-locationmetrics • Resolver metrics • Cluster metrics • Revised naming NGINX Plus
  • 10.
  • 11.
    Dry-run mode forrate limiting 11 • limit_req_dry_run directive • Monitors limit_req zone only • Logs excess events to error_log • Logs marked with dry run limit_req_zone $binary_remote_addr zone=ip:1m rate=1r/s; limit_req_status 429; server { listen 80; location / { limit_req_dry_run on; limit_req zone=ip burst=2 delay=1; limit_req_log_level warn; error_page 429 @too_many_requests; proxy_pass http://my_backend; add_header Duration $request_time; } } NGINX OSS
  • 12.
  • 13.
    Prometheus Module 13 • Exportall NGINX Plus metrics in Prometheus format • JavaScript module converts JSON to ”prom” text/plain format load_module modules/ngx_http_js_module.so; http { js_include /usr/share/nginx-plus-module-prometheus/main.js; server { location = /metrics { js_content prometheus_metrics; } } } NGINX Plus $ … install nginx-plus-module-prometheus
  • 14.
    Additional Features • Enhancementsto the Key-Value Store ◦ Support for Network Ranges – Dynamically blacklist/whitelist IP subnets using CIDR annotations. ◦ Entry Expiration Timeouts – Set specific timeouts for individual Key-Value store entries. • Apply bandwidth limits based on attributes of incoming traffic ◦ limit_rate directive – Sets the rate (in bytes per second) that NGINX Plus will issue an HTTP response back to the client. ◦ limit_rate_after directive – Sets the number of bytes NGINX sends before the rate is applied.
  • 15.
    Keyval with networks 15 •type=ip parameter to keyval_zone • curl -X POST -d '{"192.168.13.0/24":"1"}' http://localhost:8080/api/5/http/k eyvals/whitelist keyval_zone zone=whitelist:128K type=ip timeout=2m; keyval $remote_addr $client_net zone=whitelist; server { listen 80; location / { default_type text/plain; if ($client_net) { return 200 'Hello $remote_addr you are from $client_netn'; } return 403 'Goodbye $remote_addr, you are not on the listn'; } } NGINX Plus
  • 16.
    Dynamic Bandwith Limits 16 •Limit bandwith based on TLS version • Apply rate limit after headers are sent back to the client map $ssl_protocol $response_rate { "TLSv1.1" 10k; “TLSv1.2” 100k; “TLSv1.3” 1000k; } server { listen 443 ssl; ssl_protocols TLSv1.1 TLSv1.2 TLSv1.3; ssl_certificate /etc/ssl/nginx/example.crt; ssl_certificate_key /etc/ssl/nginx/example.key; location / { limit_rate $response_rate; limit_rate_after 512; proxy_pass http://my_backend; } } NGINX OSS
  • 17.
    Summary • Per-location metrics •Resolver metrics • Dashboard updated with new metrics, and zone_sync • Prometheus module • Dry-run mode for rate limiting • CIDR notation for keyval (type=ip) • Per-entry timeout for keyval • Variables support for bandwidth limiting
  • 18.

Editor's Notes

  • #5 NGINX Plus gives you all the tools you need to deliver your application reliably. Web Server NGINX is a fully featured web server that can directly serve static content. NGINX Plus can scale to handle hundreds of thousands of clients simultaneously, and serve hundreds of thousands of content resources per second. Application Gateway NGINX handles all HTTP traffic, and forwards requests in a smooth, controlled manner to PHP, Ruby, Java, and other application types, using FastCGI, uWSGI, and Linux sockets. Reverse Proxy NGINX is a reverse proxy that you can put in front of your applications. NGINX can cache both static and dynamic content to improve overall performance, as well as load balance traffic enabling you to scale-out.
  • #6 Dynamic SSL/TLS certificate loading – Ideal for clustered deployments. Uploading a certificate to one node in the cluster will automatically propagate the changes across the cluster. Authorization code work flow for SSO – Stores Access ID token and Refresh token in the Key-Value store. Establishes a session cookie with the user once authenticated. Reference implementation also includes a logout URI which will delete the ID tokens associated with the user session in the key-value store. Support broader range of applications such as passive FTP, where you specify a max and min port to allocate for passive style data connection. With this capability, NGINX can now easily be used as a server with passive FTP connection.
  • #7 A lot of times, it’s challenging to find the optimal rate limit that best suits you’re application. In Dry run mode, NGINX Plus logs the excess number of incoming requests without actually enforcing the rate limit. That way, you can test various different rate limits to determine which one gives the application behavior you desire.
  • #8 Metrics can be collected per location blocks Allows you to debug complex rewrites Three HTTP zones defined in this configuration Metrics can be viewed from using the NGINX plus API or or in the dashboard.
  • #9 Track DNS requests made by NGINX Plus. Two HTTP zones defined. View DNS metrics in two ways: - NGINX Plus API endpoint – Status Dashboard
  • #12 A lot of times, it’s challenging to find the optimal rate limit that best suits you’re application. In Dry run mode, NGINX Plus logs the excess number of incoming requests without actually enforcing the rate limit. That way, you can test various different rate limits to determine which one gives the application behavior you desire.
  • #15 There are many reasons why you may want to throttle bandwidth. You may have an ecommerce site where you want to enhance user experience to users who are on track of making of purchase. You may set a high limit to malicious users that are not logged in to your site and looking to hurt the performance of your application. In this example, we specify a rate limit (in bytes per second) back to the client based on attribute request (e.g. which SSL protocol browser is using).
  • #17 There are many reasons why you may want to throttle bandwidth. You may have an ecommerce site where you want to enhance user experience to users who are on track of making of purchase. You may set a high limit to malicious users that are not logged in to your site and looking to hurt the performance of your application. In this example, we specify a rate limit (in bytes per second) back to the client based on attribute request (e.g. which SSL protocol browser is using).
  • #18 Target release mid-December