Downloaded 10 times
![1
Utility Scale Energy Storage and the Need for
Flexible Capacity Metrics
Ben Haley, Eric Cutter, Jeremy Hargreaves, Jim Williams
Abstract— Traditionally, capacity has been procured to meet system peak load with no formal regard for flexibility
characteristics. However this planning paradigm is shifting, with increasing intermittent resource penetration, to consider
system flexibility requirements in addition to capacity. Flexibility is broadly defined as the capability of system operators
to respond to changing loadsnet of intermittent renewable generation. It can be provided by energy storage, but also by
gas-fired generation, enhancement of existing resources, responsive loads, new or redefined ancillary services and
operational rule changes. We argue that this new reality challenges the efficacy of traditional cost of new entry (CONE)
capacity planning metrics and requires a more careful analysis of the role of flexible resources like energy storage. Least-
cost procurement of flexible capacity resources from a portfolio of options requires (a) a more precise definition of system
need, (b) rigorous characterization of operating characteristics for each resource, and (c) cost metrics for direct CONE
comparisons across flexible resources. We demonstrate that even without premium payments for flexibility in energy and
ancillary services markets, these measures significantly improve energy storage cost-effectiveness compared to traditional
planning metrics. Specifically, by using a mixed integer linear program to optimize dispatch of CTs and storage
technologies against historic prices in both day-ahead and real time markets in California, we show that bulk energy
storage could already be cost competitive with CTs using a flexible capacity cost metric.
1. INTRODUCTION
Traditionally, capacity resources have been procured to meet system peak load plus reserve requirements. There
is a significant amount of literature on the contribution of renewables towards meeting these traditional system
capacity needs [1–3].
Increasing penetrations of renewable energy on the power grid, however, are changing the planning paradigm for
capacity resources. Now, in addition to meeting system peak loads, new capacity is also needed to provide flexible
generation for integrating variable renewable resources [4]. This new reality challenges the efficacy of traditional
cost of new entry (CONE) capacity planning metrics, as well as the presumption that a combustion turbine (CT) is
the lowest-cost capacity resource.
The CT serves as the proxy or benchmark of choice for capacity resources in the US. As compared to a combined
cycle gas turbine (CCGT), CTs, in general, have a higher heat rate, but shorter start up time and faster ramp rate.
Both PJM and the New York Independent System Operator (NYISO) use the CONE for a new CT in developing
demand curves and price caps for their respective capacity procurement mechanisms [5,6]. California generation
capacity is procured through bilateral contract negotiations, but the California Public Utilities Commission (CPUC),
which is responsible for resource adequacy in the state, uses a proxy CT to determine the capacity value of
distributed energy resources.
Wholesale energy and ancillary services markets do not provide sufficient revenue to encourage investment in
new capacity resources. This lack of incentive for new capital investments has been referred to as the “missing
money” problem and this potential revenue shortfall has been extensively discussed in the literature [7–9]. Load-
serving entities are therefore required to supplement market revenues either through forward capacity markets or
bilateral contract negotiations in order to maintain adequate generation capacity reserve margins. Capacity payments
or other non-market incentives are similarly needed for storage. Such incentives may be particularly important for
energy storage, which may rely to a greater extent than traditional resources on payments for societal benefits such
as reduced production costs, reduced GHG emissions and grid stabilization. These benefits, though tangible, do not
necessarily translate into market revenues for the asset owner [10–12].
The capacity payment (in $/kW-yr.) required to provide the missing money and attract new investment is
alternately referred to as the residual capacity value or the cost of new entry (CONE). The CONE is the all-in
annualized fixed costs of a new capacity resource (including return on investment) minus the net revenues the
resource earns in energy and ancillary services markets. We use the CONE as one metric to compare the cost of
using CTs or energy storage as a capacity resource.
In California, however, renewable generation is expected to change the planning context for capacity need.
Investment in new capacity will likely be driven not by load growth but by this increased renewable generation](https://image.slidesharecdn.com/utilityscaleenergystorageandtheneedforflexiblecapacitymetrics-150112110036-conversion-gate02/75/Utility-Scale-Energy-Storage-and-the-Need-for-Flexible-Capacity-Metrics-1-2048.jpg)
![2
integration need. To meet a legislated 33% Renewable Portfolio Standard (RPS) requirement in 2020, utilities in
California will add between 4,000-5,000 megawatts (MW) of in-state wind and up to 12,500 MW of in-state solar
generation [13]. Studies performed by the CAISO and California Investor Owned Utilities (IOUs) in the 2010 CPUC
Long-term Procurement Planning (LTPP) Proceeding MW found a need for upwardly flexible resources (defined as
generic CTs) as high as 4,600 MW to integrate these variable energy resources (VER’s) [14]. Both the CAISO and
the CPUC have initiated proceedings to develop more robust estimates to guide utility and CAISO procurement of
flexible capacity. Integration studies for California find that key characteristics of firming resources include not only
their total capacity, but response times, ramp rates and flexible operating range [15]. With aggressive RPS goals
driving increased penetration of intermittent renewable generation, planned retirements of fossil generation with
once-through cooling (OTC) and the permanent closure of the 2,200 MW San Onofre Nuclear Generating Station
(SONGS), California is a leading case study on the need for new methods to evaluate and procure flexible capacity.
1.1. Procuring Flexible Resources
The identified need for flexible resources to manage intermittent renewable generation (or more broadly, variable
net loads) has also resulted in several Federal Energy Regulatory Commission (FERC) led initiatives. To date these
initiatives have focused on allowing and fully compensating non-generator and limited energy resources for
participation in energy and ancillary services markets (FERC Orders 719, 745, 755 and 764). ISO Tariff and market
rule changes to implement pay for performance and accuracy in the provision of frequency regulation are in various
stages of approval. In California, a pay for performance regulation market design underwent market simulation in
February and March of 2013. The CAISO is also currently developing a flexi-ramp product that will be utilized in
the 15 and 5-minute real-time dispatch processes in the energy market to ensure sufficient ramping capability is
available to manage variability and forecast error [13].
Procuring flexible resources in a capacity planning context, has, however, received far less attention in the US. To
our knowledge, the Flexible Capacity Procurement Mechanism currently being developed with the oversight of the
CPUC and CAISO in California is the first initiative to do so. Just as capacity payments are required to fill the
“missing money” in energy and ancillary services markets for peak generating capacity, payments to capacity
resources for flexibility (i.e. ramp rate, start-up time) may be required to fully compensate those resources for their
value to the grid.
Many storage technologies offer proportionally larger flexible operating ranges, faster response times, and faster
ramp rates than a CT. However, the value of storage as a flexible resource is not well represented in existing markets
or modeling tools [11]. Von Meier [15] states that “in the face of substantial costs, a key implementation challenge
for storage lies in the definition of the value proposition - that is, the valuation of diverse services offered to the grid
by a given storage resource - and the design of appropriate incentive mechanisms that account for risk and reward
sharing among utilities, consumers, and third parties." Prior studies have found that bulk energy storage can provide
system benefits that are not captured in energy markets alone [16] and that market structure and ownership can have
significant impacts on break-even costs [17]. Some studies find CAES potentially economic when providing both
energy and reserves [18] while others have highlighted cost and siting challenges [19]. More recent studies have
found that bulk energy storage technologies can be cost-competitive with CTs in providing grid balancing and
arbitrage in Western US under 2020 renewable penetration scenarios [20] and that revenue from frequency
regulation would be four times that of energy arbitrage for the Tehachapi Wind Energy Storage Project in California
[21].
A number of studies have evaluated the value of energy storage participating in wholesale energy and AS markets
[12,16,18,20–22] and combined with renewable generation [10,11,23]. Here we describe a generalized framework to
optimize the net revenue maximizing dispatch of an individual resource in competitive wholesale energy and
ancillary service markets. We then present the results of a case study applying this approach to the CAISO. Our
work contributes to the body of research on energy storage in four ways. First, unlike most analyses of energy
storage, we optimize the dispatch for three bulk energy storage technologies and a CT in the same model. Second,
within the optimization, each resource bids first into the day-ahead markets and then offers any remaining
uncommitted capacity into the real-time markets to maximize net revenues. We find that the performance
characteristics of the storage technologies lead to higher net market revenues even without premium payments for
performance. Third, unlike prior studies that focus on the value of energy storage, we also estimate the capacity
payment necessary to encourage new investment based on the CONE for each technology. Finally, we show how a
capacity payment that is based on flexibility rather than nameplate generating capacity would dramatically alter how
energy storage is evaluated against a CT as a least-cost resource.](https://image.slidesharecdn.com/utilityscaleenergystorageandtheneedforflexiblecapacitymetrics-150112110036-conversion-gate02/75/Utility-Scale-Energy-Storage-and-the-Need-for-Flexible-Capacity-Metrics-2-2048.jpg)
![3
2. Material and Methods
We use a mixed-integer linear program to dispatch a single resource against historical energy and ancillary
service prices. We have applied this generalized framework to several regions and storage technologies in the US
and present a case study for bulk storage technologies using CAISO energy and ancillary services prices from 2011.
We model a single 50 – 100 MW plant as a price-taker in the CAISO market and assume that the market clearing
prices and quantities are not affected. The resource is first optimized on a daily basis for the energy and ancillary
services products in the CAISO day-ahead market. Dispatch is co-optimized across energy, regulation up, regulation
down and spinning reserves1
. We do not include non-spinning reserves, which is of limited value and can be readily
provided by less flexible resources. Instead, after being committed in the day ahead markets, the remaining capacity
is bid into (or have their day-ahead energy awards adjusted) in the real-time energy market, providing a subsequent
opportunity to increase revenue. Bids in the real-time market are for incremental or decremental energy to
respectively increase or decrease generation (or charging). The optimization is performed with perfect knowledge
within the day-ahead and real-time markets, but not between the two. A full description of the optimization utilized
is found in Appendix A.
2.1. Technology Assumptions
We model technology performance characteristics for CTs from [5], and for energy storage from [24], [25]; [26],
(Table 2). The most impactful resource technical characteristics include roundtrip efficiency losses, operating range,
start-up costs, and minimum operating levels. Piecewise linear efficiency curves are used to represent the discharge
operating efficiency at varying operating levels for the pumped storage, CAES and CT technologies. The same
approach is also used to represent the charging efficiency curve for pumped storage. Financing assumptions and
capital cost estimates are taken from [24] and [27], (Tables 3 and 4). To calculate the CONE, we annualize the fixed
costs of each technology in a pro forma financial model. The primary differences for technology fixed costs are
useful life, capital costs, and fixed operations and maintenance (O&M) costs. Capital cost ranges are higher for
storage technologies than for CTs due to the greater variety in technology and far less experience in commercial
operation [24].
TABLE 1. Technology Assumptions
Technology Roundtrip
Efficiency
Discharge
Duration
(Hours)
Minimum
Charging
Level (% of
capacity)
Minimum
Discharging
Level (% of
capacity)
Variable
O&M
($/MWh)
Full Load
Heat Rate
(BTU/kWh)
Startup
Fuel
(MMBTU/
MW)
Non-Fuel
Startup
Costs
($/MW)
Battery 75% 4 0% 0% $5.00 - - -
Pumped Storage 80% 10 33% 33% $5.00 - - $10
CAES 125% 15 0% 50% $5.00 4,910 2.2 -
CT - - - 50% $5.00 10,390 2.2 -
TABLE 2. Technology Assumptions
CT Battery Pumped Storage CAES
Book Life 20 15 30 20
Installed Capital Cost ($/kW) $488-814 $2400-$4200 $1,115-$3,345 $630-$1,575
Regional Capital Cost Multiplier 1.18 1.18 1.18 1.18
CA Installed Capital Cost ($/kW) $576-$961 $2,832-$4,956 $1,316-$3,947 $743-$1859
Fixed O&M ($/kW-year) $5.26 $25.20 $30.80 $11.66
Fixed O&M Escalator (%/year) 2.0% 2.0% 2.0% 2.0%
WACC (%) 8.25% 8.25% 8.25% 8.25%
Federal Income Tax Rate (%) 35.0% 35.0% 35.0% 35.0%
State Income Tax Rate (%) 7.0% 7.0% 7.0% 7.0%
Property Tax Rate (%) 1.0% 1.0% 1.0% 1.0%
Insurance Cost (% of Installed Cost) .5% .5% .5% .5%
1
CAISO, like ERCOT, has separate markets for regulation up (increase generation/decrease load) and regulation down (decrease
generation/increase load).](https://image.slidesharecdn.com/utilityscaleenergystorageandtheneedforflexiblecapacitymetrics-150112110036-conversion-gate02/75/Utility-Scale-Energy-Storage-and-the-Need-for-Flexible-Capacity-Metrics-3-2048.jpg)
![4
TABLE 3. Common Financial Assumptions
Item Input
Regional Capital Cost Multiplier 1.18
Fixed O&M Escalator (%/year) 2.0%
WACC (%) 8.25%
Federal Income Tax Rate (%) 35.0%
State Income Tax Rate (%) 7.0%
Property Tax Rate (%) 1.0%
Insurance Cost (% of Installed Cost) .5%
3. Calculation
To evaluate the cost and performance of energy storage and CTs, we compare the participation of each
technology in the day-ahead and real-time markets. We then employ three metrics: net market revenues, CONE, and
Flexible CONE.
3.1. Net Market Revenues
The participation of each technology in the day-ahead and real-time markets differs significantly due to their
respective operating characteristics. This results in different estimates of net market revenues ($/kW-yr) by
technology, which is a measure of their competitiveness in terms of provision of energy and ancillary services. Net
market revenue includes all energy and ancillary services revenues minus the variable operating costs including fuel,
startup costs, and variable O&M. It is defined as:
Energy Market Revenue + Regulation Revenue + Spinning Reserves Revenue - Fuel Costs - Variable
O&M Costs - Startup Costs
This metric is used to assess the competitive advantages of each technology in providing energy and ancillary
services products and is an input into the calculation of CONE and Flexible CONE.
3.2. Cost of New Entry
We next calculate the CONE for each technology in the CAISO based on estimated ranges of installed capital
costs for each technology and the net market revenues calculate. We use two CONE metrics: CONE and Flexible
CONE. CONE is a traditional capacity cost metric, which is defined as:
Generator Fixed Costs ($/kW-yr) - Net Market Revenues ($/kW-yr)
3.3. Flexible Cost of New Entry
CONE is a cost metric for installed capacity without consideration of its operating flexibility. There are many
types of and potential definitions for flexibility which are beyond the scope of this paper. We chose one of several
possible metrics simply to illustrate how considering flexibility can change cost-effectiveness evaluation for energy
storage. For purposes of this comparison we define a Flexible CONE metric based on the one-minute spinning ramp
rate of each resource. The one-minute spinning ramp rate is a measure of each resource’s ability to rapidly alter
power output within its operating range. Flexible CONE is defined as:
[Generator Fixed Costs ($/kW-yr) - Net Market Revenues ($/kW-yr)] / Spinning Ramp Rate (% of
Discharge Capacity/Minute)
These metrics assess the degree to which the characteristics for each of the technologies influence potential
market revenues, competitiveness in terms of capacity procurement (CONE), and market participation.
4. Results
We run each technology though the optimization model for one year (using 2011 CAISO prices). In this section
we present the results for the net market revenues and the resulting CONE values for each technology.
4.1. Net Market Revenues
The CT’s participation in wholesale energy and AS markets is limited. The CT modeled here has a relatively high
heat rate of 10,390 btu/kWh, which is much higher than the combined cycle gas turbines which set the market price](https://image.slidesharecdn.com/utilityscaleenergystorageandtheneedforflexiblecapacitymetrics-150112110036-conversion-gate02/75/Utility-Scale-Energy-Storage-and-the-Need-for-Flexible-Capacity-Metrics-4-2048.jpg)
![5
in most hours in California. CT’s also incur start up and minimum operating costs which must be factored into their
decision to bid into the markets. As a result, the capacity factor of the CT in the optimization model is just 5%,
which is consistent with other studies for California [28,29]. The annual average participation of CTs by market
across the 24 hours of the day is shown in Fig. 1. CT market participation is concentrated in the peak afternoon
hours and the more volatile real-time market rather than the day-ahead market where most energy and AS
procurement occurs. When CTs do provide energy, they prefer to operate near their maximum efficiency point,
which is close to their nameplate capacity. Therefore they will tend to offer more regulation down than regulation
up, and provide only a limited amount of spinning and non-spinning reserves. The negative bars show when the CT
is offering a decremental bid in the real-time market to reduce energy output.
Fig. 1. Average Annual CT Dispatch by Market and Hour. CT provision of energy and ancillary services is limited by low efficiency/high heat-
rate, minimum operating loads and start-up cost
Batteries have a much higher level of market participation than CTs. The average annual market participation for
batteries discharging capacity and charging capacity is shown in Fig. 2 and 3 respectively. A primary difference
between energy storage and CTs is that storage can both charge and discharge energy.
Fig. 2. Average Annual Battery Discharge Dispatch by Market and Hour. Without start-up costs or a minimum operating load, Battery market
participation is much higher that CT. Most of the discharge capacity is dedicated to regulation up and spinning reserves, with only limited energy
arbitrage. Negative bars are regulation down and decremental energy bids in the real-time market.](https://image.slidesharecdn.com/utilityscaleenergystorageandtheneedforflexiblecapacitymetrics-150112110036-conversion-gate02/75/Utility-Scale-Energy-Storage-and-the-Need-for-Flexible-Capacity-Metrics-5-2048.jpg)
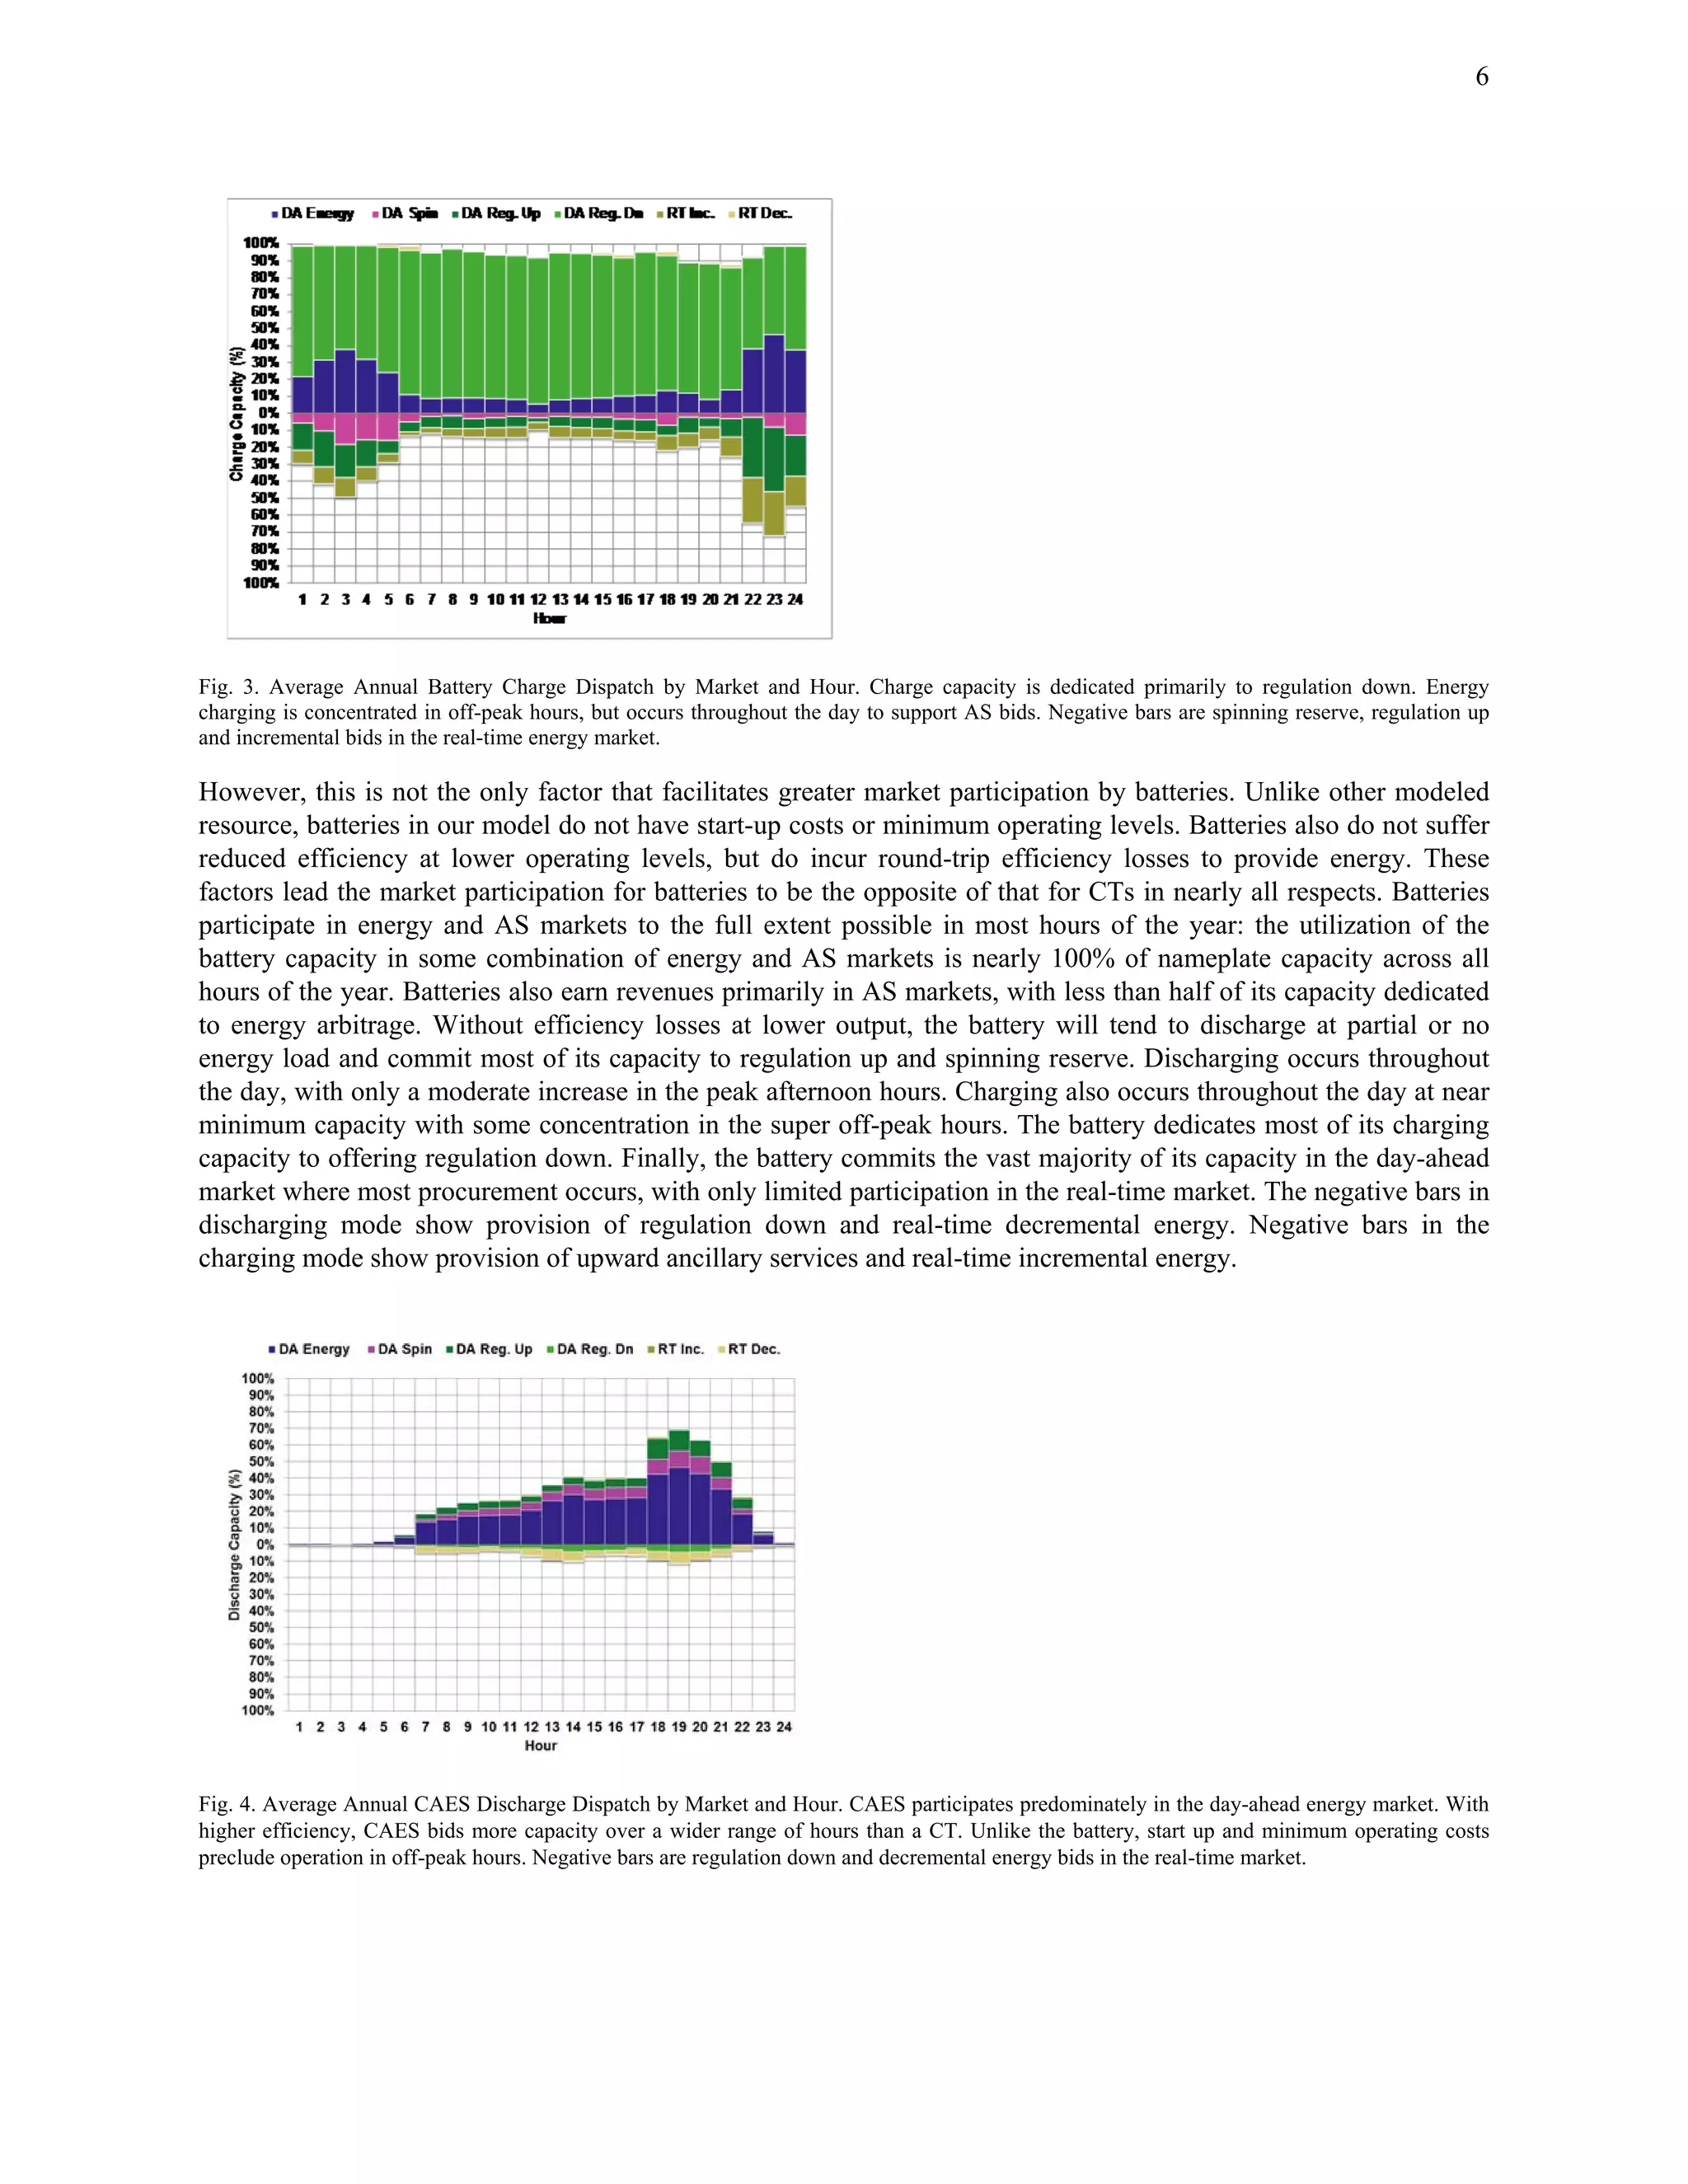
![7
Fig. 5. Average Annual CAES Charge Dispatch by Market and Hour. Like the battery, CAES charge capacity is dedicated primarily to regulation
down across all hours. Unlike the battery, CAES energy charging is limited to off-peak hours. Negative bars are spinning reserve, regulation up
and incremental bids in the real-time energy market.
Energy arbitrage plays a more important role for pumped storage (Fig. 4 and 5) and CAES than it does for
batteries. Unlike the battery, when pumped storage and CAES are discharging, most of the capacity is dedicated to
the energy market. These technologies are also different from batteries in that discharging is much more
concentrated in on-peak hours, and charging is likewise more concentrated in off-peak hours. Finally, the average
utilization of pumped storage and CAES is less than 100% in most hours and the use of discharging capacity in off-
peak hours is virtually non-existent.
There are several reasons for these differences from the dispatch of the battery. One is that we assume that neither
technology can switch from generator to pump/compression mode within an hour in the provision of frequency
regulation. Unlike the battery, this limits their hourly ancillary services provision to either their charge or discharge
capacity, but not both. Furthermore, except for CAES charging, both pumped storage and CAES must operate above
a minimum output level, which presents an additional cost hurdle to the provision of AS.
4.2. Net Market Revenues
The differences in net market revenues for each technology (Table 4) follow directly from the different levels of
market participation described above. The net revenues for CAES are roughly 50% higher than those of the CT.
Unlike a CT, CAES can earn revenue with its charging capacity and, with a lower effective heat rate, finds it
economic to bid discharge capacity into a higher percentage of hours. Without fuel costs and a lower minimum
operating level, pumped storage earns more net revenues that CAES. The greater operating flexibility of the battery
allows it to earn more than twice the net revenues of both pumped storage and CAES.
TABLE 4 Net Market Revenues ($/kw-Yr.)
CT Battery
Pumped
Storage CAES
$37 $143 $73 $56
Recall that these net market revenues are calculated assuming that each resource is a price taker that does not
affect market prices. However, the 2011 CAISO average hourly real-time operating reserve and frequency
regulation requirement in 2011 was 1,712 MW and 680 MW respectively[30]. It is possible, therefore, that a modest
amount of additional energy storage or other new resources could in fact reduce market clearing prices in ancillary
service markets. Because energy storage relies on ancillary services for a greater proportion of its revenues than the
CT, the impact of lower ancillary service prices net revenues would be proportionally greater for energy storage.
Lower ancillary service prices could reduce the advantage in net market revenues for energy storage shown here.
4.3. Cost of New Entry
CT CONEs range from $60-$124/kW-year and represent the lowest traditional capacity option (Fig. 6). This
result is due to the low installed capital costs of the CT modeled here and in spite of its limited market participation](https://image.slidesharecdn.com/utilityscaleenergystorageandtheneedforflexiblecapacitymetrics-150112110036-conversion-gate02/75/Utility-Scale-Energy-Storage-and-the-Need-for-Flexible-Capacity-Metrics-7-2048.jpg)
![8
and the infrequency with which it provides ancillary services.
Of the storage technologies modeled here, CAES has the lowest CONE at the lower range of its installed cost
estimates ($76/kW-year) and is potentially competitive with the cost range of CTs modeled here. It offsets its higher
fixed capital costs with higher net market revenues. Pumped storage plants ($155-$494/kW-year) and batteries
($407-$799/kW-year) have higher CONES than do CTs under all capital costs modeled. The higher net market
revenues relative to a CT are not sufficient to offset still higher capital costs.
We did not model temperature effects for CTs and CAES, which would increase the CONE values for those
technologies. High temperatures during peak periods reduce the operating efficiency and maximum output for CTs
and CAES, increasing costs on a per kW basis. In other studies performed by the authors, including temperature
effects increases the CONE for a CT in California by ~10% [29].
A. Flexible Cost of New Entry
Flexible CONE results differ substantially from our CONE results (Fig. 7). Batteries and pumped storage have
much higher ramp rates than the CTs or CAES plants modeled here. Whereas batteries provide the same on-peak
capacity, their ability to deliver flexible capacity is much greater. This reduces their needed residual compensation
on a $/kW-min basis, lowering their relative cost in terms of ramp capacity procurement. Evaluating CONE based
on ramp rate (kW-min) rather than generation capacity (kW) essentially reverses the results from the previous
section. Pumped storage has the lowest Flexible CONE at the lower end of its installed cost range ($310/kW-
min/year) and batteries are also lower cost options than the CT ($407-799/kW-min/year). CAES has a slightly
higher ramp rate than a CT, which results in being a slightly more competitive resource than a CT with this metric as
well, though its Flexible CONE is higher across the modeled installed cost range.
Note that these results may still underestimate the competitiveness of storage resources as the Flexible CONE is
calculated based only on the discharge capacity (for consistency with a CT). Dividing the costs for energy storage by
the full range of both their discharge and charge capacity would reduce their Flexible Capacity CONE by half.
Fig. 6. Cost of New Entry (CONE). Total costs minus net market revenues
Fig. 7. Flexible Capacity Cost of New Entry (CONE). Total costs minus net market revenues](https://image.slidesharecdn.com/utilityscaleenergystorageandtheneedforflexiblecapacitymetrics-150112110036-conversion-gate02/75/Utility-Scale-Energy-Storage-and-the-Need-for-Flexible-Capacity-Metrics-8-2048.jpg)
![13
(50)
(51)
) (52)
Pumped Storage
/ 0,1
(53)
CAES/Pumped Storage/Combustion Turbine
0 1
(54)
/ 0,1
(54)
Battery: 0 2
(55)
References
[1] Soder L, Amelin M. A review of different methodologies used for calculation of wind power capacity credit. IEEE; 2008.
[2] Billinton R, Karki R, Gao Y, Huang D, Hu P, Wangdee W. Adequacy Assessment Considerations in Wind Integrated Power Systems. IEEE
Transactions on Power Systems 2012;PP:1–1.
[3] Dent CJ, Keane A, Bialek JW, Janusz W, Member S. Simplified Methods for Renewable Generation Capacity Credit Calculation : A Critical Review.
Power and Energy Society General Meeting 2010 IEEE 2010:1–8.
[4] Lannoye E, Flynn D, O’Malley M. Evaluation of Power System Flexibility. Power Systems, IEEE Transactions On 2012;27:922–31.
[5] NERA Economic Consulting. Independent Study to Establish Parameters of the ICAP Demand for the New York Independent System Operator.
Washington DC: NERA Economic Consulting; 2010.
[6] The Brattle Group. Cost of New Entry Estimates for Combustion Turbine and Combined-Cycle Plants in PJM. 2011.
[7] Joskow PL. Lessons Learned from Electric Market Liberalization. The Energy Journal 2008;29:9–42.
[8] Joskow PL. Markets for Power in the United States : An Interim Assessment. The Energy Journal 2006;27:1–36.
[9] Cramton P, Stoft S. A Capacity Market that Makes Sense. Electricity Journal 2005;18:43–54.
[10] Dicorato M, Forte G, Pisani M, Trovato M. Planning and Operating Combined Wind-Storage System in Electricity Market. Sustainable Energy, IEEE
Transactions On 2012;3:209–17.
[11] Tuohy A, Kamath H, Rogers L. Evaluation of storage for bulk system integration of variable generation. Power and Energy Society General Meeting,
2012 IEEE 2012:1–4.
[12] Denholm P, Jorgenson J, Jenkin T, Palchak D, Kirby B, Malley MO. The Value of Energy Storage for Grid Applications The Value of Energy Storage
for Grid Applications. 2013.
[13] California Independent System Operator. Flexible Ramping Products: Second Revised Draft Final Proposal. Folsom, California: CAISO; 2012.
[14] Casey K. Keith Casey Memorandum to ISO Board of Governors: Briefing on Renewable Integration. 2011.
[15] Von Meier A. Integration of renewable generation in California: Coordination challenges in time and space. 11th International Conference on Electrical
Power Quality and Utilisation, Ieee; 2011, p. 1–6.
[16] Sioshansi R, Denholm P, Jenkin T, Weiss J. Estimating the value of electricity storage in PJM: Arbitrage and some welfare effects. Energy Economics
2009;31:269–77.
[17] Sioshansi R, Denholm P, Jenkin T. A comparative analysis of the value of pure and hybrid electricity storage. Energy Economics 2011;33:56–66.
[18] Drury E, Denholm P, Sioshansi R. The Value of Compressed Air Energy Storage in Energy and Reserve Markets. Energy 2011;36:4959–73.
[19] Schulte RH, Critelli N, Holst K, Huff G, Georgianne H. Lessons from Iowa : Development of a 270 Megawatt Compressed Air Energy Storage Project
in Midwest Independent System Operator A Study for the DOE Energy Storage Systems Program. Albuquerque, NM: Sandia National Laboratories;
2012.
[20] Kintner-Meyer M, Balducci P, Colella W, Elizondo M, Jin C, Nguyen T, et al. National Assessment of Energy Storage for Grid Balancing and
Arbitrage: Phase 1, WECC. Pacific Northwest National Laboratory; 2012.
[21] Byrne RH, Silvia-Monroy SA, Silva-Monroy CA, Report S. Estimating the Maximum Potential Revenue for Grid Connected Electricity Storage :
Arbitrage and Regulation 2012.
[22] Walawalkar R, Apt J, Mancini R. Economics of electric energy storage for energy arbitrage and regulation in New York. Energy Policy 2007;35:2558–
68.
[23] Kiviluoma J, Meibom P, Tuohy A, Troy N, Milligan M, Lange B, et al. Short-Term Energy Balancing With Increasing Levels of Wind Energy.
Sustainable Energy, IEEE Transactions On 2012;3:769–76.
[24] Black & Veatch. Cost and Performance Data for Power Generation Technologies. 2012.
[25] Nakhamkin M, Chiruvolu M, Patel M, Byrd S, Schainker R, Marean J. Second Generation of CAES Technology- Performance, Operations,
Economics, Renewable Load Management, Green Energy, Las Vegas, Nevada: 2009.
[26] Pullinger MG. Evaluating Hydraulic Transient Analysis Techniques in Pumped- Storage Hydropower Systems. 2011.
[27] United States Army Corps of Engineers. Civil Works Construction Cost Index System. 2011.
[28] California Independent System Operator. 2012 Annual Report on Market Issues and Performance. 2013.
[29] Energy and Environmental Economics. California Solar Initiative Cost-Effectiveness Evaluation. 2011.
[30] CAISO. 2011 Annual Report on Market Issues & Performance. 2012.](https://image.slidesharecdn.com/utilityscaleenergystorageandtheneedforflexiblecapacitymetrics-150112110036-conversion-gate02/75/Utility-Scale-Energy-Storage-and-the-Need-for-Flexible-Capacity-Metrics-13-2048.jpg)

1. Traditionally, capacity resources have been procured only to meet peak system loads, but growing renewable energy is increasing the need for flexible resources that can integrate variable supplies. 2. Evaluating flexible capacity requires analyzing characteristics like ramp rates and response times, not just total capacity. Energy storage provides flexibility but its value is not fully captured by current markets. 3. The document proposes a framework to optimize dispatch of storage and combustion turbines against real market prices to determine which resource provides the most cost-effective flexible capacity when compensated appropriately. This could show storage competing with combustion turbines for flexible capacity procurement.


