
More Related Content
What's hot
What's hot (20)
Viewers also liked
Similar to Wells Fargo Report Card 2015
Similar to Wells Fargo Report Card 2015 (20)
Recently uploaded
Recently uploaded (7)
Wells Fargo Report Card 2015
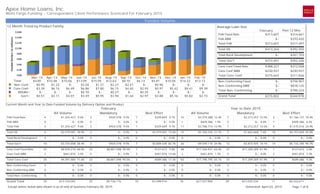
- 1. November 10, 2015 Page 1 of 8 Wells Fargo Funding - Correspondent Client Performance Scorecard For September 2015 Funded Volume Except where noted data shown is as of end of business September 30, 2015. Apex Home Loans, Inc Generated: 12 Month Trend by Product Family Conv Conf- Non-Conf- RDGRH- Gov't- $- $2.93 $0.25 $2.97 $0.96 $0.97 $- $3.88 $- $5.42 $- $5.16 $- $8.41 $- $5.82 $- $9.39 $- $3.73 $- $9.19 $0.58 $6.09 $3.00 $7.95 $- $1.26 $- $3.10 $- $0.81 $1.64 $7.89 $- $3.29 $- $12.14 $- $4.90 $2.26 $7.74 $- $3.47 $0.53 $10.23 $- $3.54 Oct-14 Nov-14 Dec-14 Jan-15 Feb-15 Mar-15 Apr-15 May-15 Jun-15 Jul-15 Aug-15 Sep-15 $6.14 $5.81 $10.58 $14.22 $13.13 $15.86 $12.21 $3.91 $12.83 $17.04 $13.47 $14.31Total $357,717 $364,225 Average Loan Size Grand Total $363,566 $305,399 $345,624 $468,548 $361,003 $324,880 $507,663 $392,311 $- $276,287 $354,590 $346,440 $350,406 $323,458 $305,858 $346,966 $534,000 $1,063,749 $- $956,250 $1,050,312 September Past 12 Mos Total Rural Development FHA Fixed Rate FHA ARM $393,594 Conv Conf Fixed Rate Conv Conf ARM $341,078 Non-Conforming Fixed Non-Conforming ARM $534,000 Total FHA Total VA Total Gov't Total Conv Conf Total Non-Conforming 1228 $3,916,190$10,392,483$14,308,67240 319 $116,973,156 249 $87,562,281 70 $29,410,875 Current Month and Year to Date Funded Volume by Delivery Option and Product All Volume Best Effort $4,052,781 13.8% $3,748,381 12.7% 26.5% 24.6% 2.0% 53.1% $536,375 1.8% $5,811,303 19.8% 21.6% $7,446,244 25.3% $- 0.0% 25.3% Mandatory Grand Total $327,362 12 $345,624 8 $672,986 $7,801,162 $341,000 $7,232,117 $- $583,673 $15,616,952 $104,000 4 $2,264,204 19 $6,347,678 $534,000 7 $- 0 $7,446,244 Mandatory 1 13.5% 1 0.0% 2 20 1 18 0 2 40 1 79.6% 7 0.0% 23 1 0.0% 0 0.0% 7 17.8% $11,802,982 0.0% $- 17.8% 13.5% 6.5% 6.9% 0.0% 0.0% 20.4% 75.7% $69,688,760 0.0% $- 79.6% 0.0% $- 0.0% $- 0.0% $1,854,035 39 $- 0 $1,854,035 $11,802,982 $674,325 $6,070,538 $- $- $17,873,521 $7,864,123 194 $- 0 $69,688,760 $- 0 $- 0 $- 5 13.6% 0 3.2% 5 39 1 16 0 0 55 22 60.0% 0 5.0% 194 0 6.4% 0 0.0% 0 15.2% $15,855,764 2.4% $3,748,381 17.7% 16.8% 7.1% 11.4% 0.0% 0.5% 28.6% 55.7% $70,225,136 15.8% $5,811,303 65.0% 3.7% $7,446,244 0.0% $- 6.4% $2,181,397 $345,624 $2,527,021 $19,604,145 $1,015,325 $13,302,656 $- $583,673 $33,490,473 $7,968,123 $2,264,204 $76,036,439 $534,000 $- $7,446,244 6 1 7 2 0 23 7 1 0 Best Effort All Volume 8.4%FHA Fixed Rate 51 8.8%FHA ARM 8 17.2% 59 8.7% 34 0.0% 2 25.9% 95 2.7%Conv Conf Fixed Rate 198 57.8%Conv Conf ARM 19 60.5% 217 13.6%Non-Conforming Fixed 7 0.0%Non-Conforming ARM 0 13.6% 7 Total FHA Total VA Total Rural Development September Year to Date 2015 $1,013,986 $2,368,204 $534,000 3 8 1 24.3% 75.7% 0.0% $2,528,360 $7,864,123 $- 6 22 0 24.8% 71.5% 3.7% $3,542,346 $10,232,326 $534,000 9 30 1 Total Gov't Total Conv Conf Total Non-Conforming
- 2. November 10, 2015 Page 2 of 8 Wells Fargo Funding - Correspondent Client Performance Scorecard For September 2015 Lock Volume Except where noted data shown is as of end of business September 30, 2015. Apex Home Loans, Inc Lock counts are a combination of Best Effort units and Mandatory commitments. Because Rural Development volume can be co-mingled with non-RD volume within a commitment, RD volume is not broken out as a separate category and appears combined with other government volume. Generated: 12 Month Trend by Product Family Conv Conf- Non-Conf- Gov't- $- $1.83 $6.86 $1.43 $2.91 $4.92 $- $10.37 $5.77 $1.73 $10.48 $5.20 $3.01 $5.66 $1.89 $2.40 $10.53 $6.05 $1.92 $5.38 $3.81 $- $3.07 $1.25 $1.05 $17.09 $3.82 $2.90 $9.85 $2.53 $2.11 $12.80 $3.23 $2.56 $4.00 $4.96 Oct-14 Nov-14 Dec-14 Jan-15 Feb-15 Mar-15 Apr-15 May-15 Jun-15 Jul-15 Aug-15 Sep-15 $8.69 $9.25 $16.14 $17.41 $10.57 $18.98 $11.11 $4.33 $21.96 $15.28 $18.15 $11.52Total 147 $5,863,024$5,658,661$11,521,68521 187 $129,298,607 85 $83,187,908 102 $46,110,699 Current Month and Year to Date by Delivery Option and Product All Volume Mandatory Mandatory Best Effort $11,092,215 24.1% $4,635,758 10.1% 34.1% $3,262,000 7.1% $9,447,881 20.5% 27.6% $13,231,565 28.7% $4,441,280 9.6% 38.3% Grand Total Best Effort All Volume $1,141,130 19.5% 31 $299,552 5.1% 10 $1,440,682 24.6% $15,727,973 $786,900 13.4% 11 $1,070,862 18.3% 29 $1,857,762 31.7% $12,709,881 $1,862,300 31.8% 16 $702,280 12.0% 5 $2,564,580 43.7% $17,672,845 September Year to Date 2015 3 20.5% 1 0.0% 4 41 3 79.5% 3 0.0% 6 40 3 0.0% 1 0.0% 4 21 62.1% $17,020,288 0.0% $- 62.1% 20.5% 37.9% $66,167,620 0.0% $- 37.9% 79.5% 0.0% $- 0.0% $- 0.0% 0.0% $3,516,361 27 $- 0 $3,516,361 $17,020,288 $2,142,300 58 $- 0 $2,142,300 $66,167,620 $- 0 $- 0 $- $- 5 21.7% 0 3.6% 5 27 2 53.7% 0 7.3% 2 58 0 10.2% 0 3.4% 0 0 40.4% 58 $28,112,503 2.6% 10 $4,635,758 43.0% 25.3% 25.4% 69 $69,429,620 9.3% 29 $9,447,881 34.7% 61.0% 16.2% 16 $13,231,565 6.1% 5 $4,441,280 22.3% 13.7% $4,657,491 $299,552 $4,957,043 68 $32,748,261 $2,929,200 $1,070,862 $4,000,062 98 $78,877,501 $1,862,300 $702,280 $2,564,580 21 $17,672,845 8 1 9 5 3 8 3 1 4 Gov't Fixed Rate Gov't ARM Conv Conf Fixed Rate Conv Conf ARM Non-Conforming Fixed Non-Conforming ARM Total Gov't Total Conv Conf Total Non-Conforming
- 3. November 10, 2015 Page 3 of 8 Wells Fargo Funding - Correspondent Client Performance Scorecard For September 2015 Except where noted data shown is as of end of business September 30, 2015. Apex Home Loans, Inc 8 2 $11,573.33 $0.00 0 $0.00 0 0.00% 0 0 Billings Current Outstanding ($) Outstanding >60 Days ($) Total Repos/Indems Outstanding (#) Total Repos/Indems Outstanding ($) Final Docs Outstanding 271 to 300 Days From Closing 301 to 330 Days From Closing 331 to 360 Days From Closing > 360 Days Government Insuring # Uninsured >60 Days from Closing % Uninsured >60 Days from Closing Generated: September 2015 Top 5 States by Volume Current Month and Year to Date All Other All Other MD 29 $10,615,732 DC 5 $2,004,806 DE 2 $693,410 VA 2 $655,125 PA 1 $235,600 1 $104,000 MD 216 $76,679,844 DC 44 $18,910,636 VA 35 $15,038,643 DE 12 $3,128,221 NJ 6 $1,229,225 6 $1,986,586 State Units Dollars State Units Dollars 74% 14% 5% 5% 2% 1% 66% 16% 13% 3% 1% 2% % Volume % Volume Total Rural Development September Last 12 Months Total FHA 0.00% 0.00% Total VA 0.00% 0.00% 0.00% 0.00% Total Conv Conf 0.00% 0.00% Total Non-Conforming 0.00% 0.00% 0.00% 0.00% Third Party Originations Percent of Total Volume by Product for Current Month and Last 12 Months Grand Total 3 $1,292,800 $292,500 3.08% 443,989,839 2 $988,643 $- 0.00% 233,318,855 PerformanceWorks? Key Performance Indicator - Hedge Performance Ratio (HPR) HPR 80% or greater - Float to Current eligibility and 20 bps payup. HPR 65% to less than 80% - Float to Current eligibility and 15 bps payup. HPR 50% to less than 65% - Manage the pipeline more effectively and move up to the next level. HPR less than 50% - Will currently be assessed a lock fee. Manage the pipeline to take advantage of Float to Current and Payups. Current Performance Period Jun 1 2015 - Aug 31 2015 Loans Funded Loans Hedge Expired Loans Cancelled Weighted Days Paid Weighted Days Used Prior Performance Period Mar 1 2015 - May 31 2015 Loans Funded Loans Hedge Expired Loans Cancelled Weighted Days Paid Weighted Days Used 13.63% 18.46% Level 1 Level 2 Level 3 Level 4 1 21 $7,897,870 539,932,839 0 14 $4,366,917 264,812,010 83.28% 81.54% HPR - 82.23% : Level 1 HPR - 88.11% : Level 1 *Number of final documents not received for loans funded in the past 12 months.
- 4. November 10, 2015 Page 4 of 8 Wells Fargo Funding - Correspondent Client Performance Scorecard For September 2015 Except where noted data shown is as of end of business September 30, 2015. Apex Home Loans, Inc Generated: Key Performance Indicator - Weighted Average Credit Score Key Performance Indicator - Weighted Average LTV Detail by Product Grand Total Detail by Product Grand Total Average Credit Score Weighted by Funded UPB for Loans Funded in the Current Month Average LTV Ratio Weighted by Funded UPB for Loans Funded in the Current Month 738 736741 744 83.73% 81.86%82.92% 77.72% 694 701 719 703 698 701 713 722 687 707 710705 762 753 763 766 754762 770 774 801 775 774774 93.49% 93.99% 96.41% 91.90% 93.99% 93.95% 68.72% 74.12% 102.04% 101.88% 86.75%81.35% 76.15% 78.80% 76.33% 69.80% 78.57%76.16% 73.69% 72.99% 75.00% 71.30% 72.48%73.84% Benchmarks Client Levels for Sep-15 Trend Over Last 12 Months by Family Past 12 Mos Client Past 12 Mos Benchmarks Client Levels for Sep-15 Trend Over Last 12 Months by Family Past 12 Mos Client Past 12 Mos 670 706 745 700 680 706 733 724 - 719 713695 755 753 749 765 753754 793 777 - 769 775793 96.22% 94.12% 96.50% 92.47% 96.26% 94.07% 59.77% 85.17% - 101.81% 91.12%85.80% 82.36% 79.88% 81.09% 70.77% 79.40%82.08% 80.00% 74.12% - 70.30% 73.26%80.00% Sep-15 Sep-15 Sep-15 Sep-15 Channel Average Channel Average Total Rural Development Total Rural Development FHA Fixed Rate FHA ARM Conv Conf Fixed Rate Conv Conf ARM Non-Conforming Fixed Non-Conforming ARM FHA Fixed Rate FHA ARM Conv Conf Fixed Rate Conv Conf ARM Non-Conforming Fixed Non-Conforming ARM Total FHA Total VA Total FHA Total VA Total Gov't Total Conv Conf Total Non-Conforming Total Gov't Total Conv Conf Total Non-Conforming Conv Conf- Conv Conf- Greater than 714 Between 700 and 714 Between 690 and 699 Less than 690 Greater than 769 Between 760 and 769 Between 745 and 759 Less than 745 Greater than 769 Between 760 and 769 Between 745 and 759 Less than 745 Less than 80% Between 80% and 94.99% Between 95% and 96.99% 97% or above Less than 60% Between 60% and 74.99% Between 75% and 79.99% 80% or above Less than 60% Between 60% and 74.99% Between 75% and 79.99% 80% or above Gov't- Non-Conf- 716 764 - 741 746 801 697 769 - 693 761 - 703 747 - 688 766 - 735 772 758 709 783 - 721 764 771 724 762 - 680 759 781 695 754 793 Gov't- Non-Conf- 99.62% 73.90% - 43.33% 80.22% 75.00% 75.35% 80.48% - 84.12% 78.92% - 74.98% 76.61% - 78.28% 71.31% - 96.44% 75.68% 72.99% 96.75% 73.01% - 92.08% 68.95% 70.60% 85.47% 78.37% - 94.37% 73.48% 75.37% 85.80% 82.08% 80.00% Level 1 Level 2 Level 3 Level 4 Gov't Conv Conf Non-Conforming Gov't Conv Conf Non-Conforming Oct-14 Nov-14 Dec-14 Jan-15 Feb-15 Mar-15 Apr-15 May-15 Jun-15 Jul-15 Aug-15 Sep-15 Level 1 Level 2 Level 3 Level 4 Gov't Conv Conf Non-Conforming Gov't Conv Conf Non-Conforming Level 2 Oct-14 Nov-14 Dec-14 Jan-15 Feb-15 Mar-15 Apr-15 May-15 Jun-15 Jul-15 Aug-15 Sep-15 Level 3 Level 3 Level 1 Level 4 Level 4
- 5. November 10, 2015 Page 5 of 8 Wells Fargo Funding - Correspondent Client Performance Scorecard For September 2015 Except where noted data shown is as of end of business September 30, 2015. Apex Home Loans, Inc Generated: 609 $195,262,101 2 $835,480 Percent of serviced loans purchased in a 24 month period ending 4 months prior to the evaluation month which are 60 or more days delinquent or foreclosed (including REOs). Delinquency Performance of Wells Fargo Serviced Loans Key Performance Indicator - 60+ Days Past Due/Foreclosure Percentage Last evaluated - 3rd Quarter 2015 *Loans purchased between 6/ 1/2013 and 5/31/2015 0.33% FHA ARM 0 $-2 82 $23,680,157 1 $203,761 71 $26,466,654 1 $631,719 7 $1,762,892 0 $- Conv Conf ARM 0 $-6 Non-Conforming ARM 0 $-4 160 $51,909,703 2 $835,480 435 $131,301,253 0 $- 14 $12,051,144 0 $- Total FHA Total VA Total Rural Development Total Gov't Total Conv Conf Total Non-Conforming Client Levels Benchmarks 60+ Delinquencies Grand Total 60+ Delinquency Percentage Month over Month Trend 1 $203,761 $741,0850.00% 1.22% 1.41% 0.00% 0 $- $1,548,5440.00% 0 $- $3,125,8570.00% 1.25% 0.00% 0.00% 80 $22,939,072 429 $129,752,708 10 $8,925,287 60+ % Less Than 2.29% Between 2.29% and 2.86% Between 2.87% and 3.43% Greater Than 3.43% Less Than 0.20% Between 0.20% and 0.25% Between 0.26% and 0.30% Greater Than 0.30% N/A N/A N/A N/A FHA Fixed Rate 1.25% Conv Conf Fixed Rate 0.00% Non-Conforming Fixed 0.00% Level 1 Level 2 Level 3 Level 4 Gov't Conv Conf Non-Conforming Non-Conforming Conv Conf N/A Level 1 Level 1 Total ServicedEvaluated Pct by Product Gov't Gov't- Conv Conf- Non-Conf- 0.49% - - 0.49% - - 0.49% - - 1.01% - - 0.54% - - - - - 0.58% - - 0.58% - - 0.60% - - 0.57% - - 0.62% - - - 1.25% - Oct-14 Nov-14 Dec-14 Jan-15 Feb-15 Mar-15 Apr-15 May-15 Jun-15 Jul-15 Aug-15 Sep-15
- 6. November 10, 2015 Page 6 of 8 Wells Fargo Funding - Correspondent Client Performance Scorecard For September 2015 Except where noted data shown is as of end of business September 30, 2015. Apex Home Loans, Inc Generated: Current Delinquencies by Days Past Due and Product For Loans Purchased Between 06/01/2013 and 05/31/2015 (Past 24 months, 4 months offset) For Loans Purchased Between 06/01/2014 and 05/31/2015 (Past 12 months, 4 months offset) FHA Fixed Rate 80 $22,939,072 1 $280,768 1.25% 0 $- 0.00% 0 $- 0.00% 1 $203,761 1.25% 2 $484,529 2.50% FHA ARM 2 $741,085 1 $405,474 50.00% 0 $- 0.00% 0 $- 0.00% 0 $- 0.00% 1 $405,474 50.00% 3.66% 2.82% 0.00% 3.13% Conv Conf Fixed Rate 429 $129,752,708 0 $- 0.00% 0 $- 0.00% 0 $- 0.00% 0 $- 0.00% 0 $- 0.00% Conv Conf ARM 6 $1,548,544 0 $- 0.00% 0 $- 0.00% 0 $- 0.00% 0 $- 0.00% 0 $- 0.00% 0.00% Non-Conforming Fixed 10 $8,925,287 0 $- 0.00% 0 $- 0.00% 0 $- 0.00% 0 $- 0.00% 0 $- 0.00% Non-Conforming ARM 4 $3,125,857 0 $- 0.00% 0 $- 0.00% 0 $- 0.00% 0 $- 0.00% 0 $- 0.00% 0.00% 0.82% FHA Fixed Rate 49 $13,668,141 1 $280,768 2.04% 0 $- 0.00% 0 $- 0.00% 1 $203,761 2.04% 2 $484,529 4.08% FHA ARM 2 $741,085 1 $405,474 50.00% 0 $- 0.00% 0 $- 0.00% 0 $- 0.00% 1 $405,474 50.00% 5.88% 1.75% 0.00% 3.48% Conv Conf Fixed Rate 210 $65,005,917 0 $- 0.00% 0 $- 0.00% 0 $- 0.00% 0 $- 0.00% 0 $- 0.00% Conv Conf ARM 5 $1,442,943 0 $- 0.00% 0 $- 0.00% 0 $- 0.00% 0 $- 0.00% 0 $- 0.00% 0.00% Non-Conforming Fixed 7 $6,501,098 0 $- 0.00% 0 $- 0.00% 0 $- 0.00% 0 $- 0.00% 0 $- 0.00% Non-Conforming ARM 2 $1,607,058 0 $- 0.00% 0 $- 0.00% 0 $- 0.00% 0 $- 0.00% 0 $- 0.00% 0.00% 1.18% Total Serviced 30 Days Delinqent 60 Days Delinquent 90 Days Delinquent In Foreclosure (incl REO) Delinquent or In Foreclosure Total Serviced 30 Days Delinqent 60 Days Delinquent 90 Days Delinquent In Foreclosure (incl REO) Delinquent or In Foreclosure $890,003 $828,497 $- $1,718,500 $- $- $1,718,500 $890,003 $196,777 $- $1,086,780 $- $- $1,086,780 3 2 0 5 0 0 5 3 1 0 4 0 0 4 1.22% 0.00% 0.00% 0.63% 0.00% 0.00% 0.16% 1.96% 0.00% 0.00% 0.87% 0.00% 0.00% 0.29% $203,761 $- $- $203,761 $- $- $203,761 $203,761 $- $- $203,761 $- $- $203,761 1 0 0 1 0 0 1 1 0 0 1 0 0 1 0.00% 0.00% 0.00% 0.00% 0.00% 0.00% 0.00% 0.00% 0.00% 0.00% 0.00% 0.00% 0.00% 0.00% $- $- $- $- $- $- $- $- $- $- $- $- $- $- 0 0 0 0 0 0 0 0 0 0 0 0 0 0 0.00% 1.41% 0.00% 0.63% 0.00% 0.00% 0.16% 0.00% 0.00% 0.00% 0.00% 0.00% 0.00% 0.00% $- $631,719 $- $631,719 $- $- $631,719 $- $- $- $- $- $- $- 0 1 0 1 0 0 1 0 0 0 0 0 0 0 2.44% 1.41% 0.00% 1.88% 0.00% 0.00% 0.49% 3.92% 1.75% 0.00% 2.61% 0.00% 0.00% 0.88% $686,242 $196,777 $- $883,020 $- $- $883,020 $686,242 $196,777 $- $883,020 $- $- $883,020 2 1 0 3 0 0 3 2 1 0 3 0 0 3 $23,680,157 $26,466,654 $1,762,892 $51,909,703 $131,301,253 $12,051,144 $195,262,101 $14,409,227 $21,572,829 $1,762,892 $37,744,948 $66,448,859 $8,108,156 $112,301,964 82 71 7 160 435 14 609 51 57 7 115 215 9 339 Total Gov't Total Conv Conf Total Non-Conforming Total Gov't Total Conv Conf Total Non-Conforming Total FHA Total VA Total Rural Development Total FHA Total VA Total Rural Development Grand Total Grand Total
- 7. November 10, 2015 Page 7 of 8 Wells Fargo Funding - Correspondent Client Performance Scorecard For September 2015 Except where noted data shown is as of end of business September 30, 2015. Apex Home Loans, Inc Generated: Early Payment Defaults Early Payoffs Loans purchased in a 24 month period ending 4 months prior to the current month and 90 days or more delinquent in the first 4 payments to Wells Fargo. Loans paid off within an initial servicing period as specified by Wells Fargo policy. Data shown is based on billing month and may not reflect the month a payoff actually occurred. *No Early Payoffs were billed for December 2012. Detail by Product Detail by Product 0 $- 0 $- 0 $- 0 $- Grand Total Grand Total 3 Months Ago 3 Months Ago FHA Fixed Rate 0 $- FHA ARM 0 $- $- $- $- $- Conv Conf Fixed Rate 0 $- Conv Conf ARM 0 $- $- Non-Conforming Fixed 0 $- Non-Conforming ARM 0 $- $- FHA Fixed Rate 0 $- FHA ARM 0 $- $- $- $- $- Conv Conf Fixed Rate 0 $- Conv Conf ARM 0 $- $- Non-Conforming Fixed 0 $- Non-Conforming ARM 0 $- $- Sep-15 Sep-15 $- 0 $- 0 0 0 0 0 $- 0 $- 0 0 $- 0 $- 0 0 $- 0 $- 0 0 0 0 0 $- 0 $- 0 0 $- 0 $- 0 0 12 Month Trend 12 Month Trend $- $- $- $- $- $- $- $- $- $- $- $- Total Rural Development Total Rural Development 0 0 0 0 0 0 0 0 0 0 0 0 Total FHA Total VA Total FHA Total VA 0 $- 0 $- 0 $- 0 $- 0 $- 0 $- 0 $- 0 $- 0 $- 0 $- 0 $- 0 $- 0 $- 0 $- 0 $- 1 $0.40 1 $0.27 0 $- 0 $- 2 $0.46 0 $- 0 $- 0 $- 0 $- Total Gov't Total Conv Conf Total Non-Conforming Total Gov't Total Conv Conf Total Non-Conforming Units Dollars Units Dollars
- 8. Eric Gates Minneapolis Suite 400 Rockville, MD 20852 301-610-5393 Active 12/02/2010 Joseph.Mcshea@wellsfargo.com Mary Ann Geller 217-547-6442 Joseph McShea 240-651-6257 2332417 Closed Loan November 10, 2015 Page 8 of 8 Wells Fargo Funding - Correspondent Client Performance Scorecard For September 2015 Delivery Location Phone Client Status Client Status DateAddress Sales Executive maryann.geller@wellsfargo.com Client Sales Consultant Business Agreement ID Business Program Client Information This information is for use by mortgage professionals only and should not be distributed to or used by consumers or other third-parties. Information is accurate as of date of printing and is subject to change without notice. Wells Fargo Funding is a division of Wells Fargo Bank, N.A. © 2012 Wells Fargo Bank, N.A. All Rights Reserved. NMLSR ID 399801 Except where noted data shown is as of end of business September 30, 2015. Apex Home Loans, Inc 3204 Tower Oaks Blvd Notes Contact Name Generated: 13.00 10.58 22.00 10.61 55.88% 55.75%2.91%0.00% 7/01/2015 - 9/30/20159/01/2015 - 9/30/2015 Suspense Trending of File Suspense and Average Days to Clear File Suspense (past 12 Months) Note File Note File File and Note Suspense for Current Month and Last 90 Days Suspense Ratio *Suspense is shown as a percentage of loans reviewed in the given date range. Days to Clear is calculated for loans approved in the given date range. Avg Days to Clear 5.00 44.44% 6.25 36.84% 7.79 48.48% 13.00 38.64% 8.53 39.29% 8.71 50.00% 10.40 46.43% 12.50 47.06% 16.00 43.24% 12.88 48.57% 8.10 63.64% 10.58 55.88% Approved Programs 1 Connectivity 2 Best Effort 3 Wells Fargo Underwriting 4 Image Express 5 Delegated Underwriting 6 FHA 7 Non-Agency Prime Jumbo 8 Mandatory 9 VA 10 Standard DU Recert of Value 11 Rural Development (RDGRH) 12 E-Delivery - Initial Disclosures 13 E-Signature - Initial Disclosures