Download as PDF, PPTX
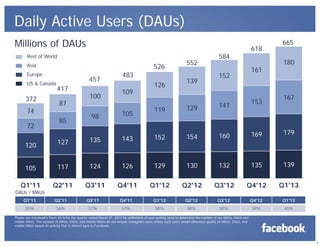
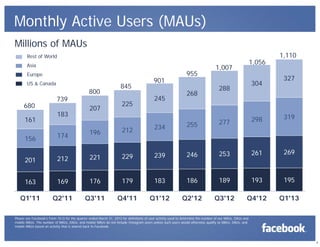
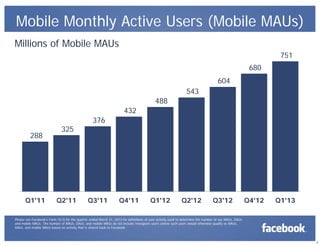
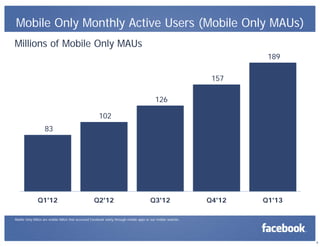
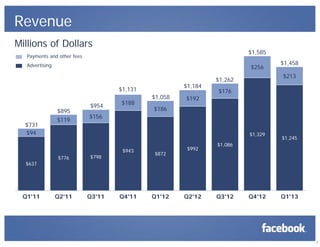
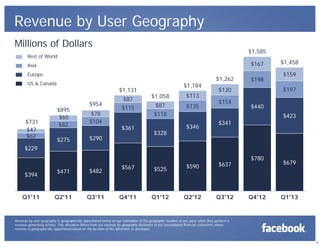
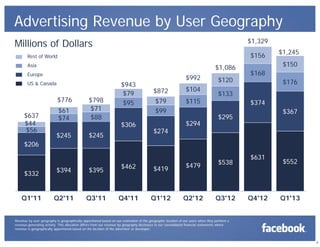
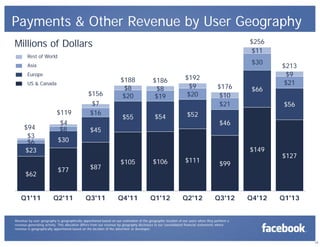
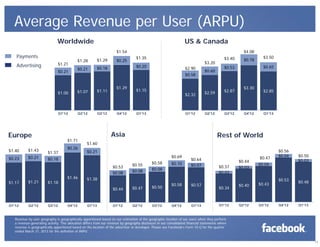
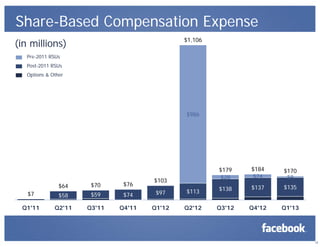
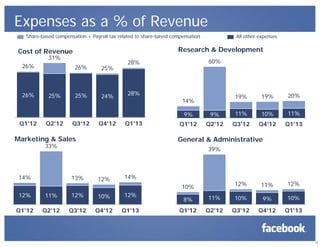
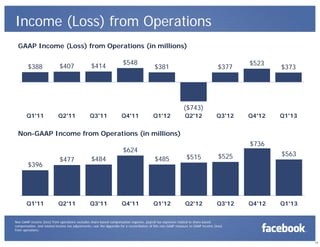
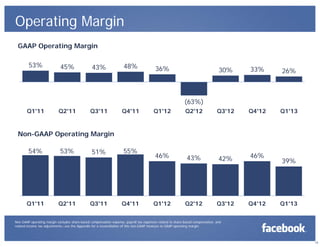
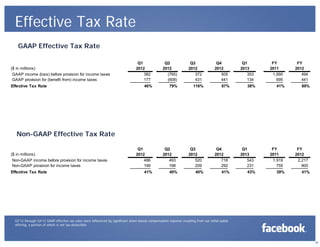
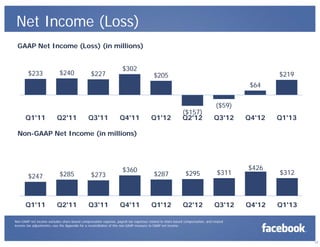
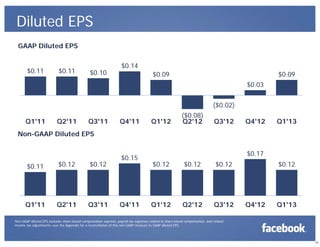
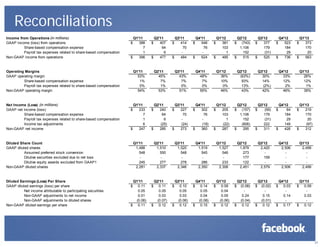
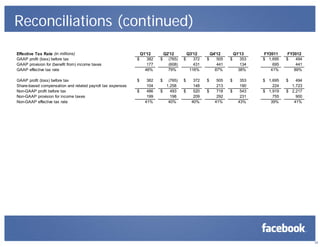


The document details Facebook's Q1 2013 earnings, highlighting both GAAP and non-GAAP financial metrics. It includes statistics on daily and monthly active users, advertising revenue across different geographical segments, and key financial ratios such as average revenue per user and net income. Additional insights are provided on share-based compensation effects and operating margins.


![[1] sk & kd pai](https://cdn.slidesharecdn.com/ss_thumbnails/1skkdpai-130124091259-phpapp02-thumbnail.jpg?width=640&height=640&fit=bounds)
![[2] pemetaan sk & kd pai](https://cdn.slidesharecdn.com/ss_thumbnails/2pemetaanskkdpai-130124091421-phpapp02-thumbnail.jpg?width=640&height=640&fit=bounds)


