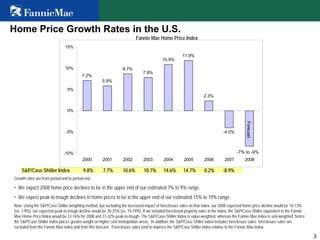
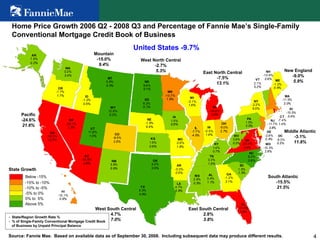
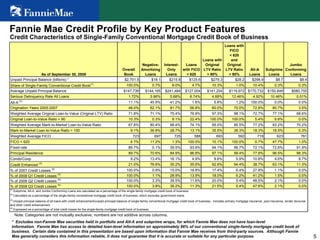
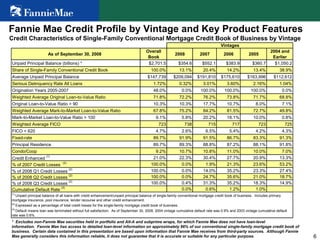
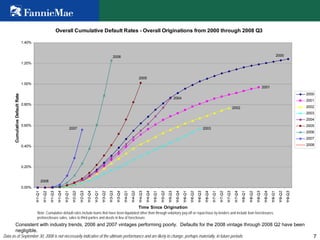
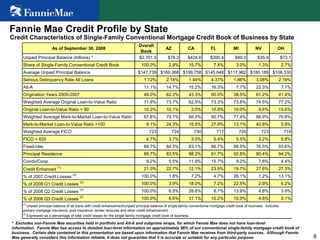
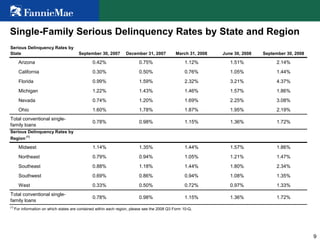
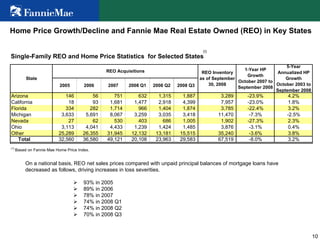
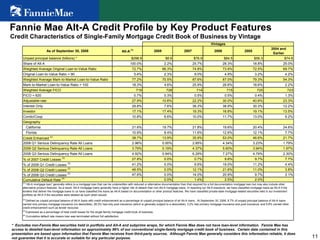
November 10, 2008
Fannie Mae
2008 Q3 10-Q Credit Supplement
1
These materials present tables and other information about Fannie
Mae, including information contained in Fannie Mae’s Quarterly Report
on Form 10-Q for the quarter ended September 30, 2008, or 2008 Q3
Form 10-Q. Some of the terms used in these materials are defined and
discussed more fully in the 2008 Q3 Form 10-Q and Fannie Mae’s
Annual Report on Form 10-K for the year ended December 31, 2007, or
2007 Form 10-K. These materials should be reviewed together with the
2008 Q3 Form 10-Q and the 2007 Form 10-K, copies of which are
available on Fannie Mae’s Web site at www.fanniemae.com under the
“Investor Relations” section of the Web site.
This presentation includes forward-looking statements relating to
future home price declines. These statements are based on our
opinions, analyses, estimates, forecasts and other views on a variety
of economic and other information, and changes in the assumptions
and other information underlying these views could produce
materially different results. The impact of future home price declines
on our business, results or financial condition will depend on many
other factors.
2
Table of Contents
Slide
Home Price Growth Rates in the U.S. 3
Home Price Growth 2006 Q2 - 2008 Q3 and Percentage of
Fannie Mae's Single-Family Conventional Mortgage Credit
Book of Business
4
Fannie Mae Credit Profile by Key Product Features 5
Fannie Mae Credit Profile by Vintage and Key Product
Features
6
Overall Cumulative Default Rates - Overall Originations from
2000 through 2008 Q3
7
Fannie Mae Credit Profile by State 8
Single-Family Serious Delinquency Rates by State and Region 9
Home Price Growth/Decline and Fannie Mae Real Estate
Owned (REO) in Key States
10
Fannie Mae Alt-A Credit Profile by Key Product Features 11
Fannie Mae Alt-A Loans Versus Loans Underlying Private
Label Alt-A Securities
12
Workouts by Type 13
Nonperforming Single-Family and Multifamily Assets 14
3
Home Price Growth Rates in the U.S.
Growth rates are from period-end to period-end.
• We expect 2008 home price declines to be in the upper end of our estimated 7% to 9% range.
• We expect peak-to-trough declines in home prices to be in the upper end of our estimated 15% to 19% range.
Note: Using the S&P/Case-Shiller weighting method, but excluding the increased impact of foreclosure sales on that index, our 2008 expected home price decline would be 10-13%
(vs. 7-9%); our expected peak-to-trough decline would be 20-25% (vs. 15-19%). If we included foreclosed property sales in the index, the S&P/Case-Shiller equivalent to the Fannie
Mae Home Price Index would be 12-16% for 2008 and 27-32% peak-to-trough. The S&P/Case-Shiller Index is value-weighted, whereas the Fannie Mae index is unit-weighted; hence
the S&P/Case-Shiller index places greater weight on higher cost metropolitan areas. In addition, the S&P/Case Shiller index includes foreclosure sales; foreclosure sales are
excluded from the Fannie Mae index and from this forecast. Foreclosure sales tend to depress the S&P/Case Shiller index relative to the Fannie Mae index.
S&P/Case Shiller Index 9.8% 7.7% 10.6% 10.7% 14.6% 14.7% 0.2% -8.9%
Fannie Mae Home Price Index
7.2%
5.9%
8.7%
7.9%
10.9%
11.9%
2.3%
-4.0%
-8.3%
-10%
-5%
0%
5%
10%
15%
2000 2001 2002 2003 2004 2005 2006 2007 2008
Forecast
-7% to -9%
4
Home Price Growth 2006 Q2 - 2008 Q3 and Percentage of Fannie Mae’s Single-Family
Conventional Mortgage Credit Book of Business
Source: Fannie Mae. Based on available data as of September 30, 2008. Including subsequent data may produce different results.
- State/Region Growth Rate %
- % of Single-Family Conventional Mortgage Credit Book
of Business by Unpaid Principal Balance
United States -9.7%
West North Central
-2.7%
5.3%
Mountain
-15.0%
9.4%
West South Central
4.7%
7.0%
East South Central
2.8%
3.8%
East North Central
-7.5%
13.1%
New England
-9.0%
5.9%
Middle Atlantic
-3.1%
11.8%
South Atlantic
-15.5%
21.5%
Pacific
-24.6%
21.6%
State Growth
Below -15%
-15% to -10%
-5% to 0%
0% to 5%
Above 5%
-10% to -5%
AK
1.5%
0.2%
HI
-10.1%
0.8%
VT
2.1%
0.2%
WV
3.9%
0.2%
PA
1.5%
3.0%
NC
6.2%
2.6%
SC
1.0%
1.3%
MS
2.9%
0.5%
AL
3.4%
1.1%
TN
3.3%
1.5%
KY
1.4%
0.7%
IA
1.5%
0.6%
KS
1.9%
0.6%
LA
4.7%
0.9%
OK
5.2%
0.6%
TX
5.3%
4.9%
SD
8.2%
0.1%
ND
8.6%
0.1%
NM
3.8%
0.6%
MT
5.6%
0.3%
WA
0.2%
3.4%
DE
-2.8%
0.4%
CT
-7.4%
1.4%
DC
-9.3%
0.3%
ME
-1.2%
0.4%
NY
-2.2%
5.0%
OH
-5.0%
2.7%
WI
-2.1%
1.6%
IN
-0.5%
1.4%
IL
-7.7%
4.5%
GA
-1.2%
3.1%
MO
-2.6%
1.6%
NE
-1.9%
0.4%
ID
-1.2%
0.5%
AR
-0.3%
0.5%
UT
11.8%
1.0%
WY
12.8%
0.2%
CO
-8.5%
2.5%
OR
-1.7%
1.7%
NH
-10.6%
0.6%
MI
-16.4%
3.0%
MA
-11.5%
3.0%
RI
-15.5%
0.4%
MD
-15.3%
2.8%
AZ
-30.9%
2.9%
NJ
-11.7%
3.8%
VA
-23.4%
3.4%
FL
-31.8%
7.4%
MN
-10.7%
1.9%
NV
-35.1%
1.3%
CA
-32.0%
15.7%
5
Fannie Mae Credit Profile by Key Product Features
Note: Categories are not mutually exclusive; numbers are not additive across columns.
Credit Characteristics of Single-Family Conventional Mortgage Credit Book of Business
* Excludes non-Fannie Mae securities held in portfolio and Alt-A and subprime wraps, for which Fannie Mae does not have loan-level
information. Fannie Mae has access to detailed loan-level information on approximately 96% of our conventional single-family mortgage credit book of
business. Certain data contained in this presentation are based upon information that Fannie Mae receives from third-party sources. Although Fannie
Mae generally considers this information reliable, it does not guarantee that it is accurate or suitable for any particular purpose.
As of September 30, 2008
Overall
Book
Negative-
Amortizing
Loans
Interest-
Only
Loans
Loans
with FICO
< 620
Loans with
Original
LTV Ratio
> 90%
Loans with
FICO
< 620
and
Original
LTV Ratio
> 90%
Alt-A
Loans
Subprime
Loans
Jumbo
Conforming
Loans
Unpaid Principal Balance (billions) * $2,701.5 $18.1 $215.8 $125.6 $279.3 $28.2 $298.9 $8.7 $8.4
Share of Single-Family Conventional Credit Book
(1)
100.0% 0.7% 8.0% 4.7% 10.3% 1.0% 10.4% 0.3% 0.3%
Average Unpaid Principal Balance $147,739 $144,165 $241,484 $127,004 $141,204 $119,972 $170,732 $150,849 $580,755
Serious Delinquency Rate All Loans 1.72% 3.96% 5.68% 6.74% 4.68% 12.46% 4.92% 10.46% 0.01%
Alt-A
(2)
11.1% 45.9% 41.2% 1.6% 5.8% 1.2% 100.0% 0.0% 0.0%
Origination Years 2005-2007 48.0% 62.1% 81.7% 56.8% 60.0% 70.0% 72.8% 80.7% 3.5%
Weighted Average Original Loan-to-Value (Original LTV) Ratio 71.8% 71.1% 75.4% 76.8% 97.3% 98.1% 72.7% 77.1% 68.6%
Original Loan-to-Value Ratio > 90 10.3% 0.3% 9.1% 22.4% 100.0% 100.0% 5.4% 6.8% 0.0%
Weighted Average Mark-to-Market Loan-to-Value Ratio 67.8% 80.4% 88.4% 74.1% 95.0% 95.5% 77.2% 83.2% 70.2%
Mark-to-Market Loan-to-Value Ratio > 100 9.1% 36.8% 28.7% 13.1% 35.5% 36.3% 18.3% 18.5% 0.3%
Weighted Average FICO 723 697 725 588 693 592 719 623 761
FICO < 620 4.7% 11.2% 1.3% 100.0% 10.1% 100.0% 0.7% 47.7% 1.0%
Fixed-rate 89.7% 0.1% 39.5% 93.6% 94.1% 96.7% 72.1% 72.6% 91.9%
Principal Residence 89.7% 70.6% 84.9% 96.8% 97.1% 99.4% 77.8% 96.5% 98.3%
Condo/Coop 9.2% 13.4% 16.1% 4.9% 9.8% 5.9% 10.8% 4.6% 9.7%
Credit Enhanced
(3)
21.0% 76.6% 35.2% 35.6% 92.6% 94.4% 38.7% 63.1% 11.3%
% of 2007 Credit Losses
(4)
100.0% 0.9% 15.0% 18.8% 17.4% 6.4% 27.8% 1.1% 0.0%
% of 2008 Q1 Credit Losses
(4)
100.0% 1.1% 28.9% 13.9% 18.0% 6.2% 41.2% 1.5% 0.0%
% of 2008 Q2 Credit Losses
(4)
100.0% 3.3% 35.5% 11.6% 20.0% 5.4% 48.5% 2.1% 0.0%
% of 2008 Q3 Credit Losses
(4)
100.0% 3.8% 36.2% 11.3% 21.5% 5.4% 47.6% 2.1% 0.0%
(1)
Subprime, Alt-A, and Jumbo Conforming Loans are calculated as a percentage of the single-family mortgage credit book of business.
(2)
Calculated as a percentage of the single-family conventional mortgage credit book of business, which excludes government loans.
(4)
Expressed as a percentage of total credit losses for the single-family mortgage credit book of business.
(3)
Unpaid principal balance of all loans with credit enhancement/unpaid principal balance of single-family conventional mortgage credit book of business. Includes primary mortgage insurance, pool insurance, lender recourse
and other credit enhancement.
6
Fannie Mae Credit Profile by Vintage and Key Product Features
Credit Characteristics of Single-Family Conventional Mortgage Credit Book of Business by Vintage
As of September 30, 2008
Overall
Book
2008 2007 2006 2005
2004 and
Earlier
Unpaid Principal Balance (billions) * $2,701.5 $354.6 $552.1 $383.9 $360.7 $1,050.2
Share of Single-Family Conventional Credit Book 100.0% 13.1% 20.4% 14.2% 13.4% 38.9%
Average Unpaid Principal Balance $147,739 $209,094 $191,810 $175,610 $163,996 $112,612
Serious Delinquency Rate All Loans 1.72% 0.32% 3.01% 3.60% 2.16% 1.04%
Origination Years 2005-2007 48.0% 0.0% 100.0% 100.0% 100.0% 0.0%
Weighted Average Original Loan-to-Value Ratio 71.8% 72.2% 76.2% 73.8% 71.7% 68.8%
Original Loan-to-Value Ratio > 90 10.3% 10.3% 17.7% 10.7% 8.0% 7.1%
Weighted Average Mark-to-Market Loan-to-Value Ratio 67.8% 75.2% 84.2% 81.5% 72.7% 49.8%
Mark-to-Market Loan-to-Value Ratio > 100 9.1% 5.8% 20.2% 18.1% 10.0% 0.8%
Weighted Average FICO 723 738 715 717 723 725
FICO < 620 4.7% 2.6% 6.5% 5.4% 4.2% 4.3%
Fixed-rate 89.7% 91.9% 91.5% 86.7% 83.3% 91.3%
Principal Residence 89.7% 89.3% 88.8% 87.2% 88.1% 91.8%
Condo/Coop 9.2% 10.7% 10.8% 11.0% 10.0% 7.0%
Credit Enhanced
(1)
21.0% 22.3% 30.4% 27.7% 20.9% 13.3%
% of 2007 Credit Losses
(2)
100.0% 0.0% 1.9% 21.3% 23.6% 53.2%
% of 2008 Q1 Credit Losses
(2)
100.0% 0.0% 14.0% 35.2% 23.3% 27.4%
% of 2008 Q2 Credit Losses
(2)
100.0% 0.0% 24.7% 35.6% 21.0% 18.7%
% of 2008 Q3 Credit Losses
(2)
100.0% 0.4% 31.3% 35.2% 18.3% 14.9%
Cumulative Default Rate
(3)
0.0% 0.6% 1.2% 1.0%
(2)
Expressed as a percentage of total credit losses for the single-family mortgage credit book of business.
(3)
Default means loan was terminated without full satisfaction. As of September 30, 2008, 2004 vintage cumulative default rate was 0.9% and 2003 vintage cumulative default
rate was 0.6%.
Vintages
(1)
Unpaid principal balance of all loans with credit enhancement/unpaid principal balance of single-family conventional mortgage credit book of business. Includes primary
mortgage insurance, pool insurance, lender recourse and other credit enhancement.
* Excludes non-Fannie Mae securities held in portfolio and Alt-A and subprime wraps, for which Fannie Mae does not have loan-level
information. Fannie Mae has access to detailed loan-level information on approximately 96% of our conventional single-family mortgage credit book of
business. Certain data contained in this presentation are based upon information that Fannie Mae receives from third-party sources. Although Fannie
Mae generally considers this information reliable, it does not guarantee that it is accurate or suitable for any particular purpose.
7Data as of September 30, 2008 is not necessarily indicative of the ultimate performance and are likely to change, perhaps materially, in future periods.
Consistent with industry trends, 2006 and 2007 vintages performing poorly. Defaults for the 2008 vintage through 2008 Q2 have been
negligible.
Overall Cumulative Default Rates - Overall Originations from 2000 through 2008 Q3
2000
2001
2002
2003
2004
2005
2006
2007
2008
0.00%
0.20%
0.40%
0.60%
0.80%
1.00%
1.20%
1.40%
Yr1-Q1
Yr1-Q2
Yr1-Q3
Yr1-Q4
Yr2-Q1
Yr2-Q2
Yr2-Q3
Yr2-Q4
Yr3-Q1
Yr3-Q2
Yr3-Q3
Yr3-Q4
Yr4-Q1
Yr4-Q2
Yr4-Q3
Yr4-Q4
Yr5-Q1
Yr5-Q2
Yr5-Q3
Yr5-Q4
Yr6-Q1
Yr6-Q2
Yr6-Q3
Yr6-Q4
Yr7-Q1
Yr7-Q2
Yr7-Q3
Yr7-Q4
Yr8-Q1
Yr8-Q2
Yr8-Q3
Yr8-Q4
Yr9-Q1
Yr9-Q2
Yr9-Q3
Time Since Origination
CumulativeDefaultRate
2000
2001
2002
2003
2004
2005
2006
2007
2008
Note: Cumulative default rates include loans that have been liquidated other than through voluntary pay-off or repurchase by lenders and include loan foreclosures,
preforeclosure sales, sales to third parties and deeds in lieu of foreclosure.
8
Fannie Mae Credit Profile by State
Credit Characteristics of Single-Family Conventional Mortgage Credit Book of Business by State
As of September 30, 2008
Overall
Book
AZ CA FL MI NV OH
Unpaid Principal Balance (billions) * $2,701.5 $78.2 $424.6 $200.4 $80.0 $35.9 $73.1
Share of Single-Family Conventional Credit Book 100.0% 2.9% 15.7% 7.4% 3.0% 1.3% 2.7%
Average Unpaid Principal Balance $147,739 $160,368 $199,758 $145,648 $117,962 $180,189 $106,330
Serious Delinquency Rate All Loans 1.72% 2.14% 1.44% 4.37% 1.86% 3.08% 2.19%
Alt-A 11.1% 14.7% 15.2% 16.3% 7.7% 22.3% 7.1%
Origination Years 2005-2007 48.0% 62.2% 43.3% 60.0% 38.5% 61.2% 41.4%
Weighted Average Original Loan-to-Value Ratio 71.8% 73.7% 62.5% 73.3% 73.8% 74.5% 77.2%
Original Loan-to-Value Ratio > 90 10.3% 10.1% 3.0% 10.9% 10.0% 9.6% 15.6%
Weighted Average Mark-to-Market Loan-to-Value Ratio 67.8% 79.7% 66.5% 80.7% 77.4% 88.9% 70.8%
Mark-to-Market Loan-to-Value Ratio >100 9.1% 24.3% 16.5% 27.9% 13.1% 40.8% 5.9%
Weighted Average FICO 723 724 730 717 720 723 719
FICO < 620 4.7% 3.7% 3.0% 5.4% 5.5% 3.2% 5.8%
Fixed-rate 89.7% 84.5% 83.1% 86.7% 89.5% 76.5% 93.6%
Principal Residence 89.7% 83.5% 88.2% 81.7% 92.8% 80.4% 94.2%
Condo/Coop 9.2% 5.5% 11.9% 15.7% 9.2% 7.8% 4.4%
Credit Enhanced
(1)
21.0% 22.7% 12.1% 23.9% 19.7% 27.6% 27.3%
% of 2007 Credit Losses
(2)
100.0% 1.8% 7.2% 4.7% 26.1% 1.2% 13.1%
% of 2008 Q1 Credit Losses
(2)
100.0% 3.9% 18.0% 7.2% 22.5% 2.9% 6.2%
% of 2008 Q2 Credit Losses
(2)
100.0% 6.5% 28.6% 8.1% 13.9% 4.8% 3.9%
% of 2008 Q3 Credit Losses
(2)
100.0% 8.6% 31.1% 10.2% 10.9% 4.8% 3.1%
(2)
Expressed as a percentage of total credit losses for the single-family mortgage credit book of business.
(1)
Unpaid principal balance of all loans with credit enhancement/unpaid principal balance of single-family conventional mortgage credit book of business. Includes
primary mortgage insurance, pool insurance, lender recourse and other credit enhancement.
* Excludes non-Fannie Mae securities held in portfolio and Alt-A and subprime wraps, for which Fannie Mae does not have loan-level
information. Fannie Mae has access to detailed loan-level information on approximately 96% of our conventional single-family mortgage credit book of
business. Certain data contained in this presentation are based upon information that Fannie Mae receives from third-party sources. Although Fannie
Mae generally considers this information reliable, it does not guarantee that it is accurate or suitable for any particular purpose.
9
Single-Family Serious Delinquency Rates by State and Region
Serious Delinquency Rates by
State September 30, 2007 December 31, 2007 March 31, 2008 June 30, 2008 September 30, 2008
Arizona 0.42% 0.75% 1.12% 1.51% 2.14%
California 0.30% 0.50% 0.76% 1.05% 1.44%
Florida 0.99% 1.59% 2.32% 3.21% 4.37%
Michigan 1.22% 1.43% 1.46% 1.57% 1.86%
Nevada 0.74% 1.20% 1.69% 2.25% 3.08%
Ohio 1.60% 1.78% 1.87% 1.95% 2.19%
Total conventional single-
family loans
0.78% 0.98% 1.15% 1.36% 1.72%
Serious Delinquency Rates by
Region (1)
Midwest 1.14% 1.35% 1.44% 1.57% 1.86%
Northeast 0.79% 0.94% 1.05% 1.21% 1.47%
Southeast 0.88% 1.18% 1.44% 1.80% 2.34%
Southwest 0.69% 0.86% 0.94% 1.08% 1.35%
West 0.33% 0.50% 0.72% 0.97% 1.33%
Total conventional single-
family loans
0.78% 0.98% 1.15% 1.36% 1.72%
(1)
For information on which states are contained within each region, please see the 2008 Q3 Form 10-Q.
10
Home Price Growth/Decline and Fannie Mae Real Estate Owned (REO) in Key States
On a national basis, REO net sales prices compared with unpaid principal balances of mortgage loans have
decreased as follows, driving increases in loss severities.
93% in 2005
89% in 2006
78% in 2007
74% in 2008 Q1
74% in 2008 Q2
70% in 2008 Q3
Single-Family REO and Home Price Statistics for Selected States
(1)
2005 2006 2007 2008 Q1 2008 Q2 2008 Q3
Arizona 146 56 751 632 1,315 1,887 3,289 -23.9% 4.2%
California 18 93 1,681 1,477 2,918 4,399 7,957 -23.0% 1.8%
Florida 334 282 1,714 966 1,404 1,874 3,785 -22.4% 3.2%
Michigan 3,633 5,691 8,067 3,259 3,035 3,418 11,470 -7.3% -2.5%
Nevada 27 62 530 403 686 1,005 1,902 -27.3% 2.3%
Ohio 3,113 4,041 4,433 1,239 1,424 1,485 3,876 -3.1% 0.4%
Other 25,289 26,355 31,945 12,132 13,181 15,515 35,240 -3.6% 3.8%
Total 32,560 36,580 49,121 20,108 23,963 29,583 67,519 -8.0% 3.2%
(1)
Based on Fannie Mae Home Price Index.
5-Year
Annualized HP
Growth
October 2003 to
September 2008
State
1-Year HP
Growth
October 2007 to
September 2008
REO Inventory
as of September
30, 2008
REO Acquisitions
11
Fannie Mae Alt-A Credit Profile by Key Product Features
Credit Characteristics of Single-Family Mortgage Credit Book of Business by Vintage
* Excludes non-Fannie Mae securities held in portfolio and Alt-A and subprime wraps, for which Fannie Mae does not have loan-level information. Fannie Mae has
access to detailed loan-level information on approximately 96% of our conventional single-family mortgage credit book of business. Certain data contained in this
presentation are based upon information that Fannie Mae receives from third-party sources. Although Fannie Mae generally considers this information reliable, it does
not guarantee that it is accurate or suitable for any particular purpose.
As of September 30, 2008 Alt-A(1)
2008 2007 2006 2005
2004 and
Earlier
Unpaid principal balance (billions) * $298.9 $6.6 $76.9 $84.5 $56.3 $74.6
Share of Alt-A 100.0% 2.2% 25.7% 28.3% 18.8% 25.0%
Weighted Average Original Loan-to-Value Ratio 72.7% 66.3% 74.8% 73.9% 72.5% 69.7%
Original Loan-to-Value Ratio > 90 5.4% 2.3% 9.0% 4.9% 3.2% 4.2%
Weighted Average Mark-to-Market Loan-to-Value Ratio 77.2% 70.5% 87.6% 87.0% 79.3% 54.3%
Mark-to-Market Loan-to-Value Ratio > 100 18.3% 4.6% 25.9% 26.6% 18.6% 2.2%
Weighted Average FICO 719 728 714 715 725 723
FICO < 620 0.7% 0.3% 0.5% 0.5% 0.4% 1.3%
Adjustable-rate 27.9% 10.6% 22.2% 30.0% 40.6% 23.3%
Interest Only 29.8% 7.6% 38.3% 38.9% 30.3% 12.2%
Investor 17.1% 17.4% 19.3% 16.8% 19.1% 13.5%
Condo/Coop 10.8% 6.6% 10.0% 11.7% 13.0% 9.2%
Geography
California 21.6% 19.7% 21.8% 19.6% 20.4% 24.6%
Florida 10.9% 8.4% 11.6% 12.6% 12.1% 7.7%
Credit Enhanced
(2)
38.7% 13.9% 35.9% 53.0% 46.6% 21.7%
2008 Q1 Serious Delinquency Rate All Loans 2.96% 0.00% 2.85% 4.34% 3.23% 1.79%
2008 Q2 Serious Delinquency Rate All Loans 3.79% 0.19% 4.37% 5.60% 3.94% 1.97%
2008 Q3 Serious Delinquency Rate All Loans 4.92% 0.94% 6.29% 7.27% 4.79% 2.30%
% of 2007 Credit Losses
(3)
27.8% 0.0% 0.7% 9.8% 9.7% 7.7%
% of 2008 Q1 Credit Losses
(3)
41.2% 0.0% 6.6% 19.0% 11.2% 4.4%
% of 2008 Q2 Credit Losses
(3)
48.5% 0.0% 12.1% 21.6% 11.0% 3.8%
% of 2008 Q3 Credit Losses
(3)
47.6% 0.0% 14.0% 20.9% 9.7% 3.1%
Cumulative Default Rate
(4)
0.0% 1.4% 2.5% 2.0%
(2)
Defined as unpaid principal balance of Alt-A loans with credit enhancement as a percentage of unpaid principal balance of all Alt-A loans. At September 30, 2008, 8.7% of unpaid principal balance of Alt-A loans
carried only primary mortgage insurance (no deductible), 26.2% had only pool insurance (which is generally subject to a deductible), 3.2% had primary mortgage insurance and pool insurance, and 0.6% carried other
credit enhancement such as lender recourse.
Vintages
(4)
Cumulative default rate means loan was terminated without full satisfaction.
(3)
Expressed as a percentage of total credit losses for the single-family mortgage credit book of business.
(1)
“Alt-A mortgage loan” generally refers to a mortgage loan that can be underwritten with reduced or alternative documentation than that required for a full documentation mortgage loan but may also include other
alternative product features. As a result, Alt-A mortgage loans generally have a higher risk of default than non-Alt-A mortgage loans. In reporting our Alt-A exposure, we have classified mortgage loans as Alt-A if the
lenders that deliver the mortgage loans to us have classified the loans as Alt-A based on documentation or other product features. We have classified private-label mortgage-related securities held in our investment
portfolio as Alt-A if the securities were labeled as such when issued.
12
Fannie Mae Alt-A Loans Versus Loans Underlying Private-Label Alt-A Securities
Private-label securities data source are from First American CoreLogic, LoanPerformance data, which estimates it captures 97 percent of Alt-A private-
label securities. The private-label securities data include some loans that Fannie Mae holds in its Alt-A securities portfolio. Certain amounts have been
calculated by Fannie Mae.
Fannie Mae’s Alt-A guaranty book of business has more favorable credit characteristics than the loans backing
private-label Alt-A securities and is performing better across vintages.
Private label security data source: First American CoreLogic, LoanPerformance data.
Note: Last data point on each curve is as of August 31, 2008. All other data points are as of quarter end.
Cumulative Default Rates for Fannie Mae Alt-A (Thin Red Lines) and Private
Label Alt-A (Bold Blue Lines) for 2005, 2006, and 2007 Cohorts
0.00%
1.00%
2.00%
3.00%
4.00%
5.00%
6.00%
1 2 3 4 5 6 7 8 9 10 11 12 13 14
Quarters Since Origination
2007 PLS
2007 FNM
2006 PLS
2006 FNM
2005 PLS
2005 FNM
Fannie Mae Private-Label Security Market
As of August
2008
Outstanding loans
backing non-agency
Conforming Alt-A MBS
as of August 2008
Weighted Average Loan Characteristics:
FICO 719 710
Original Loan-to-Value Ratio 73% 75%
Cumulative Loan-to-Value at
Origination (1)
77% 79%
Product Type:
Fixed Rate 72% 43%
Adjustable Rate 28% 57%
Interest Only 20% 25%
Negatively Amortizing 3% 27%
Investor 17% 22%
(1)
Includes first liens and any subordinate liens present at origination
Fannie Mae Alt-A Loans Versus Private Label Security
Conforming Alt-A
13
Workouts by Type
(1) Modifications involve adding past due interest amounts to the loan principal amount and recovering them over the remaining life of the
loan or through an extension of the term, and other loan adjustments.
(2) HomeSaver Advance involves providing unsecured, personal loans to help borrowers after a temporary financial difficulty to bring
their delinquent mortgage loans current.
(3) Repayment plans involve plans to repay past due principal and interest over a reasonable period of time through temporarily higher
monthly payments. Loans with repayment plans are included for loans that were at least 60 days delinquent; our 2007 Form 10-K
reported loans with repayment plans only for loans that were at least 90 days delinquent. Forbearances involve an agreement to
suspend or reduce borrower payments for a period of time.
(4) In a preforeclosure sale, the borrower, working with the servicer, sells the home and pays off all or part of the outstanding loan,
accrued interest and other expenses from the sale proceeds.
(5) Deeds in lieu of foreclosure involve the borrower signing over title to the property without the added expense of a foreclosure
proceeding.
Workout Composition
-
5,000
10,000
15,000
20,000
25,000
30,000
35,000
40,000
2007 Q4 2008 Q1 2008 Q2 2008 Q3
#ofLoans
Modifications (1) HomeSaver Advance (2)
Repayment plans and forbearances completed (3) Preforeclosure sales (4)
Deeds in lieu of foreclosure (5)
14
Nonperforming Single-Family and Multifamily Assets
September 30, 2008 June 30, 2008 December 31, 2007
Loans:
On-balance sheet Single-Family and Multifamily nonperforming loans 14,261 11,341 10,108
Off-balance sheet Single-Family and Multifamily nonperforming loans
(1)
49,387 34,787 25,700
Total nonperforming loans 63,648 46,128 35,808
Properties:
Carrying value of Single-Family foreclosed properties
(2)
7,237 5,808 3,440
Carrying value of Multifamily foreclosed properties
(2)
90 85 43
Total carrying value of foreclosed properties 7,327 5,893 3,483
Total Nonperforming Assets 70,975$ 52,021$ 39,291$
Guaranty Book of Business plus Foreclosed Properties 2,948,443$ 2,904,100$ 2,747,720$
Ratio of Nonperforming Loans to Guaranty Book of Business 2.2% 1.6% 1.3%
Ratio of Nonperforming Assets to Guaranty Book of Business plus Foreclosed Properties 2.4% 1.8% 1.4%
As of
(Dollars in Millions)
(1)
Represents unpaid principal balance of nonperforming loans in our outstanding and unconsolidated Fannie Mae MBS held by third parties.
(2)
Excludes foreclosed property claims receivables, which are reported in our condensed consolidated balance sheets as a component of "Acquired property, net."

fannie mae Credit Supplement

  • 1.
    November 10, 2008 FannieMae 2008 Q3 10-Q Credit Supplement
  • 2.
    1 These materials presenttables and other information about Fannie Mae, including information contained in Fannie Mae’s Quarterly Report on Form 10-Q for the quarter ended September 30, 2008, or 2008 Q3 Form 10-Q. Some of the terms used in these materials are defined and discussed more fully in the 2008 Q3 Form 10-Q and Fannie Mae’s Annual Report on Form 10-K for the year ended December 31, 2007, or 2007 Form 10-K. These materials should be reviewed together with the 2008 Q3 Form 10-Q and the 2007 Form 10-K, copies of which are available on Fannie Mae’s Web site at www.fanniemae.com under the “Investor Relations” section of the Web site. This presentation includes forward-looking statements relating to future home price declines. These statements are based on our opinions, analyses, estimates, forecasts and other views on a variety of economic and other information, and changes in the assumptions and other information underlying these views could produce materially different results. The impact of future home price declines on our business, results or financial condition will depend on many other factors.
  • 3.
    2 Table of Contents Slide HomePrice Growth Rates in the U.S. 3 Home Price Growth 2006 Q2 - 2008 Q3 and Percentage of Fannie Mae's Single-Family Conventional Mortgage Credit Book of Business 4 Fannie Mae Credit Profile by Key Product Features 5 Fannie Mae Credit Profile by Vintage and Key Product Features 6 Overall Cumulative Default Rates - Overall Originations from 2000 through 2008 Q3 7 Fannie Mae Credit Profile by State 8 Single-Family Serious Delinquency Rates by State and Region 9 Home Price Growth/Decline and Fannie Mae Real Estate Owned (REO) in Key States 10 Fannie Mae Alt-A Credit Profile by Key Product Features 11 Fannie Mae Alt-A Loans Versus Loans Underlying Private Label Alt-A Securities 12 Workouts by Type 13 Nonperforming Single-Family and Multifamily Assets 14
  • 4.
    3 Home Price GrowthRates in the U.S. Growth rates are from period-end to period-end. • We expect 2008 home price declines to be in the upper end of our estimated 7% to 9% range. • We expect peak-to-trough declines in home prices to be in the upper end of our estimated 15% to 19% range. Note: Using the S&P/Case-Shiller weighting method, but excluding the increased impact of foreclosure sales on that index, our 2008 expected home price decline would be 10-13% (vs. 7-9%); our expected peak-to-trough decline would be 20-25% (vs. 15-19%). If we included foreclosed property sales in the index, the S&P/Case-Shiller equivalent to the Fannie Mae Home Price Index would be 12-16% for 2008 and 27-32% peak-to-trough. The S&P/Case-Shiller Index is value-weighted, whereas the Fannie Mae index is unit-weighted; hence the S&P/Case-Shiller index places greater weight on higher cost metropolitan areas. In addition, the S&P/Case Shiller index includes foreclosure sales; foreclosure sales are excluded from the Fannie Mae index and from this forecast. Foreclosure sales tend to depress the S&P/Case Shiller index relative to the Fannie Mae index. S&P/Case Shiller Index 9.8% 7.7% 10.6% 10.7% 14.6% 14.7% 0.2% -8.9% Fannie Mae Home Price Index 7.2% 5.9% 8.7% 7.9% 10.9% 11.9% 2.3% -4.0% -8.3% -10% -5% 0% 5% 10% 15% 2000 2001 2002 2003 2004 2005 2006 2007 2008 Forecast -7% to -9%
  • 5.
    4 Home Price Growth2006 Q2 - 2008 Q3 and Percentage of Fannie Mae’s Single-Family Conventional Mortgage Credit Book of Business Source: Fannie Mae. Based on available data as of September 30, 2008. Including subsequent data may produce different results. - State/Region Growth Rate % - % of Single-Family Conventional Mortgage Credit Book of Business by Unpaid Principal Balance United States -9.7% West North Central -2.7% 5.3% Mountain -15.0% 9.4% West South Central 4.7% 7.0% East South Central 2.8% 3.8% East North Central -7.5% 13.1% New England -9.0% 5.9% Middle Atlantic -3.1% 11.8% South Atlantic -15.5% 21.5% Pacific -24.6% 21.6% State Growth Below -15% -15% to -10% -5% to 0% 0% to 5% Above 5% -10% to -5% AK 1.5% 0.2% HI -10.1% 0.8% VT 2.1% 0.2% WV 3.9% 0.2% PA 1.5% 3.0% NC 6.2% 2.6% SC 1.0% 1.3% MS 2.9% 0.5% AL 3.4% 1.1% TN 3.3% 1.5% KY 1.4% 0.7% IA 1.5% 0.6% KS 1.9% 0.6% LA 4.7% 0.9% OK 5.2% 0.6% TX 5.3% 4.9% SD 8.2% 0.1% ND 8.6% 0.1% NM 3.8% 0.6% MT 5.6% 0.3% WA 0.2% 3.4% DE -2.8% 0.4% CT -7.4% 1.4% DC -9.3% 0.3% ME -1.2% 0.4% NY -2.2% 5.0% OH -5.0% 2.7% WI -2.1% 1.6% IN -0.5% 1.4% IL -7.7% 4.5% GA -1.2% 3.1% MO -2.6% 1.6% NE -1.9% 0.4% ID -1.2% 0.5% AR -0.3% 0.5% UT 11.8% 1.0% WY 12.8% 0.2% CO -8.5% 2.5% OR -1.7% 1.7% NH -10.6% 0.6% MI -16.4% 3.0% MA -11.5% 3.0% RI -15.5% 0.4% MD -15.3% 2.8% AZ -30.9% 2.9% NJ -11.7% 3.8% VA -23.4% 3.4% FL -31.8% 7.4% MN -10.7% 1.9% NV -35.1% 1.3% CA -32.0% 15.7%
  • 6.
    5 Fannie Mae CreditProfile by Key Product Features Note: Categories are not mutually exclusive; numbers are not additive across columns. Credit Characteristics of Single-Family Conventional Mortgage Credit Book of Business * Excludes non-Fannie Mae securities held in portfolio and Alt-A and subprime wraps, for which Fannie Mae does not have loan-level information. Fannie Mae has access to detailed loan-level information on approximately 96% of our conventional single-family mortgage credit book of business. Certain data contained in this presentation are based upon information that Fannie Mae receives from third-party sources. Although Fannie Mae generally considers this information reliable, it does not guarantee that it is accurate or suitable for any particular purpose. As of September 30, 2008 Overall Book Negative- Amortizing Loans Interest- Only Loans Loans with FICO < 620 Loans with Original LTV Ratio > 90% Loans with FICO < 620 and Original LTV Ratio > 90% Alt-A Loans Subprime Loans Jumbo Conforming Loans Unpaid Principal Balance (billions) * $2,701.5 $18.1 $215.8 $125.6 $279.3 $28.2 $298.9 $8.7 $8.4 Share of Single-Family Conventional Credit Book (1) 100.0% 0.7% 8.0% 4.7% 10.3% 1.0% 10.4% 0.3% 0.3% Average Unpaid Principal Balance $147,739 $144,165 $241,484 $127,004 $141,204 $119,972 $170,732 $150,849 $580,755 Serious Delinquency Rate All Loans 1.72% 3.96% 5.68% 6.74% 4.68% 12.46% 4.92% 10.46% 0.01% Alt-A (2) 11.1% 45.9% 41.2% 1.6% 5.8% 1.2% 100.0% 0.0% 0.0% Origination Years 2005-2007 48.0% 62.1% 81.7% 56.8% 60.0% 70.0% 72.8% 80.7% 3.5% Weighted Average Original Loan-to-Value (Original LTV) Ratio 71.8% 71.1% 75.4% 76.8% 97.3% 98.1% 72.7% 77.1% 68.6% Original Loan-to-Value Ratio > 90 10.3% 0.3% 9.1% 22.4% 100.0% 100.0% 5.4% 6.8% 0.0% Weighted Average Mark-to-Market Loan-to-Value Ratio 67.8% 80.4% 88.4% 74.1% 95.0% 95.5% 77.2% 83.2% 70.2% Mark-to-Market Loan-to-Value Ratio > 100 9.1% 36.8% 28.7% 13.1% 35.5% 36.3% 18.3% 18.5% 0.3% Weighted Average FICO 723 697 725 588 693 592 719 623 761 FICO < 620 4.7% 11.2% 1.3% 100.0% 10.1% 100.0% 0.7% 47.7% 1.0% Fixed-rate 89.7% 0.1% 39.5% 93.6% 94.1% 96.7% 72.1% 72.6% 91.9% Principal Residence 89.7% 70.6% 84.9% 96.8% 97.1% 99.4% 77.8% 96.5% 98.3% Condo/Coop 9.2% 13.4% 16.1% 4.9% 9.8% 5.9% 10.8% 4.6% 9.7% Credit Enhanced (3) 21.0% 76.6% 35.2% 35.6% 92.6% 94.4% 38.7% 63.1% 11.3% % of 2007 Credit Losses (4) 100.0% 0.9% 15.0% 18.8% 17.4% 6.4% 27.8% 1.1% 0.0% % of 2008 Q1 Credit Losses (4) 100.0% 1.1% 28.9% 13.9% 18.0% 6.2% 41.2% 1.5% 0.0% % of 2008 Q2 Credit Losses (4) 100.0% 3.3% 35.5% 11.6% 20.0% 5.4% 48.5% 2.1% 0.0% % of 2008 Q3 Credit Losses (4) 100.0% 3.8% 36.2% 11.3% 21.5% 5.4% 47.6% 2.1% 0.0% (1) Subprime, Alt-A, and Jumbo Conforming Loans are calculated as a percentage of the single-family mortgage credit book of business. (2) Calculated as a percentage of the single-family conventional mortgage credit book of business, which excludes government loans. (4) Expressed as a percentage of total credit losses for the single-family mortgage credit book of business. (3) Unpaid principal balance of all loans with credit enhancement/unpaid principal balance of single-family conventional mortgage credit book of business. Includes primary mortgage insurance, pool insurance, lender recourse and other credit enhancement.
  • 7.
    6 Fannie Mae CreditProfile by Vintage and Key Product Features Credit Characteristics of Single-Family Conventional Mortgage Credit Book of Business by Vintage As of September 30, 2008 Overall Book 2008 2007 2006 2005 2004 and Earlier Unpaid Principal Balance (billions) * $2,701.5 $354.6 $552.1 $383.9 $360.7 $1,050.2 Share of Single-Family Conventional Credit Book 100.0% 13.1% 20.4% 14.2% 13.4% 38.9% Average Unpaid Principal Balance $147,739 $209,094 $191,810 $175,610 $163,996 $112,612 Serious Delinquency Rate All Loans 1.72% 0.32% 3.01% 3.60% 2.16% 1.04% Origination Years 2005-2007 48.0% 0.0% 100.0% 100.0% 100.0% 0.0% Weighted Average Original Loan-to-Value Ratio 71.8% 72.2% 76.2% 73.8% 71.7% 68.8% Original Loan-to-Value Ratio > 90 10.3% 10.3% 17.7% 10.7% 8.0% 7.1% Weighted Average Mark-to-Market Loan-to-Value Ratio 67.8% 75.2% 84.2% 81.5% 72.7% 49.8% Mark-to-Market Loan-to-Value Ratio > 100 9.1% 5.8% 20.2% 18.1% 10.0% 0.8% Weighted Average FICO 723 738 715 717 723 725 FICO < 620 4.7% 2.6% 6.5% 5.4% 4.2% 4.3% Fixed-rate 89.7% 91.9% 91.5% 86.7% 83.3% 91.3% Principal Residence 89.7% 89.3% 88.8% 87.2% 88.1% 91.8% Condo/Coop 9.2% 10.7% 10.8% 11.0% 10.0% 7.0% Credit Enhanced (1) 21.0% 22.3% 30.4% 27.7% 20.9% 13.3% % of 2007 Credit Losses (2) 100.0% 0.0% 1.9% 21.3% 23.6% 53.2% % of 2008 Q1 Credit Losses (2) 100.0% 0.0% 14.0% 35.2% 23.3% 27.4% % of 2008 Q2 Credit Losses (2) 100.0% 0.0% 24.7% 35.6% 21.0% 18.7% % of 2008 Q3 Credit Losses (2) 100.0% 0.4% 31.3% 35.2% 18.3% 14.9% Cumulative Default Rate (3) 0.0% 0.6% 1.2% 1.0% (2) Expressed as a percentage of total credit losses for the single-family mortgage credit book of business. (3) Default means loan was terminated without full satisfaction. As of September 30, 2008, 2004 vintage cumulative default rate was 0.9% and 2003 vintage cumulative default rate was 0.6%. Vintages (1) Unpaid principal balance of all loans with credit enhancement/unpaid principal balance of single-family conventional mortgage credit book of business. Includes primary mortgage insurance, pool insurance, lender recourse and other credit enhancement. * Excludes non-Fannie Mae securities held in portfolio and Alt-A and subprime wraps, for which Fannie Mae does not have loan-level information. Fannie Mae has access to detailed loan-level information on approximately 96% of our conventional single-family mortgage credit book of business. Certain data contained in this presentation are based upon information that Fannie Mae receives from third-party sources. Although Fannie Mae generally considers this information reliable, it does not guarantee that it is accurate or suitable for any particular purpose.
  • 8.
    7Data as ofSeptember 30, 2008 is not necessarily indicative of the ultimate performance and are likely to change, perhaps materially, in future periods. Consistent with industry trends, 2006 and 2007 vintages performing poorly. Defaults for the 2008 vintage through 2008 Q2 have been negligible. Overall Cumulative Default Rates - Overall Originations from 2000 through 2008 Q3 2000 2001 2002 2003 2004 2005 2006 2007 2008 0.00% 0.20% 0.40% 0.60% 0.80% 1.00% 1.20% 1.40% Yr1-Q1 Yr1-Q2 Yr1-Q3 Yr1-Q4 Yr2-Q1 Yr2-Q2 Yr2-Q3 Yr2-Q4 Yr3-Q1 Yr3-Q2 Yr3-Q3 Yr3-Q4 Yr4-Q1 Yr4-Q2 Yr4-Q3 Yr4-Q4 Yr5-Q1 Yr5-Q2 Yr5-Q3 Yr5-Q4 Yr6-Q1 Yr6-Q2 Yr6-Q3 Yr6-Q4 Yr7-Q1 Yr7-Q2 Yr7-Q3 Yr7-Q4 Yr8-Q1 Yr8-Q2 Yr8-Q3 Yr8-Q4 Yr9-Q1 Yr9-Q2 Yr9-Q3 Time Since Origination CumulativeDefaultRate 2000 2001 2002 2003 2004 2005 2006 2007 2008 Note: Cumulative default rates include loans that have been liquidated other than through voluntary pay-off or repurchase by lenders and include loan foreclosures, preforeclosure sales, sales to third parties and deeds in lieu of foreclosure.
  • 9.
    8 Fannie Mae CreditProfile by State Credit Characteristics of Single-Family Conventional Mortgage Credit Book of Business by State As of September 30, 2008 Overall Book AZ CA FL MI NV OH Unpaid Principal Balance (billions) * $2,701.5 $78.2 $424.6 $200.4 $80.0 $35.9 $73.1 Share of Single-Family Conventional Credit Book 100.0% 2.9% 15.7% 7.4% 3.0% 1.3% 2.7% Average Unpaid Principal Balance $147,739 $160,368 $199,758 $145,648 $117,962 $180,189 $106,330 Serious Delinquency Rate All Loans 1.72% 2.14% 1.44% 4.37% 1.86% 3.08% 2.19% Alt-A 11.1% 14.7% 15.2% 16.3% 7.7% 22.3% 7.1% Origination Years 2005-2007 48.0% 62.2% 43.3% 60.0% 38.5% 61.2% 41.4% Weighted Average Original Loan-to-Value Ratio 71.8% 73.7% 62.5% 73.3% 73.8% 74.5% 77.2% Original Loan-to-Value Ratio > 90 10.3% 10.1% 3.0% 10.9% 10.0% 9.6% 15.6% Weighted Average Mark-to-Market Loan-to-Value Ratio 67.8% 79.7% 66.5% 80.7% 77.4% 88.9% 70.8% Mark-to-Market Loan-to-Value Ratio >100 9.1% 24.3% 16.5% 27.9% 13.1% 40.8% 5.9% Weighted Average FICO 723 724 730 717 720 723 719 FICO < 620 4.7% 3.7% 3.0% 5.4% 5.5% 3.2% 5.8% Fixed-rate 89.7% 84.5% 83.1% 86.7% 89.5% 76.5% 93.6% Principal Residence 89.7% 83.5% 88.2% 81.7% 92.8% 80.4% 94.2% Condo/Coop 9.2% 5.5% 11.9% 15.7% 9.2% 7.8% 4.4% Credit Enhanced (1) 21.0% 22.7% 12.1% 23.9% 19.7% 27.6% 27.3% % of 2007 Credit Losses (2) 100.0% 1.8% 7.2% 4.7% 26.1% 1.2% 13.1% % of 2008 Q1 Credit Losses (2) 100.0% 3.9% 18.0% 7.2% 22.5% 2.9% 6.2% % of 2008 Q2 Credit Losses (2) 100.0% 6.5% 28.6% 8.1% 13.9% 4.8% 3.9% % of 2008 Q3 Credit Losses (2) 100.0% 8.6% 31.1% 10.2% 10.9% 4.8% 3.1% (2) Expressed as a percentage of total credit losses for the single-family mortgage credit book of business. (1) Unpaid principal balance of all loans with credit enhancement/unpaid principal balance of single-family conventional mortgage credit book of business. Includes primary mortgage insurance, pool insurance, lender recourse and other credit enhancement. * Excludes non-Fannie Mae securities held in portfolio and Alt-A and subprime wraps, for which Fannie Mae does not have loan-level information. Fannie Mae has access to detailed loan-level information on approximately 96% of our conventional single-family mortgage credit book of business. Certain data contained in this presentation are based upon information that Fannie Mae receives from third-party sources. Although Fannie Mae generally considers this information reliable, it does not guarantee that it is accurate or suitable for any particular purpose.
  • 10.
    9 Single-Family Serious DelinquencyRates by State and Region Serious Delinquency Rates by State September 30, 2007 December 31, 2007 March 31, 2008 June 30, 2008 September 30, 2008 Arizona 0.42% 0.75% 1.12% 1.51% 2.14% California 0.30% 0.50% 0.76% 1.05% 1.44% Florida 0.99% 1.59% 2.32% 3.21% 4.37% Michigan 1.22% 1.43% 1.46% 1.57% 1.86% Nevada 0.74% 1.20% 1.69% 2.25% 3.08% Ohio 1.60% 1.78% 1.87% 1.95% 2.19% Total conventional single- family loans 0.78% 0.98% 1.15% 1.36% 1.72% Serious Delinquency Rates by Region (1) Midwest 1.14% 1.35% 1.44% 1.57% 1.86% Northeast 0.79% 0.94% 1.05% 1.21% 1.47% Southeast 0.88% 1.18% 1.44% 1.80% 2.34% Southwest 0.69% 0.86% 0.94% 1.08% 1.35% West 0.33% 0.50% 0.72% 0.97% 1.33% Total conventional single- family loans 0.78% 0.98% 1.15% 1.36% 1.72% (1) For information on which states are contained within each region, please see the 2008 Q3 Form 10-Q.
  • 11.
    10 Home Price Growth/Declineand Fannie Mae Real Estate Owned (REO) in Key States On a national basis, REO net sales prices compared with unpaid principal balances of mortgage loans have decreased as follows, driving increases in loss severities. 93% in 2005 89% in 2006 78% in 2007 74% in 2008 Q1 74% in 2008 Q2 70% in 2008 Q3 Single-Family REO and Home Price Statistics for Selected States (1) 2005 2006 2007 2008 Q1 2008 Q2 2008 Q3 Arizona 146 56 751 632 1,315 1,887 3,289 -23.9% 4.2% California 18 93 1,681 1,477 2,918 4,399 7,957 -23.0% 1.8% Florida 334 282 1,714 966 1,404 1,874 3,785 -22.4% 3.2% Michigan 3,633 5,691 8,067 3,259 3,035 3,418 11,470 -7.3% -2.5% Nevada 27 62 530 403 686 1,005 1,902 -27.3% 2.3% Ohio 3,113 4,041 4,433 1,239 1,424 1,485 3,876 -3.1% 0.4% Other 25,289 26,355 31,945 12,132 13,181 15,515 35,240 -3.6% 3.8% Total 32,560 36,580 49,121 20,108 23,963 29,583 67,519 -8.0% 3.2% (1) Based on Fannie Mae Home Price Index. 5-Year Annualized HP Growth October 2003 to September 2008 State 1-Year HP Growth October 2007 to September 2008 REO Inventory as of September 30, 2008 REO Acquisitions
  • 12.
    11 Fannie Mae Alt-ACredit Profile by Key Product Features Credit Characteristics of Single-Family Mortgage Credit Book of Business by Vintage * Excludes non-Fannie Mae securities held in portfolio and Alt-A and subprime wraps, for which Fannie Mae does not have loan-level information. Fannie Mae has access to detailed loan-level information on approximately 96% of our conventional single-family mortgage credit book of business. Certain data contained in this presentation are based upon information that Fannie Mae receives from third-party sources. Although Fannie Mae generally considers this information reliable, it does not guarantee that it is accurate or suitable for any particular purpose. As of September 30, 2008 Alt-A(1) 2008 2007 2006 2005 2004 and Earlier Unpaid principal balance (billions) * $298.9 $6.6 $76.9 $84.5 $56.3 $74.6 Share of Alt-A 100.0% 2.2% 25.7% 28.3% 18.8% 25.0% Weighted Average Original Loan-to-Value Ratio 72.7% 66.3% 74.8% 73.9% 72.5% 69.7% Original Loan-to-Value Ratio > 90 5.4% 2.3% 9.0% 4.9% 3.2% 4.2% Weighted Average Mark-to-Market Loan-to-Value Ratio 77.2% 70.5% 87.6% 87.0% 79.3% 54.3% Mark-to-Market Loan-to-Value Ratio > 100 18.3% 4.6% 25.9% 26.6% 18.6% 2.2% Weighted Average FICO 719 728 714 715 725 723 FICO < 620 0.7% 0.3% 0.5% 0.5% 0.4% 1.3% Adjustable-rate 27.9% 10.6% 22.2% 30.0% 40.6% 23.3% Interest Only 29.8% 7.6% 38.3% 38.9% 30.3% 12.2% Investor 17.1% 17.4% 19.3% 16.8% 19.1% 13.5% Condo/Coop 10.8% 6.6% 10.0% 11.7% 13.0% 9.2% Geography California 21.6% 19.7% 21.8% 19.6% 20.4% 24.6% Florida 10.9% 8.4% 11.6% 12.6% 12.1% 7.7% Credit Enhanced (2) 38.7% 13.9% 35.9% 53.0% 46.6% 21.7% 2008 Q1 Serious Delinquency Rate All Loans 2.96% 0.00% 2.85% 4.34% 3.23% 1.79% 2008 Q2 Serious Delinquency Rate All Loans 3.79% 0.19% 4.37% 5.60% 3.94% 1.97% 2008 Q3 Serious Delinquency Rate All Loans 4.92% 0.94% 6.29% 7.27% 4.79% 2.30% % of 2007 Credit Losses (3) 27.8% 0.0% 0.7% 9.8% 9.7% 7.7% % of 2008 Q1 Credit Losses (3) 41.2% 0.0% 6.6% 19.0% 11.2% 4.4% % of 2008 Q2 Credit Losses (3) 48.5% 0.0% 12.1% 21.6% 11.0% 3.8% % of 2008 Q3 Credit Losses (3) 47.6% 0.0% 14.0% 20.9% 9.7% 3.1% Cumulative Default Rate (4) 0.0% 1.4% 2.5% 2.0% (2) Defined as unpaid principal balance of Alt-A loans with credit enhancement as a percentage of unpaid principal balance of all Alt-A loans. At September 30, 2008, 8.7% of unpaid principal balance of Alt-A loans carried only primary mortgage insurance (no deductible), 26.2% had only pool insurance (which is generally subject to a deductible), 3.2% had primary mortgage insurance and pool insurance, and 0.6% carried other credit enhancement such as lender recourse. Vintages (4) Cumulative default rate means loan was terminated without full satisfaction. (3) Expressed as a percentage of total credit losses for the single-family mortgage credit book of business. (1) “Alt-A mortgage loan” generally refers to a mortgage loan that can be underwritten with reduced or alternative documentation than that required for a full documentation mortgage loan but may also include other alternative product features. As a result, Alt-A mortgage loans generally have a higher risk of default than non-Alt-A mortgage loans. In reporting our Alt-A exposure, we have classified mortgage loans as Alt-A if the lenders that deliver the mortgage loans to us have classified the loans as Alt-A based on documentation or other product features. We have classified private-label mortgage-related securities held in our investment portfolio as Alt-A if the securities were labeled as such when issued.
  • 13.
    12 Fannie Mae Alt-ALoans Versus Loans Underlying Private-Label Alt-A Securities Private-label securities data source are from First American CoreLogic, LoanPerformance data, which estimates it captures 97 percent of Alt-A private- label securities. The private-label securities data include some loans that Fannie Mae holds in its Alt-A securities portfolio. Certain amounts have been calculated by Fannie Mae. Fannie Mae’s Alt-A guaranty book of business has more favorable credit characteristics than the loans backing private-label Alt-A securities and is performing better across vintages. Private label security data source: First American CoreLogic, LoanPerformance data. Note: Last data point on each curve is as of August 31, 2008. All other data points are as of quarter end. Cumulative Default Rates for Fannie Mae Alt-A (Thin Red Lines) and Private Label Alt-A (Bold Blue Lines) for 2005, 2006, and 2007 Cohorts 0.00% 1.00% 2.00% 3.00% 4.00% 5.00% 6.00% 1 2 3 4 5 6 7 8 9 10 11 12 13 14 Quarters Since Origination 2007 PLS 2007 FNM 2006 PLS 2006 FNM 2005 PLS 2005 FNM Fannie Mae Private-Label Security Market As of August 2008 Outstanding loans backing non-agency Conforming Alt-A MBS as of August 2008 Weighted Average Loan Characteristics: FICO 719 710 Original Loan-to-Value Ratio 73% 75% Cumulative Loan-to-Value at Origination (1) 77% 79% Product Type: Fixed Rate 72% 43% Adjustable Rate 28% 57% Interest Only 20% 25% Negatively Amortizing 3% 27% Investor 17% 22% (1) Includes first liens and any subordinate liens present at origination Fannie Mae Alt-A Loans Versus Private Label Security Conforming Alt-A
  • 14.
    13 Workouts by Type (1)Modifications involve adding past due interest amounts to the loan principal amount and recovering them over the remaining life of the loan or through an extension of the term, and other loan adjustments. (2) HomeSaver Advance involves providing unsecured, personal loans to help borrowers after a temporary financial difficulty to bring their delinquent mortgage loans current. (3) Repayment plans involve plans to repay past due principal and interest over a reasonable period of time through temporarily higher monthly payments. Loans with repayment plans are included for loans that were at least 60 days delinquent; our 2007 Form 10-K reported loans with repayment plans only for loans that were at least 90 days delinquent. Forbearances involve an agreement to suspend or reduce borrower payments for a period of time. (4) In a preforeclosure sale, the borrower, working with the servicer, sells the home and pays off all or part of the outstanding loan, accrued interest and other expenses from the sale proceeds. (5) Deeds in lieu of foreclosure involve the borrower signing over title to the property without the added expense of a foreclosure proceeding. Workout Composition - 5,000 10,000 15,000 20,000 25,000 30,000 35,000 40,000 2007 Q4 2008 Q1 2008 Q2 2008 Q3 #ofLoans Modifications (1) HomeSaver Advance (2) Repayment plans and forbearances completed (3) Preforeclosure sales (4) Deeds in lieu of foreclosure (5)
  • 15.
    14 Nonperforming Single-Family andMultifamily Assets September 30, 2008 June 30, 2008 December 31, 2007 Loans: On-balance sheet Single-Family and Multifamily nonperforming loans 14,261 11,341 10,108 Off-balance sheet Single-Family and Multifamily nonperforming loans (1) 49,387 34,787 25,700 Total nonperforming loans 63,648 46,128 35,808 Properties: Carrying value of Single-Family foreclosed properties (2) 7,237 5,808 3,440 Carrying value of Multifamily foreclosed properties (2) 90 85 43 Total carrying value of foreclosed properties 7,327 5,893 3,483 Total Nonperforming Assets 70,975$ 52,021$ 39,291$ Guaranty Book of Business plus Foreclosed Properties 2,948,443$ 2,904,100$ 2,747,720$ Ratio of Nonperforming Loans to Guaranty Book of Business 2.2% 1.6% 1.3% Ratio of Nonperforming Assets to Guaranty Book of Business plus Foreclosed Properties 2.4% 1.8% 1.4% As of (Dollars in Millions) (1) Represents unpaid principal balance of nonperforming loans in our outstanding and unconsolidated Fannie Mae MBS held by third parties. (2) Excludes foreclosed property claims receivables, which are reported in our condensed consolidated balance sheets as a component of "Acquired property, net."