Weekly market report
•
0 likes•238 views

The QSE Index lost 0.1% over the week. Trading value decreased 13.8% to QR1.32bn, while volume fell 25.1% to 26.36mn shares. Ezdan Holding Group saw the largest decline of 3.78%, while Ahli Bank had the largest gain of 6.52%. Foreign institutions remained net buyers during the week, while Qatari institutions turned to net buying. The market outlook cites Qatar's economy continuing to expand due to growth in non-oil sectors such as construction and financial services.

More Related Content
What's hot
What's hot (20)
Viewers also liked
Viewers also liked (20)
Similar to Weekly market report
Similar to Weekly market report (20)
More from QNB Group
More from QNB Group (20)
Recently uploaded
Recently uploaded (20)
Weekly market report
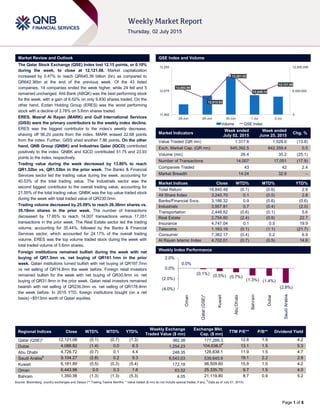
- 1. ` Page 1 of 6 Market Review and Outlook QSE Index and Volume The Qatar Stock Exchange (QSE) Index lost 12.15 points, or 0.10% during the week, to close at 12,121.08. Market capitalization increased by 0.47% to reach QR645.39 billion (bn) as compared to QR642.36bn at the end of the previous week. Of the 43 listed companies, 14 companies ended the week higher, while 24 fell and 5 remained unchanged. Ahli Bank (ABQK) was the best performing stock for the week, with a gain of 6.52% on only 9,830 shares traded. On the other hand, Ezdan Holding Group (ERES) was the worst performing stock with a decline of 3.78% on 5.6mn shares traded. ERES, Masraf Al Rayan (MARK) and Gulf International Services (GISS) were the primary contributors to the weekly index decline. ERES was the biggest contributor to the index’s weekly decrease, shaving off 56.20 points from the index. MARK erased 22.68 points from the index. Further, GISS shed another 7.86 points. On the other hand, QNB Group (QNBK) and Industries Qatar (IQCD) contributed positively to the index. QNBK and IQCD contributed 51.75 and 23.93 points to the index, respectively. Trading value during the week decreased by 13.80% to reach QR1.32bn vs. QR1.53bn in the prior week. The Banks & Financial Services sector led the trading value during the week, accounting for 40.53% of the total trading value. The Industrials sector was the second biggest contributor to the overall trading value, accounting for 21.55% of the total trading value. QNBK was the top value traded stock during the week with total traded value of QR230.0mn. Trading volume decreased by 25.09% to reach 26.36mn shares vs. 35.18mn shares in the prior week. The number of transactions decreased by 17.85% to reach 14,007 transactions versus 17,051 transactions in the prior week. The Real Estate sector led the trading volume, accounting for 35.44%, followed by the Banks & Financial Services sector, which accounted for 24.17% of the overall trading volume. ERES was the top volume traded stock during the week with total traded volume of 5.6mn shares. Foreign institutions remained bullish during the week with net buying of QR7.3mn vs. net buying of QR161.1mn in the prior week. Qatari institutions turned bullish with net buying of QR197.7mn vs net selling of QR14.8mn the week before. Foreign retail investors remained bullish for the week with net buying of QR30.9mn vs. net buying of QR31.9mn in the prior week. Qatari retail investors remained bearish with net selling of QR236.0mn vs. net selling of QR178.4mn the week before. In 2015 YTD, foreign institutions bought (on a net basis) ~$513mn worth of Qatari equities. Market Indicators Week ended July 02, 2015 Week ended June 25, 2015 Chg. % Value Traded (QR mn) 1,317.6 1,528.6 (13.8) Exch. Market Cap. (QR mn) 645,392.5 642,359.4 0.5 Volume (mn) 26.4 35.2 (25.1) Number of Transactions 14,007 17,051 (17.9) Companies Traded 43 42 2.4 Market Breadth 14:24 32:9 – Market Indices Close WTD% MTD% YTD% Total Return 18,840.48 (0.1) (0.6) 2.8 All Share Index 3,240.70 0.1 (0.5) 2.8 Banks/Financial Svcs. 3,186.32 0.9 (0.6) (0.6) Industrials 3,957.81 0.7 (0.4) (2.0) Transportation 2,448.82 (0.6) (0.1) 5.6 Real Estate 2,754.80 (2.4) (0.8) 22.7 Insurance 4,747.04 0.1 0.5 19.9 Telecoms 1,163.19 (0.1) (1.1) (21.7) Consumer 7,382.17 (0.4) 0.2 6.9 Al Rayan Islamic Index 4,702.01 (0.7) (0.5) 14.6 Market Indices Weekly Index Performance Regional Indices Close WTD% MTD% YTD% Weekly Exchange Traded Value ($ mn) Exchange Mkt. Cap. ($ mn) TTM P/E** P/B** Dividend Yield Qatar (QSE)* 12,121.08 (0.1) (0.7) (1.3) 382.38 177,289.3 12.8 1.9 4.2 Dubai 4,088.82 (1.4) 0.0 8.3 1,254.23 104,638.0# 13.1 1.5 5.3 Abu Dhabi 4,726.72 (0.7) 0.1 4.4 248.35 128,838.1 11.9 1.5 4.7 Saudi Arabia# 9,104.27 (2.8) 0.2 9.3 8,543.03 539,645.9 19.1 2.2 2.9 Kuwait 6,181.89 (0.5) (0.3) (5.4) 172.18 96,509.60 15.9 1.0 4.2 Oman 6,443.96 0.0 0.3 1.6 63.52 25,335.70 9.7 1.5 4.0 Bahrain 1,350.38 (1.3) (1.3) (5.3) 4.05 21,119.80 8.7 0.9 5.2 Source: Bloomberg, country exchanges and Zawya (** Trailing Twelve Months; * Value traded ($ mn) do not include special trades, if any; # Data as of July 01, 2015) 12,082.99 12,013.53 12,201.02 12,049.10 12,121.08 0 6,000,000 12,000,000 11,900 12,075 12,250 28-Jun 29-Jun 30-Jun 1-Jul 2-Jul Volume QSE Index 0.0% (0.1%) (0.5%) (0.7%) (1.3%) (1.4%) (2.8%)(4.0%) (2.0%) 0.0% 2.0% Oman Qatar(QSE)* Kuwait AbuDhabi Bahrain Dubai SaudiArabia
- 2. Page 2 of 6 News Economic News QCB auctions T-bills worth QR4bn on July 1 – The Qatar Central Bank (QCB) has auctioned treasury bills worth QR4bn on July 1, for which it received bids totaling QR11.6bn. T-bills worth QR2bn with a three-month maturity period were auctioned at a yield of 0.86%. T-bills worth QR1bn with a six-month maturity period were sold at a yield of 0.86%, while T-bills worth QR1bn with a nine-month maturity period were auctioned at a yield of 0.95%. (QCB) BMI: Qatar fastest growing construction market in GCC – BMI Research has said in a report that Qatar is the fastest growing construction and infrastructure market in the GCC region, buoyed by huge government investment, stable business environment and growing consumer demand. BMI said its “bullish” growth forecasts for Qatar's construction sector are on track, with full-year 2014 real growth standing at 18%. BMI's 10-year forecasts are for an annual average real growth rate of 10.2% in Qatar's construction industry although it states that the growth will be elevated in the run-up to the 2022 FIFA World Cup, averaging 11.4% between 2015 and 2022. BMI report says the industry is navigating capacity constraints seemingly well, although the price pressures will be felt over the medium-term. BMI's Country Risk team believes Qatar's economic activity will continue to expand at a strong pace throughout 2015, driven primarily by growth in the non-oil sector. (Peninsula Qatar) Qatar’s non-mining sector GDP contribution at 62% – Qatar’s economic diversification efforts are fast yielding strong positive results. The share of non-mining sectors in the country’s real GDP has jumped to 62% in 2014, from 55% recorded four years ago. The ‘non-mining and quarrying’ sector has been growing consistently between 10 to 11% per annum since 2011. The non-mining and quarrying sector has recorded a double-digit growth pattern in real terms in recent years. This is primarily because of large investments in construction, financial services and real estate. The rapid development of Qatar’s ‘non-mining and quarrying’ sector has helped offset the recent slowdown in oil & gas revenues. The sector is likely to continue to be the key growth driver, as there are over QR600bn of planned government investments in the infrastructure sector in the run-up to the 2022 World Cup. The Ministry of Development Planning & Statistics (MDPS) in its ‘National Accounts Bulletin (NAB) 2015’ noted Qatar’s ‘overdependence’ on energy sector is fast fading. On the ‘Mining and Quarrying’ sector the MDPS document stated that the gross value added (GVA) from the sector for the year 2014 has been estimated at QR390.7bn, a decrease of 3% over the GVA of 2014. The decrease is mainly attributed to falling international oil prices. The percentage increase in 2011 was 49.8%, which started plummeting in the following year. In 2012, the increase was only 9.8% and it came down to 2% in 2013. This sector has been contributing more than 50% of the total nominal GDP during the 2007-2014 period, and the year 2014 witnessed the lowest contribution. The economic activities, which have grown significantly during 2007-2014 in Qatar are Construction (compound annual growth-CAGR-19.8%); Finance, Insurance, Real Estate and Business Services (CAGR: 12.8%); Government Services (CAGR: 12.7%); Manufacturing (CAGR: 11.4%); Trade, Hotel & Restaurants (CAGR: 10%); and Transport, Storage & Communication (CAGR: 15.3%). (Peninsula Qatar) MDPS: Qatar’s population reaches 2.375mn in May 2015 – According to statistics released by the Ministry of Development Planning & Statistics (MDPS), Qatar’s population reached 2.375mn in May 2015, rising 9.2% YoY. MDPS’ monthly bulletin indicates that May 2015 social security beneficiaries accounted for 11,629 citizens attaining an increase of 1.2% MoM. Visitors to Qatar increased by 10.3% YoY in YTD May 2015. The bulletin also highlights that the vehicles registered in May 2015 reached 9,853 declining 0.8% on a MoM basis. Meanwhile, MDPS, in its National Accounts Bulletin said Qatar's nominal GDP touched QR764.8bn in 2014. The GDP in current prices expanded 2.6 times from QR290bn to QR765bn during the period 2007-14. (MDPS, Qatar Tribune) Market & Corporate News S&P affirms 'AA' ratings on Qatar Petroleum; outlook stable – Standard & Poor's (S&P) Ratings Services affirmed its 'AA' foreign and local currency long-term issuer credit ratings on Qatar Petroleum (QP), Qatar's national oil & gas company. The outlooks are stable. (Bloomberg) QIBK completes QR2bn additional Tier 1 Perpetual Sukuk issue – Qatar Islamic Bank (QIBK) has raised QR2bn in Basel III compliant additional Tier 1 Perpetual Sukuk to enhance its capital adequacy ratios and to support future business growth. (QSE) BRES to disclose financials on July 15 – Barwa Real Estate Company (BRES) will announce the financial reports for the period ending June 30, 2015 on July 15, 2015. (QSE) GWCS to announce financials on July 15 – Gulf Warehouse Company (GWCS) will disclose the financial reports for the period ending June 30, 2015 on July 15, 2015. (QSE) QIMD to disclose financials on July 16 – Qatar Industrial Manufacturing Company (QIMD) will announce the financial reports for the period ending June 30, 2015 on July 16, 2015. (QSE) UDCD to disclose financials on July 15 – United Development Company (UDCD) will announce the financial reports for the period ending June 30, 2015 on July 15, 2015. (QSE) QEWS to announce financials on July 13 – Qatar Electricity and Water Company (QEWS) will disclose the financial reports for the period ending June 30, 2015 on July 13, 2015. (QSE) QIIK to disclose financials on July 14 – Qatar International Islamic Bank (QIIK) will announce the financial reports for the period ending June 30, 2015 on July 14, 2015. (QSE) KCBK to announce financials on July 15 – Al Khalij Commercial Bank (KCBK) will disclose the financial reports for the period ending June 30, 2015 on July 15, 2015. (QSE) MCGS to disclose financials on July 14 – MediCare Group (MCGS) will announce the financial reports for the period ending June 30, 2015 on July 14, 2015. (QSE) NLCS to announce financials on July 15 – AlIjarah Holding Company (NLCS) will disclose the financial reports for the period ending June 30, 2015 on July 15, 2015. (QSE) QIGD to disclose financials on July 14 – Qatari Investors Group (QIGD) will announce the financial reports for the period ending June 30, 2015 on July 14, 2015. (QSE) QGTS to disclose financials on July 14 – Qatar Gas Transport Company (QGTS) will disclose the financial reports for the period ending June 30, 2015 on July 14, 2015. (QSE)
- 3. Page 3 of 6 Qatar Stock Exchange Top Gainers Top Decliners Source: Qatar Stock Exchange (QSE) Source: Qatar Stock Exchange (QSE) Most Active Shares by Value (QR Million) Most Active Shares by Volume (Million) Source: Qatar Stock Exchange (QSE) Source: Qatar Stock Exchange (QSE) Investor Trading Percentage to Total Value Traded Net Traded Value by Nationality (QR Million) Source: Qatar Stock Exchange (QSE) Source: Qatar Stock Exchange (QSE) 6.5% 4.3% 3.1% 3.0% 1.7% 0.0% 3.0% 6.0% 9.0% Al Ahli Bank Qatar Cinema & Film Distribution QNB Group Qatar Electricity and Water Industries Qatar -3.8% -3.3% -2.5% -1.9% -1.7% -6.0% -4.0% -2.0% 0.0% Ezdan Real Estate Widam Food Co. Dlala Holding MasrafAl Rayan Gulf International Services 230.0 148.1 103.2 99.4 94.8 0.0 90.0 180.0 270.0 QNB Group Barwa Real Estate Gulf International Services Ezdan Real Estate Masraf Al Rayan 5.6 2.8 2.1 2.1 1.5 0.0 2.0 4.0 6.0 Ezdan Real Estate Barwa Real Estate Vodafone Qatar Masraf Al Rayan Salam International Investment 0% 20% 40% 60% 80% 100% Buy Sell 29.14% 44.58% 21.78% 8.85% 14.06% 12.04% 35.02% 34.54% Qatari Individuals Qatari Institutions Non-Qatari Individuals Non-Qatari Institutions 671 647 704 614 (33) 33 (200) - 200 400 600 800 Qatari Non-Qatari Net Investment Total Sold Total Bought
- 4. Page 4 of 6 TECHNICAL ANALYSIS OF THE QSE INDEX Source: Bloomberg Although it was volatile over the past week, the QSE Index dropped by 0.10% this week vs. the previous one. Volumes dropped and the market has been trading sideways in the past five weeks. Technical Indicators are flat and we reiterate the support and resistance level between 11,800 and 12,600, respectively. DEFINITIONS OF KEY TERMS USED IN TECHNICAL ANALYSIS RSI (Relative Strength Index) indicator – RSI is a momentum oscillator that measures the speed and change of price movements. The RSI oscillates between 0 to 100. The index is deemed to be overbought once the RSI approaches the 70 level, indicating that a correction is likely. On the other hand, if the RSI approaches 30, it is an indication that the index may be getting oversold and therefore likely to bounce back. MACD (Moving Average Convergence Divergence) indicator – The indicator consists of the MACD line and a signal line. The divergence or the convergence of the MACD line with the signal line indicates the strength in the momentum during the uptrend or downtrend, as the case may be. When the MACD crosses the signal line from below and trades above it, it gives a positive indication. The reverse is the situation for a bearish trend. Candlestick chart – A candlestick chart is a price chart that displays the high, low, open, and close for a security. The ‘body’ of the chart is portion between the open and close price, while the high and low intraday movements form the ‘shadow’. The candlestick may represent any time frame. We use a one-day candlestick chart (every candlestick represents one trading day) in our analysis. Doji candlestick pattern – A Doji candlestick is formed when a security's open and close are practically equal. The pattern indicates indecisiveness, and based on preceding price actions and future confirmation, may indicate a bullish or bearish trend reversal. Shooting Star/Inverted Hammer candlestick patterns – These candlestick patterns have a small real body (open price and close price are near to each other), and a long upper shadow (large intraday movement on the upside). The Shooting Star is a bearish reversal pattern that forms after a rally. The Inverted Hammer looks exactly like a Shooting Star, but forms after a downtrend. Inverted Hammers represent a potential bullish trend reversal.
- 5. Page 5 of 6 Source: Bloomberg Company Name Price (July 02) % Change 5- Day % Change YTD Market Cap. QR Million TTM P/E P/B Div. Yield Qatar National Bank 191.00 3.08 (10.29) 133,648 12.5 2.5 3.9 Qatar Islamic Bank 107.00 0.28 4.70 25,283 15.3 2.4 4.0 Commercial Bank of Qatar 54.50 (0.91) (12.48) 17,801 9.9 1.1 5.8 Doha Bank 53.00 (0.56) (7.02) 13,694 9.9 1.3 7.5 Al Ahli Bank 49.00 6.52 (1.28) 8,904 14.4 2.2 2.8 Qatar International Islamic Bank 80.30 0.38 (1.71) 12,155 14.6 2.4 5.0 Masraf Al Rayan 45.90 (1.92) 3.85 34,425 16.5 3.3 3.8 Al Khaliji Bank 22.50 0.00 2.04 8,100 13.5 1.4 4.4 National Leasing 20.99 (0.05) 4.95 1,039 37.5 0.9 4.0 Dlala Holding 27.10 (2.52) (18.95) 770 13.7 2.6 N/A Qatar & Oman Investment 16.20 (0.12) 5.19 510 16.6 1.5 4.9 Islamic Holding Group 139.50 1.23 12.05 558 33.7 9.4 2.2 Banking and Financial Services 256,888 Zad Holding 99.10 (0.90) 17.98 1,296 11.7 1.6 4.0 Qatar German Co. for Medical Devices 16.36 (0.85) 61.18 189 N/A 1.2 N/A Salam International Investment 13.99 (0.57) (11.74) 1,599 20.0 1.0 4.3 Medicare Group 185.60 (0.80) 58.63 5,224 26.6 6.3 1.0 Qatar Cinema & Film Distribution 43.40 4.33 8.50 273 21.9 1.9 2.1 Qatar Fuel 172.10 0.17 (15.76) 14,535 12.7 2.4 5.2 Qatar Meat and Livestock 62.00 (3.28) 2.65 1,116 20.7 4.3 4.0 Al Meera Consumer Goods 253.00 (0.86) 26.50 5,060 22.0 4.0 3.6 Consumer Goods and Services 29,292 Qatar Industrial Manufacturing 46.95 (0.11) 8.30 2,231 14.5 1.6 6.4 Qatar National Cement 120.50 0.17 0.42 6,508 15.6 2.6 3.0 Industries Qatar 142.70 1.71 (15.06) 86,334 15.1 2.9 4.9 Qatari Investors Group 54.00 0.00 30.43 6,714 29.0 3.0 1.4 Qatar Electricity and Water 227.90 2.98 21.55 25,069 15.4 4.0 3.3 Mannai Corp. 111.30 (0.63) 2.11 5,077 9.4 2.5 5.4 Aamal 15.00 (1.32) 3.69 9,450 16.0 1.4 6.3 Gulf International Services 79.40 (1.73) (18.23) 14,756 9.4 4.2 6.9 Mesaieed Petrochemical Holding 24.08 (0.25) -18.4 30,252 20.9 2.3 4.6 Industrials 186,391 Qatar Insurance 97.00 0.10 23.12 17,908 18.2 3.1 2.2 Doha Insurance 26.50 0.00 (8.62) 1,325 12.2 1.3 3.8 Qatar General Insurance & Reinsurance 56.00 0.00 9.15 4,455 4.9 0.8 3.1 Al Khaleej Takaful Insurance 42.90 0.23 (2.88) 1,095 14.7 1.7 3.0 Qatar Islamic Insurance 82.20 (0.48) 4.05 1,233 14.7 4.3 4.9 Insurance 26,016 United Development 24.85 0.85 5.34 8,799 16.3 0.8 5.0 Barw a Real Estate 52.40 (0.76) 25.06 20,390 3.5 1.1 4.2 Ezdan Real Estate 17.80 (3.78) 19.30 47,214 33.1 1.6 2.2 Mazaya Qatar Real Estate Development 18.78 (1.16) 2.97 1,972 11.4 1.5 1.5 Real Estate 78,376 Qatar Telecom 85.20 0.00 (31.23) 27,291 15.6 1.3 4.7 Vodafone Qatar 16.46 (1.73) 0.06 13,915 N/A 2.5 1.3 Telecoms 41,207 Qatar Navigation (Milaha) 97.80 0.51 (1.71) 11,201 10.5 0.9 5.6 Gulf Warehousing 75.50 (0.66) 33.87 3,591 23.7 4.3 2.0 Qatar Gas Transport (Nakilat) 22.20 (0.89) (3.90) 12,432 13.5 4.2 5.4 Transportation 27,223 Qatar Exchange 645,392
- 6. Contacts Saugata Sarkar Sahbi Kasraoui QNB Financial Services SPC Head of Research Head of HNI Contact Center: (+974) 4476 6666 Tel: (+974) 4476 6534 Tel: (+974) 4476 6544 PO Box 24025 saugata.sarkar@qnbfs.com.qa sahbi.alkasraoui@qnbfs.com.qa Doha, Qatar Disclaimer and Copyright Notice: This publication has been prepared by QNB Financial Services SPC (“QNBFS”) a wholly-owned subsidiary of QNB SAQ (“QNB”). QNBFS is regulated by the Qatar Financial Markets Authority and the Qatar Exchange QNB SAQ is regulated by the Qatar Central Bank. This publication expresses the views and opinions of QNBFS at a given time only. It is not an offer, promotion or recommendation to buy or sell securities or other investments, nor is it intended to constitute legal, tax, accounting, or financial advice. QNBFS accepts no liability whatsoever for any direct or indirect losses arising from use of this report. Any investment decision should depend on the individual circumstances of the investor and be based on specifically engaged investment advice. We therefore strongly advise potential investors to seek independent professional advice before making any investment decision. Although the information in this report has been obtained from sources that QNBFS believes to be reliable, we have not independently verified such information and it may not be accurate or complete. QNBFS does not make any representations or warranties as to the accuracy and completeness of the information it may contain, and declines any liability in that respect. For reports dealing with Technical Analysis, expressed opinions and/or recommendations may be different or contrary to the opinions/recommendations of QNBFS Fundamental Research as a result of depending solely on the historical technical data (price and volume). QNBFS reserves the right to amend the views and opinions expressed in this publication at any time. It may also express viewpoints or make investment decisions that differ significantly from, or even contradict, the views and opinions included in this report. This report may not be reproduced in whole or in part without permission from QNBFS COPYRIGHT: No part of this document may be reproduced without the explicit written permission of QNBFS. Page 6 of 6