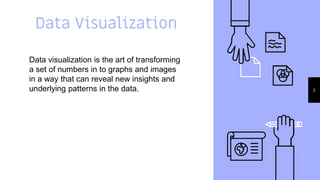
VISUALIZING
DATA
HELLO!
I am Rohit Kar. I am
a Electrical
Engineering student
You can find me at
rohit.kar96@gmail.com
2
Data Visualization
Data visualization is the art of transforming
a set of numbers in to graphs and images
in a way that can reveal new insights and
underlying patterns in the data. 3
4
“
The greatest value of a picture
is when it forces us to notice
what we never expected to see.
-John
W. Turkey
5
Why Visualize Data
▹ Numbers are hard to understand
▹ Pictures and graphs are easier to understand
and interpret
▹ Gives us new insight
▹ Reveals underlying patterns that would not
have been possible to see without data
visualization
6
DATA IS THE NEW
SOIL 7
Eye is sensitive to
patterns is
variations in colour,
shape, size
TWO KEY INSIGHTS
Relative data can
give us fuller
pictures. It can
lead to change
our perspective
in the right
direction.
8
Analyzing using our eye
9
We can understand data better when we
see a graphic representation of the data
instead of the numbers. The eye is
sensitive to variations in colour, shape,
patterns; all these gives us unconscious
insight into the data. The language of the
eye and the language of the brain; which
is numbers and concepts; together
combined gives deep meaningful insight
into the data.
Relative Datasets
10
● No one set of data can give us the full
picture.
● It can often lead us into the wrong
direction
● Comparing two similar data sets can
lead us to the fuller picture.
● Relative data can give us the right
insight
HOW CAN
MANAGERS USE
THIS INSIGHT?
11
Visualizations
▹ Managers should realize the importance of data
visualizations.
▹ Data visualizations can make it easier to
analyze the data
▹ Managers should spend time and resources to
visualize data in a creative way.
12
The Full Picture
▹ People might be mislead if they only
analyze only a particular data
▹ Other data sets must be analysed
also
▹ Relative data can reveal the bigger
picture
▹ Managers can make the proper
decision when they have the full
picture
13
Closing Off
Visualizing data in an elegant way is often times hard
and frustrating. It takes time and resources to scrap the
data from the internet, clean the data, organize the data
and then plot it on a graph. This takes considerable time
and effort. But this as enormous benefits and lead to
deeper insights that were previously not available. So
every company should invest in data visualizations!!
14
THANKS!
15

Week2 day1slide

  • 1.
  • 2.
    HELLO! I am RohitKar. I am a Electrical Engineering student You can find me at rohit.kar96@gmail.com 2
  • 3.
    Data Visualization Data visualizationis the art of transforming a set of numbers in to graphs and images in a way that can reveal new insights and underlying patterns in the data. 3
  • 4.
  • 5.
    “ The greatest valueof a picture is when it forces us to notice what we never expected to see. -John W. Turkey 5
  • 6.
    Why Visualize Data ▹Numbers are hard to understand ▹ Pictures and graphs are easier to understand and interpret ▹ Gives us new insight ▹ Reveals underlying patterns that would not have been possible to see without data visualization 6
  • 7.
    DATA IS THENEW SOIL 7
  • 8.
    Eye is sensitiveto patterns is variations in colour, shape, size TWO KEY INSIGHTS Relative data can give us fuller pictures. It can lead to change our perspective in the right direction. 8
  • 9.
    Analyzing using oureye 9 We can understand data better when we see a graphic representation of the data instead of the numbers. The eye is sensitive to variations in colour, shape, patterns; all these gives us unconscious insight into the data. The language of the eye and the language of the brain; which is numbers and concepts; together combined gives deep meaningful insight into the data.
  • 10.
    Relative Datasets 10 ● Noone set of data can give us the full picture. ● It can often lead us into the wrong direction ● Comparing two similar data sets can lead us to the fuller picture. ● Relative data can give us the right insight
  • 11.
  • 12.
    Visualizations ▹ Managers shouldrealize the importance of data visualizations. ▹ Data visualizations can make it easier to analyze the data ▹ Managers should spend time and resources to visualize data in a creative way. 12
  • 13.
    The Full Picture ▹People might be mislead if they only analyze only a particular data ▹ Other data sets must be analysed also ▹ Relative data can reveal the bigger picture ▹ Managers can make the proper decision when they have the full picture 13
  • 14.
    Closing Off Visualizing datain an elegant way is often times hard and frustrating. It takes time and resources to scrap the data from the internet, clean the data, organize the data and then plot it on a graph. This takes considerable time and effort. But this as enormous benefits and lead to deeper insights that were previously not available. So every company should invest in data visualizations!! 14
  • 15.