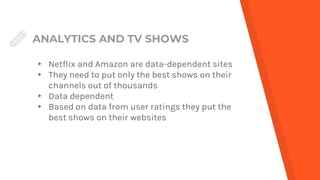
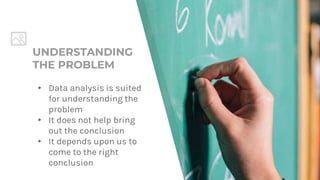
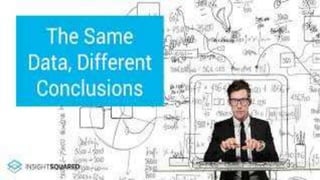
Data analysis is useful for understanding problems by taking them apart, but it does not always produce optimal solutions or point directly to conclusions. Managers should use data to understand issues but not rely too heavily on it, as data can sometimes mislead or be faulty. While services like Netflix use data to select the best shows, data analysis requires human judgment to bring different solutions together and make the right decisions.
‘Tis Better To Be Effective Than EfficientSynerzip
Outcome vs. Output Focus for Software Teams
Join Kent McDonald to explore the difference between efficiency and effectiveness and learn three simple, yet powerful, techniques that he has found can help teams be more effective. You’ll learn how to:
Build a shared understanding of the problem you are trying to solve
Establish clear guard rails for distributed decision making
Measure progress based on outcome, not output
Along the way he’ll share stories about how he has used these techniques and help you figure out when these techniques may work in your situation.
You may be able to get faster and cheaper with efficiency, but in order to get better outcomes, you need to be effective.
Predictability: No Magic Required - LeanKit Webinar (June 2017)Julia Wester
Knowledge work tends to be variable in nature and involves cross-functional teams collaborating on each step of the process. This makes project delivery hard to predict as work may be held up due to unforeseen blockers, hand-off delays, or approval cycles taking longer than expected.
In this webinar, I’ll provide guidance around choices you can make that impact your ability to meet your commitments with confidence.
You'll learn how to predict the cycle time of work before it's finished. I will also explain the basics of queuing theory, and the relationship between queue size, capacity utilization, and cycle times. Armed with this insight, you'll be able to:
* Monitor your workflow for leading predictability indicators.
* Make informed choices to maximize your value throughput.
* Forecast delivery with better accuracy using LeanKit data and analytics.
There's no magic required in achieving predictable delivery. The secret is using past performance data to predict future behavior.
Taming the Chaos: Beyond the Quick WinsJulia Wester
Your team started using Kanban boards and visualizing your work a while back and, though everyone is happy about the increased visibility, your team is nowhere near the utopia other teams say they’ve achieved. Even worse, you don’t know why or how to get there!
Many teams hit this same plateau and stop, falling tragically short of the value that can be achieved with deeper Kanban implementations. This presentation shares tangible steps to take to help transform shallow kanban implementations into systems focused on flow and continuous improvement.
How to Get More Value from Your Social DataAnna OBrien
Creating a meaningful insight is similar to baking a cake, with out the write ingredients, proper recipe, and something bake the batter- you'll struggle to produce something people want to consume. This deck explores at a high level how to work with data at each stage of the process. It is meant for anyone working with data- from savants to noobs.
Webinar Presentation: Keys to Executing as PromisedgetSayDo
How can businesses more effectively "Execute as Promised" through their organization? After this topic created ongoing discussion at a local event, we opened it up to broader webinars. Issues covered include: Employee-Customer Alignment, Messaging Clarity, and Managing Expectations.
From Data to Insight: Uncovering the 'Aha' Moments That MatterQualtrics
Everyone talks about big data; we talk about fast data. Specifically, what you can do to turn data into insight and insight into action at every level of your organization.
Join Dr. David Rock, Director of the NeuroLeadership Institute and Qualtrics CEO, Ryan Smith, as they share their expertise moving from data collection to actionable insight. When you use insights to tell a compelling story, change happens. They’ll share the latest research on how people process information and make decisions. You’ll leave with key takeaways on how to maximize the impact of any data story.
Karla Rivershaw, head of marketing, Turtl
Visit the CharityComms website to view slides from past events, see what events we have coming up and to check out what else we do: www.charitycomms.org.uk
This presentation contains the key ideas from the article "Simplify your analytics strategy" by Narendra Mulani published in HBR. This presentation is a part of my internship under Prof. Sameer Mathur, IIM-L
Converting physical customer meetings into virtual meetings that achieve the same or better effect requires more than a teleconferencing solution. Sales reps and account managers need to fundamentally rethink their interactions, and Marketing needs to be empowered to support the new way of working.
The virtual sales experience is the new battlefield. What separates the winners from the rest is their ability to embed value in every interaction with customers and truly engage with them in the digital field.
Survey kiosk, smiley feedback with a Celpax Rebecca Lundin
A survey kiosk with smileys to measure employee engagement. A tool for managers that want to improve their workplace, hands-on.
Your 1st is free (1max per company)
The Celpax data shows if your improvements are working:
1. Employees press green or red to answer “How was your day?” when the shift ends
2. The online dashboard shows hourly, daily, weekly and monthly results
3. Fix something red! Check the data to see if it worked :)
Taming the Chaos: Beyond the Quick WinsJulia Wester
So, your team uses visual boards and everyone loves the quick wins gained through increased visibility. But, you’re nowhere near the utopia you read about in the books or hear about at conferences. Even worse, you don’t know why or how to get there!
Many teams hit this same plateau and become stagnant, falling tragically short of the value that can be achieved with a system focused on flow. Come learn tangible steps to transform shallow visual systems into systems focused on getting results through flow and continuous improvement.
Robert Kaplan of Harvard University clearly states: “If you can’t measure it you can’t manage it, and if you can’t manage it you can’t change it.” A simple translation of this sentence is: in order to improve something it needs to be measurable. The intangibles of Leadership, Communication and Teamwork are key organizational drivers that are not frequently measured. According to the previous theory, that means that these fundamental building blocks of your organization are not being managed or improved.
In this webinar, I’ll show you how to choose the right metrics to measure your team’s effectiveness and encourage the right behaviors. Then, I’ll explain how metric-driven coaching can help teams understand their process and highlight areas for improvement.
Watch the webinar here: http://leankit.com/blog/2016/03/metric-driven-coaching/
Where to focus the efforts in the consulting sourcing process?Helene LAFFITTE
The process of sourcing consulting services consists of seven steps. But they are not equal in terms of value creation. Where should you focus to get the most value out of the process?
How do you scale from 0 to 100,000 stores? par Siavash Ghorbani TheFamily
How can you act when your company quickly grows from 0 to 100,000 stores?
How do you handle problematics such as recruiting, entreprise culture or tech?
Siavash Ghorbani, CTO of Tictail will give a behind the scenes tour of the organizational growth that embraces the autonomy and entrepreneurship that appeals to talented engineers.
Inscrivez-vous aux prochains workshops! — http://www.meetup.com/fr/StartupWorkshop/
Pour ne pas rater les prochains évènements, c'est ici : http://www.thefamily.co/education/
Data analytics for the mid-market: myth vs. realityDeloitte Canada
Every mid-market company has data. Data that offers insight to help solve the business issues that matter most.
So why have so few mid-market companies taken the first step? Lack of comfort? Unclear outcomes? Not sure where to start? Analytics helps mid-market companies make smarter business decisions leading to increased productivity, profitability and competitiveness.
Dispel the myths. Recognize the possibilities. Squeeze more out of your data.
WiDS - Unleashing the promises of big dataYara Jubran
Due to the rapid development of information and computer technologies, nowadays we can generate, store and process big data more than ever. Consequently, organizations can benefit from this significant development as it allows them to have more data at their disposal. However, for organizations to benefit from available data, the data must be processed, extracted and converted into useful information that may lead to taking informed decision. Yet, this is easier said than done.
While there is a shared understanding of big data’s power and importance, many fail to perceive the actionable steps and resources required to utilize it effectively. And this lack of strategic planning -which enables us to optimally use big data and take faster evidence-informed decisions- is one of the major impediments to successful completion of big data projects and initiatives.
The aim of this presentation is setting out a roadmap to simplify the shift onto the big data journey for businesses by answering ‘How to unleash the promises of big data within an organization?’ It will address the key factors to decode big data successfully and suggests a set of main steps to do it. The key steps are drawn from multiple domains and case studies that are each deemed to constitute the strategic plan.
The secret to measuring employee communicationDavis & Company
Have you put off measuring the effectiveness of your employee communication program because doing so is time-consuming, expensive or—most frightening of all—mathematical? Measuring employee communication can feel like a nearly impossible task, but it can help position you as the internal communication expert. So, take a few minutes to discover 10 secrets to overcome obstacles and establish new approaches.
Framework for creating Analytics that delivers cost effective Value. From what to output, to how to scale and motivate a team, passing through data acquisition. Analytics has become a critical asset for the most competitive organizations; practitioners must ensure their ability to create and communicate insight, especially the most senior decision-makers is effective and efficient.
How to Rock Your Next Presentation in 7 Easy StepsHeather Luczak
Presenting is all about communicating.Your audience will forget almost everything you tell them, so make sure your message is targeted, supports your objective, and helps drive your primary message home. Use the tips to help make sure your next presentation hits its mark.
Deep Neural Networks (DNN), or simply Deep Learning (DL), took Artificial Intelligence (AI) by storm and have infiltrated into business at an unprecedented rate. Access to vast amounts of data, recently made available by the Big Data revolution, extensive computational power and a new wave of efficient learning algorithms, helped Artificial Neural Networks to achieve state-of-the-art results in almost all AI challenges.
The implications of DL supported AI in business is tremendous, shaking to the foundations many industries. However, incorporating this technology in established business is far from obvious: cultural inertia in organizations, lack of transparency in most DL models and the complexity in training these models are some of the issues that will be addressed.
mtpcon London+EMEA 2022 – Why Product Managers should not be data-driven.pdfJens-Fabian Goetzmann
Product managers today have access to detailed data and analytics around how their product is being used. This has led to the rise of the "data-driven product manager" who bases their decisions on data as much as possible. In this talk, Jens explains why that is a trap, and what to do instead.
Data Leadership - Stop Talking About Data and Start Making an Impact!DATAVERSITY
<!-- wp:paragraph -->
<p>For any organization to be successful, whatever we do with data must connect to meaningful business improvements—and those must be measured. If current data efforts lack results or accountability, then Data Leadership is our answer.</p>
<!-- /wp:paragraph -->
<!-- wp:paragraph -->
<p>But Data Leadership isn’t really about the data at all. What makes Data Leadership so powerful is its ability to completely transform organizations. Going beyond traditional data management and governance, Data Leadership builds momentum and delivers the change we’ve long known our businesses need. Data Leadership helps us overcome the lingering data challenges our legacy approaches never will.</p>
<!-- /wp:paragraph -->
<!-- wp:paragraph -->
<p>This webinar will cover the key concepts of Data Leadership, and what anybody can do to start making a bigger impact for their teams and businesses. Whether your role today is large or small, Data Leadership will be essential to your future data success! </p>
<!-- /wp:paragraph -->
<!-- wp:paragraph -->
<p>Key Learnings Include:</p>
<!-- /wp:paragraph -->
<!-- wp:list -->
<ul><li>What Data Value really is, and why creating it is the goal of everything we do with data</li><li>Introduction to the Data Leadership Framework</li><li>Why Data Leadership is fundamentally about balance</li><li>How to immediately start making a Data Leadership impact in your organization</li></ul>
<!-- /wp:list -->
A lot of companies make the mistake of thinking that just hiring Data Scientists will lead to increased revenue or increased profit. For a company’s investment in Data Science to be successful the Data Scientists need to work on the right problems, with the right people, and with the right tools. In this presentation, I will talk about the lessons I have learned, and mistakes made in applying Data Science in commercial settings over the last 10 years. I will highlight what processes can increase the chances of Data Science investment being successful.
The problem of hiring the data scientist and how difficult it sometimes is to hire the right data scientist and what steps a manager can take to overcome this
Levelwise PageRank with Loop-Based Dead End Handling Strategy : SHORT REPORT ...Subhajit Sahu
Abstract — Levelwise PageRank is an alternative method of PageRank computation which decomposes the input graph into a directed acyclic block-graph of strongly connected components, and processes them in topological order, one level at a time. This enables calculation for ranks in a distributed fashion without per-iteration communication, unlike the standard method where all vertices are processed in each iteration. It however comes with a precondition of the absence of dead ends in the input graph. Here, the native non-distributed performance of Levelwise PageRank was compared against Monolithic PageRank on a CPU as well as a GPU. To ensure a fair comparison, Monolithic PageRank was also performed on a graph where vertices were split by components. Results indicate that Levelwise PageRank is about as fast as Monolithic PageRank on the CPU, but quite a bit slower on the GPU. Slowdown on the GPU is likely caused by a large submission of small workloads, and expected to be non-issue when the computation is performed on massive graphs.
Adjusting primitives for graph : SHORT REPORT / NOTESSubhajit Sahu
Graph algorithms, like PageRank Compressed Sparse Row (CSR) is an adjacency-list based graph representation that is
Multiply with different modes (map)
1. Performance of sequential execution based vs OpenMP based vector multiply.
2. Comparing various launch configs for CUDA based vector multiply.
Sum with different storage types (reduce)
1. Performance of vector element sum using float vs bfloat16 as the storage type.
Sum with different modes (reduce)
1. Performance of sequential execution based vs OpenMP based vector element sum.
2. Performance of memcpy vs in-place based CUDA based vector element sum.
3. Comparing various launch configs for CUDA based vector element sum (memcpy).
4. Comparing various launch configs for CUDA based vector element sum (in-place).
Sum with in-place strategies of CUDA mode (reduce)
1. Comparing various launch configs for CUDA based vector element sum (in-place).
Techniques to optimize the pagerank algorithm usually fall in two categories. One is to try reducing the work per iteration, and the other is to try reducing the number of iterations. These goals are often at odds with one another. Skipping computation on vertices which have already converged has the potential to save iteration time. Skipping in-identical vertices, with the same in-links, helps reduce duplicate computations and thus could help reduce iteration time. Road networks often have chains which can be short-circuited before pagerank computation to improve performance. Final ranks of chain nodes can be easily calculated. This could reduce both the iteration time, and the number of iterations. If a graph has no dangling nodes, pagerank of each strongly connected component can be computed in topological order. This could help reduce the iteration time, no. of iterations, and also enable multi-iteration concurrency in pagerank computation. The combination of all of the above methods is the STICD algorithm. [sticd] For dynamic graphs, unchanged components whose ranks are unaffected can be skipped altogether.
6. ANALYTICS AND TV SHOWS
▸ Netflix and Amazon are data-dependent sites
▸ They need to put only the best shows on their
channels out of thousands
▸ Data dependent
▸ Based on data from user ratings they put the
best shows on their websites
8. Data Analysis does
not always produce
optimum results
TWO KEY INSIGHTS
Data Analysis is
only suited for
taking a problem
apart and
understanding it.
9. OPTIMAL SOLUTION
▸ Data analysis does not always produce optimum results
▸ Sometimes the data can mislead into making the wrong
choice
▸ Faulty data can often make the analysis useless
10. UNDERSTANDING
THE PROBLEM
▸ Data analysis is suited
for understanding the
problem
▸ It does not help bring
out the conclusion
▸ It depends upon us to
come to the right
conclusion
13. RELYING ON DATA
● Managers should not rely too much on data
● They should understand the extent of usefulness of
data
● Too much reliance on data can lead to wrong
decision making
14. UNDERSTANDING THE
PROBLEM
● The tools of data analysis should be used to understand
the problem
● Data helps to break down a problem and understand it
● But data does not help bring the different solutions
together
● Managers come into play at this point
● Managers should use their domain knowledge to come
to the proper conclusions
15. CLOSING OFF
Data analysis is a powerful tool of the 21st century. We are
becoming more and more data dependent. With that we
should also realise the extent to which data takes us to the
solution. Data does not give us the solution to a problem.
But it helps us understand the problem. It fall upon us to
draw the right conclusion