Download to read offline
![SHORT-TERM DATA LOGGING TO IDENTIFY LOW-COST/NO-COST OPPORTUNITIES
FOR IMPROVING ENERGY EFFICIENCY
Tom White, P.E., CEM; Chief Engineer, Green Building Initiative
Ken Anderson, P.E.; Principal, The Energy Gleaners
Paul Williamson, EMC; Principal, Planwest Partners
Kevin Stover, P.E.; Commercial Programs Consultant, Green Building Initiative
ABSTRACT
The objective of energy auditing is to uncover opportunities for
improving energy efficiency at a facility and to collect
information useful for estimating potential savings from selected
energy efficiency measures (EEMs). This paper describes an
approach for using data loggers and hand-held instruments to
record key operating parameters of energy using equipment.
The emphasis is on: (1) inventorying energy systems;
(2) identifying key operating variables to be measured (what
short-term data to collect); (3) specifying data collection points
(for where and how to instrument or monitor a system);
(4) analyzing the data and apportioning annual energy by end
uses; and (5) estimating the energy savings that can be attributed
to low-cost/no-cost EEMs, which subsequently can be
implemented as a result of the auditing, data collection, and
analysis. An example of calculating energy savings for a
compressed air system, using this five-step approach, is reviewed.
OVERVIEW: ENERGY AUDITING TO IDENTIFY
ENERGY EFFICIENCY OPPORTUNITIES
The Green Building Initiative (GBI) in Portland, Oregon is the
licensed developer of the Green Globes ™ rating system in the
United States. The Green Globes environmental criteria used for
certifying sustainable commercial buildings are based on best-
practices in seven key areas: integrated project management and
design, site development, energy efficiency, water use, materials
selection, indoor environmental quality, and reduced emissions.
Although a building’s architecture and engineered systems are the
basis for a sustainable design, the performance of a building is
highly dependent on how the building is operated. This principle
of managing operations to achieve high performance is especially
true for energy systems.
Quoting a common business aphorism, “You can’t improve what
you don’t measure,” gets right to the point of this paper. Without
knowing how energy systems are actually performing, it’s not
possible to determine the relative impact any remedial action
might have for improving a system’s energy efficiency. This
paper takes a practical, first-hand look at how to collect key
operating information and evaluate the performance of common
energy systems in buildings.
With measured results in hand, energy analysts can determine
reasonable estimates of energy savings that can be attributed to
applied energy efficiency measures (EEMs). Once the challenge
of data collection and analysis has been addressed, the
implementation of recommended no-cost/low-cost measures to
realize energy savings can be passed on to the building owners or
managers to take corrective action.
Energy-efficient systems, left by themselves, cannot be expected
to generate energy savings. These systems have to be managed –
by adjusting set points, reversing operation overrides, re-
commissioning equipment and sequences of operation,
implementing preventive maintenance to avert performance drift
or degradation, and committing to a host of other follow-through
operations and management (O&M) activities that help ensure
energy-efficient performance. Research from a number of studies
[1] suggests that active O&M and occupant behavior practices
can alter energy use significantly, resulting in savings in the range
of 5% to 15%. What’s even better, such improvement strategies
can most often be implemented for little or no cost.
A general approach for realizing energy savings can be
summarized as a sequence of seven steps, outlined by asking the
following key questions:
1. Where is energy being used in my facility? [taking an
inventory]
2. What data do I collect to characterize how my systems are
operating? [depends on the system]
3. How do I measure these data? [using short-term
logging/data collection methods and tools]
4. How do I analyze the collected data to estimate annual
energy end use? [system-specificexamples are explained]
5. What kind of energy efficiency measures (EEMs) can be
applied to thesesystems?
6. How do I calculate energy savings from the proposed
EEMs?](https://image.slidesharecdn.com/677a1d81-42cc-4230-b32b-cd1a263db4d3-150511011813-lva1-app6892/85/WEEC_White-Anderson_01OCT2014-FINAL-1-320.jpg)
![7. What are thefinancial criteria for selecting no-cost/low-
cost EEMs for improving energy efficiency?
Of course, answers to these questions depend on the energy
systems in use at a given site. The overriding question comes
down to this: What kind of short-term data can I collect, on which
systems, and how would I analyze this data to estimate energy
savings that are possible from low-cost/no-cost EEMs?
Levels of energy auditing – different emphasis, different
outcomes
Energy auditing is the practice of assessing how energy is used at
a site, for the purpose of identifying opportunities for eliminating
waste and improving energy-efficient operation. ASHRAE
describes three levels of energy audits [2], which are successive
levels of energy use investigation summarized as follows:
Level I – A walk-thru of the building and its systems, gathering
information that can be collected mainly by observation and spot
measurements, such as ambient space temperatures, lighting
levels, or inches of duct or pipe insulation. No detailed
measurement or analyses are involved. Recommended EEMs are
based on what is apparent and can be readily adjusted or fixed,
such as: lighting levels too high, windows or doors not closing or
left open, dampers rusted shut, valves stuck, inadequate pipe and
duct insulation, space temperatures too high/too low, or systems
operating when not needed.
Level II – A higher-level effort to collect data for characterizing
system operations and for identifying potential EEMs and
corresponding savings. For example: temperature, pressure, and
flow data for assessing whether air or water systems are operating
within design; voltage, amp, and power factor to characterize
motor performance; exhaust gas analysis to determine boiler
operating efficiency; lighting schedules and switching controls to
evaluate whether lighting meets or exceeds occupant needs.
A key objective of a Level II audit might be to complete an
estimate and apportioning of the building’s annual kWh and
therm usage split out by end uses – heating, cooling, lighting, hot
water, fans and pumps, ventilation, and plug loads. Level II
results are often the basis for determining what systems might
warrant a Level III audit.
Level III – Often referred to as an “investment grade audit,” this
level of audit implies full characterization of major energy
systems such as boilers or chillers, over a range of operating
conditions. The purpose is to learn, with some accuracy and
confidence, what the energy use differences would be if you were
to spend a lot of money to swap out the current system or its
major components with expensive new or refurbished equipment.
For example, an investment grade audit (Level III) might be
carried out to derive a part load performance curve for an existing
chiller, and corresponding kW/ton efficiency at each operating
point. Using life-cycle costing and engineering analysis, the
performance results and operating costs of this chiller would be
compared to a replacement chiller, figuring out the kW/ton
differences and the expected energy savings over the life of the
system. From these results, you’d get a rate of return (ROI) for an
investment.
One emphasis of a Level III audit might be to collect enough
building operations and control data to inform a building energy
model to the extent that the “tuned” model accurately represents
that actual building performance. Once the building model has
been calibrated with Level III data, the model can be run with any
“what if” scenario, allowing analysts to look are realistic energy
use profiles of individual systems.
DATA COLLECTION – LOGGING, METERING,
MONITORING
The terms data collection, logging, metering, and monitoring are
often bandied about interchangeably.
Metering and monitoring are often used synonymously, with the
difference being that metering uses instruments to measure data
elements whereas monitoring implies a broader effort to collect,
but also especially, measure key performance information.
Metering implies measurement of a quantity such as gallons,
kWh, Btus or CFM and the data is a snapshot at a given moment.
Monitoring is a generic term for tracking any energy use on any
scale, perhaps to compare results against an objective. For
example, energy use monitoring could mean to gather and review
kWh and therms from monthly utility bills and evaluate whether
the totals are within range of an expected value.
Logging is a term that spans both quantitative measurements of
operational data, but also accounts for key parameters such as
how frequently a compressor engages or lights turn on and off.
Logging also implies collection of data over time rather than a
one-time measurement.
Data collection covers the gamut of all kinds of information
gathered by multiple means – values from monthly utility meters
for gas, water, electricity; number of times a compressor motor
starts and stops in a given interval, the pressures at different
points in a piping system; a histogram of the range of responses
from building occupants on a thermal comfort survey. The
variation in the types and frequency, and the degree of resolution
and different methods of data collection, vary widely. The key
question would be: What systems do you want to evaluate and
what are the operating parameters that define the system’s
performance?
For example, say you want to determine the energy use of a
pump. In this case, you would measure the pressure difference
across the pump (head), its RPM, the voltage and current to the
motor (multiple legs if the motor is more than one phase), and the
power factor. With this data, you can plot the operating
conditions of the pump using the manufacturer’s pump curves
and determine pump efficiency, gpm, and kW. With additional
information about pump ON-OFF cycling times you can create
and operational profile and then calculate cumulative energy use.
If the pump cycles are intermittent or the pump operates at
different RPMs, the calculation of aggregate energy use can be a
little more complicated. But, typical use patterns, logged over
short periods of time, give you a basis for aggregating total
energy.
If adding a VFD to a pump motor is an energy-efficiency option,
you can use affinity laws or more exacting power calculations to
determine energy savings at different RPMs or gpm flows, head
pressures, and kW levels.
Another example of short term system measurements might be in
evaluating the heating and cooling heating capacities (in Btu/hr)
of an air handler, at different air delivery rates, and at various
cooling and heating coil temperatures and flows. Your purpose
might be to characterize the system sufficiently to optimize
cooling coil gpm for a given delta-T at varying rates of supply air
CFM delivered. Your objective might be to measure fan and](https://image.slidesharecdn.com/677a1d81-42cc-4230-b32b-cd1a263db4d3-150511011813-lva1-app6892/85/WEEC_White-Anderson_01OCT2014-FINAL-2-320.jpg)

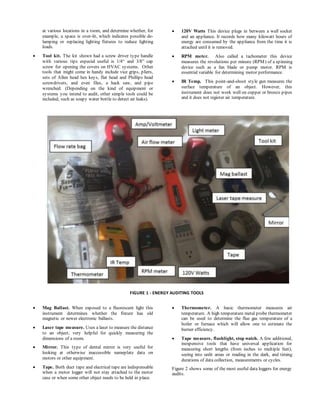
![ Temp/RH/light logger. This instrument has an internal
temperature sensor and relative humidity sensor and a
built-in light meter so it measures and logs these values
over time. It also has one external input that can accept an
external sensor such as a temperature or a current sensor.
4-External channel logger. This instrument has no
internal sensors but has four external inputs to accept
temperature, CO2, current, voltage and other sensors.
5-wrap coil. This home-made coil of wire can be inserted
in-line on one leg of a motor or other electrical power
line. The five wraps when run through a current
transformer will amplify the reading so a 5 Amp current
would read as 25 Amps, making it possible to use an
oversized current transformer (CT) to measure current
flow to a smaller device or motor.
Clamp-on CTs. Also called a split core Current
Transformer, this instrument measures in Amps the
current flowing through a wire inside its loop. One CT is
rated for 20 to 200 Amps. The smaller CT of 100 Amps
can measure a maximum current: if applied to a wire
carrying more than 100 Amps, this unit will register up to
its 100 Amp read-out and stop. For this reason, a low
range CT is only accurate down to 10 Amps. If the subject
current wire runs less than 10 Amps the 5-wrap coil can
be used to register current as low as 2 Amps.
External Temperature Sensor. This device is a
thermistor-type temperature sensor with a 25 foot cable.
It is only good for temperatures in the range of 32°F to
212°F.
Motor ON/OFF Logger. This device detects the
magnetic field of a motor when it is running and uses this
information to record when the motor comes ON and
when it goes OFF.
EXAMPLE OF HOW END-USE METERING
INFORMS ENERGY AUDIT RESULTS
During 2013 – 2014, Ken Anderson and Paul Williams, two of
the authors of this paper, performed a series of energy audits for
several Portland-area buildings under theauspices of the Existing
Buildings Program of the Oregon Energy Trust [4]. An example
from their field work and energy analysis results is presented
here. Thepurposeof the systemcharacterizations was to
establish a baseline of energy use, and to identify energy
efficiency measures that could be applied to reduce utility bills
for the building owner.
FIGURE 2 - Data Monitoring Tools Used in Energy Audits](https://image.slidesharecdn.com/677a1d81-42cc-4230-b32b-cd1a263db4d3-150511011813-lva1-app6892/85/WEEC_White-Anderson_01OCT2014-FINAL-5-320.jpg)
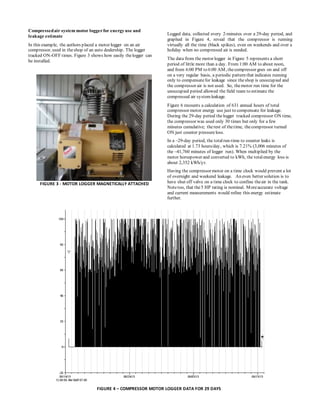
![2 minute intervals fromlogger
41,760 loggerduration,minutes = ~29 days * 24 hr/day* 60 min/hr
3,006 total minutesrunningtocompensate forleaks fromlogger
7.2% runtime of compressorON forleakcompensation = (3006 / 42102)
696 hourscompressorON time,leakcompensation = 41760 min/ (60 min/hr)
29 days,durationof logging fromlogger
1.73 hours/day compressorON tocompensate forleak
= [(696 hr duration/29days) *
7.2%]
631 annual compressorON forleakcompensation,hours = 365 days * 1.73 hr/day
5 HP compressorrating fromcompressornameplate
0.746 kW/HP conversionfactor
2,352 kWh due to leaks, peryear = 631 hr * 5 hp * 0.746 kW/HP
FIGURE 6 – TOTAL COMPRESSOR MOTOR ENERGY USE CALCULATION
FIGURE 5 - DETAILED MOTOR RUN TIME](https://image.slidesharecdn.com/677a1d81-42cc-4230-b32b-cd1a263db4d3-150511011813-lva1-app6892/85/WEEC_White-Anderson_01OCT2014-FINAL-7-320.jpg)
![SUMMARY AND RECOMMENDATIONS
When entering a site to conduct an energy audit, a few important
guidelines are worth keeping mind.
Safety first and always! Many kinds of measurements –
especially those involving electricity or high temperatures
– present serious hazards. No one should attempt auditing
and data collection without proper training and without
wearing appropriate protective clothing.
What to meter and measure. With limited time and
resources, it’s important to focus auditing efforts on
systems that are likely to result in the largest savings.
Accuracy. With instruments, both the measurement range
and accuracy are key factors in collecting useful data.
Instruments must be properly calibrated and the range of
data read-out be selected according to the expected values
to be measured.
Spot checking. You can use spot checks to calibrate
metering sensors for example, measure a known value and
compare it an instrument reading.
Sensor response time. An instrument must have a short
enough response time lag that it can measure a variable
value that is changing rapidly.
Enough data? For any measured parameter, it is
important think through how long to meter and what time
interval to use if sufficient data and resolution is to be
gained.
General rule. The longer you measure, the more useful or
sufficient the results. But, too much data is a waste.
Adjusting for seasonal variation. Weather and other
external variables can significantly affect the performance
of energy systems. It’s important to take into account
seasonal variations when characterizing the performance
of such systems.
Interval duration. Intervals need to be short enough to
capture changes in state that might occur between
measurements.
Data logging multiple variables. When setting up data
logging periods, it’s important to match intervals so that
the data profiles from multiple parameters can be
combined on one graph.
REFERENCES
[1] No-Cost/Low-Cost EEMs – A Guide to Energy Audits
http://www.pnnl.gov/main/publications/external/technical_re
ports/pnnl-20956.pdf
http://www.ecova.com/media/173057/no-cost_low-
cost_conservation_strategies.pdf
[2] ASHRAE levels of audit
http://www.microgrid-solar.com/2010/11/the-difference-
between-ashrae-level-1-2-3-energy-audits/
[3] CBECS Commercial Buildings Energy Consumption Survey
http://www.eia.gov/consumption/commercial/
[4] Energy Trust of Oregon, Existing Buildings Program
http://energytrust.org/commercial/equipment-upgrades-
remodels/
[5] PNNLre-tuning website
http://buildingretuning.pnnl.gov/index.stm
[6] IPMVP protocols website http://www.evo-world.org/
[7] UC Berkeley M+Vwebsite http://mnv.lbl.gov/home
AUTHOR BIOS
Tom White is the chief engineer at the Green Building Initiative
(GBI), based in Portland, Oregon. Tom’s primary responsibilities
include investigating and resolving technical issues, ensuring that
Green Globes and Guiding Principles rating systems and criteria
are well-founded in both concept and application, and offering
guidance and direction to customers on initiatives that affect their
green building projects. Tom is a registered professional
engineer, with CEM and LEED AP credentials, and holds both
bachelors and master's degrees in mechanical engineering.
tom@thegbi.org
Kevin Stover is a registered professional engineer and the
commercial programs consultant with the Green Building
Initiative. Kevin’s technical guidance supports the development
and application of the Green Globes rating systems for certifying
the design, construction and operation of commercial green
buildings. Kevin is responsible for tracking registered projects,
collaborating with staff members and customers, alike;
addressing technical issues; and reaching out to prospective users,
organizations and public organizations. kevin@thegbi.org
Ken Anderson is registered mechanical engineer, principal of the
Energy Gleaners, a Portland-area company providing high end
engineering and energy services to building owners in Oregon as
well as other parts of the country. Ken has more than 30 years of
experience in field work evaluation and analysis of energy
systems. kenja777@comcast.net
Paul Williamson, principal of Planwest Partners, has spent most
of his career in the management and delivery of energy efficiency
programs, products, and services. As the Energy Smart Design
program manager for Clark Public Utilities in Washington, Paul
delivered energy efficiency design and commissioning services to
several hundred utility customers who also received incentives
for their building improvements. He worked closely with building
design teams and their contractors as well as vendors of energy-
efficient products.
At Ecos Consulting, Paul was a program coordinator for the
regional ENERGY STAR Lighting and ENERGY STAR Homes
NW programs, establishing successful networks with trade allies,
supporting training programs and maintaining utility
relationships. His direct industry experience includes managing
Energy Star light fixture manufacturing and distribution for both
national and regional companies. While working for Seattle and
Globe Lighting, he secured the highest honors available in this
industry from the National ENERGY STAR Lighting Program
including the Lighting Retailer of the Year Award in 2008. In the
last several years, Paul has designed a suite of portable high
efficiency task/ambient light fixtures, built prototypes and
demonstrated them for leaders in the efficient lighting industry.
Paul holds a B.S. degree from the University of Oregon School of
Architecture and Allied Arts and an Energy Management
Certificate through the Northwest Water and Energy Education
Institute. pwilliamson5158@gmail.com](https://image.slidesharecdn.com/677a1d81-42cc-4230-b32b-cd1a263db4d3-150511011813-lva1-app6892/85/WEEC_White-Anderson_01OCT2014-FINAL-8-320.jpg)

This document discusses using short-term data logging to identify low-cost or no-cost energy efficiency opportunities. It describes taking inventory of energy systems, identifying key operating variables to measure, specifying data collection points, analyzing the data to estimate annual energy use and end uses, and estimating potential savings from low-cost efficiency measures. An example of calculating savings for a compressed air system using this approach is provided.


