Webinar: Strengthening food value chains
•
0 likes•1,072 views

This webinar on Oct. 27, 2020, organized by the CGIAR Research Program on Policies, Institutions, and Markets (PIM) and Food Security Portal, presented findings from the recent CGIAR research on food value chains in three regions. Full recording and more details available at https://bit.ly/341JAiO

Recommended
Recommended
More Related Content
What's hot
What's hot (20)
Similar to Webinar: Strengthening food value chains
Similar to Webinar: Strengthening food value chains (20)
More from IFPRI-PIM
More from IFPRI-PIM (20)
Recently uploaded
Recently uploaded (20)
Webinar: Strengthening food value chains
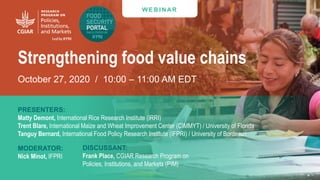
- 1. W E B I N AR Strengthening food value chains October 27, 2020 / 10:00 – 11:00 AM EDT PRESENTERS: Matty Demont, International Rice Research Institute (IRRI) Trent Blare, International Maize and Wheat Improvement Center (CIMMYT) / University of Florida Tanguy Bernard, International Food Policy Research Institute (IFPRI) / University of Bordeaux MODERATOR: Nick Minot, IFPRI DISCUSSANT: Frank Place, CGIAR Research Program on Policies, Institutions, and Markets (PIM)
- 2. RICE VALUE CHAIN UPGRADING IN WEST AFRICA 11 Value of rice production in US$/ha (Nelson, 2010) Matty Demont, CGIAR Research Program on Rice Flagship Leader “Upgrading rice value chains” International Rice Research Institute (IRRI), Los Baños, Philippines WEBINAR “STRENGTHENING FOOD VALUE CHAINS”, CGIAR RESEARCH PROGRAM ON POLICIES, INSTITUTIONS, AND MARKETS (PIM) AND FOOD SECURITY PORTAL, 27 OCTOBER 2020. Rice value chain upgrading in West Africa
- 3. 2RICE VALUE CHAIN UPGRADING IN WEST AFRICA Global Context y = 774x + 8.15 R² = 0.92 0 100 200 300 400 500 600 0 10 20 30 40 50 60 70 80 Ricepaddypercapita(kg) Percentage of total crop area harvested to rice Malaysia Philippines Indonesia Myanmar Cambodia Lao PDR Thailand Vietnam PHP/kg milled rice Philippine s Indonesi a Thailan d Vietnam Drying cost 0.26 0.62 0.33 0.52 Transport cost 2.09 2.22 1.08 1.76 Milling cost 1.38 1.22 0.89 0.93 Storage cost 0.19 0.40 0.20 0.23 Packaging cost 0.45 0.24 0.14 0.22 Cost of working capital 0.27 0.28 0.09 0.11 Total marketing cost 4.63 4.97 2.73 3.78 Returns above major cost 4.43 0.65 2.54 0.77 Gross marketing margins 9.06 5.61 5.27 4.55
- 4. 3RICE VALUE CHAIN UPGRADING IN WEST AFRICA West Africa Competitiveness of domestic vis-à-vis imported rice Coton… Bohic… Malanvi… Abuja Makurdi Lafia Abidjan Gagnoa Daloa Freetown Makeni Bamako Sikasso Koutiala 0% 20% 40% 60% 80% 100% 0 200 400 600 800 1000 1200 1400 Marketshareof localrice(%) Distance to sea port (km) 0 1000 2000 3000 4000 5000 6000 Guinea-Bissau Gambia, The Sierra Leone Niger Guinea Ghana Senegal Quantity (thousand tonnes) Production Gap between demand and domestic supply
- 5. 4RICE VALUE CHAIN UPGRADING IN WEST AFRICA West Africa Comparative advantage in demand
- 6. 5RICE VALUE CHAIN UPGRADING IN WEST AFRICA National Rice Development Strategies Coalition for African Rice Development (CARD)
- 7. State of rice value chain upgrading in 15 countries in West Africa, 2009–2019 Country Number of investments in industrial and semi-industrial mills that were operational in 2019 Aggregate upgraded milling capacity (t/h) Origin of investment s Vertical coordination Import exposure Average annual rice supply 2009–2018 (103 tons) Contract farming (producers) Vertical integration (ha) Import barriers 2008 import bill (106 US$) Nigeria 24 industrial mills 177 FDI, DPI >3,000 >20,400 None 772 3,512 Senegal 15 industrial & semi- industrial mills 60 FDI, DPI 3,500 3,590 None 645 438 Ghana 1 industrial mill 3 semi-industrial mills 26 FDI, DPI 4,000 750 None 216 333 Mali 4 industrial mills 20 FDI, DPI n.a. 3,200 Physical & cultural 66 1,360 Côte d’Ivoire 2 industrial mills 1 semi-industrial mill 15 PI, DPI 10 (experi- mental) – Cultural 472 1,024 Burkina Faso 1 industrial mill 1 semi-industrial mill 7 DPI 140 – Physical 56 194 Liberia 2 semi-industrial mills 4 DPI, PI – – None 75 174 Niger 2 semi-industrial mills 4 PI – – Physical 126 194 Sierra Leone 1 semi-industrial mill 2 DPI – 1,300 Cultural 85 668 Benin 17 ESOP – DPI 140 – None 185 132 Togo 15 ESOP – DPI >100 – None 9.3 86 Guinea – – – – – Cultural 153 1,248 Mauritania – – – – – None 77 119 Gambia – – – – – Cultural 28 36 Guinea- Bissau – – – – – Cultural 10 107 OUTCOME INDICATORS DRIVERS 1 2 3
- 8. 7RICE VALUE CHAIN UPGRADING IN WEST AFRICA Conclusion • We captured heterogeneity in investment in rice value chain upgrading among 15 West African countries through the following outcome indicator: aggregate milling capacity of upgraded industrial and semi- industrial mills (t/h) (total in West Africa = 315 t/h) • Heterogeneity in upgrading can be explained for 89% through two drivers and an enabling factor: • Driver 1 = Supply: Average annual paddy supply (2009– 2018): One million ton more of milled rice availability increases upgraded milling capacity by 34 t/h • Driver 2 = Demand: 2008 import bill: A 100 million US$ higher import bill increases upgraded milling capacity by 6 t/h • Enabling factor = limited comparative advantage in demand: Geographical or genealogical proximity to rice cultural heritage preserves indigenous preferences for local rice and decreases upgraded milling capacity by 23 t/h • Landlockedness: No significant effect • Policy makers need to find an optimal mix between encouraging productivity, demand and value chain upgrading to foster crowding-in of private investment (e.g., FDI)
- 9. RICE VALUE CHAIN UPGRADING IN WEST AFRICA 88 Value of rice production in US$/ha (Nelson, 2010) Matty Demont, CGIAR Research Program on Rice Flagship Leader “Upgrading rice value chains” International Rice Research Institute (IRRI), Los Baños, Philippines Webinar “Strengthening Food Value Chains”, CGIAR Research Program on Policies, Institutions, and Markets (PIM) and Food Security Portal, 27 October 2020. Thank you!
- 10. Trent Blare – University of Florida, formerly CIMMYT Jason Donovan – CIMMYT Marina García-Medina: CIMMYT The right tortilla for the right occasion: Variation in consumers’ willingness to pay for blue maize tortillas based on utilization
- 11. Blue maize markets • 60% is consumed locally (few external markets) & processed by women • Growing interest in Mexico to consume traditional products & growing international markets • Opportunity to increase income from blue maize production • Bring more farmers into blue maize VC • Both in gourmet sector & agro industry • Little knowledge of what happens to native maize once it leaves the farm – especially of consumer’s preferences & role in the VC
- 12. Research Questions •Which consumers are willing to pay more for blue maize tortillas? •What limits access to blue maize tortillas?
- 13. Data collection • 3 locations (market & two shopping centers) in peri-urban Mexico City from May-June 2019 with 630 consumers • Blinded taste test of machine white, handmade blue & handmade white tortillas • Choice experiment of three different scenarios: in-home daily use, in-home special event, and out-of-home consumption
- 14. % More Consumers’ Willing to Pay for Blue Maize Tortillas Variable In-home daily In-home special event Out-of- home WMMT to BHMT WHMT to BHMT WMMT to BHMT WHMT to BHMT WHMT to BHMT Overall preference 30.78 --- 42.00 --- 41.60 Women --- 3.58 ---- ---- ---- Post-secondary --- --- 62.26 6.55 57.37 Mid income --- --- 31.64 --- --- High income 39.85 --- ---- --- 51.90
- 15. % Faced Following Difficulties in Accessing Tortillas Difficulty White Blue Lack of trust in the quality 29 71 Too expensive 37 63 Unaware of sales points 38 62 Too little product 38 62 Too few sales points 41 59 Sales points too far away 49 51
- 16. Conclusions • Consumers, in general, prefer and are willing to pay more for blue tortillas - especially women & more educated •Price may not be the primary factor that limits the purchase of blue maize • Consumers seek out products but cannot find them •Failure for demand signals to transmit down the VC • Choices depend on use & context
- 17. Thank you! Trent Blare: tblare@ufl.edu Jason Donovan: j.donovan@cgiar.org Mariana Garcia-Medina: m.garcia@cgiar.org Blare, T., Donovan, J., and Medina-Garcia, M. 2020. The right tortilla for the right occasion: Variation in consumers’ willingness to pay for blue maize tortillas based on utilization. Journal of Food Products Marketing.
- 18. Contracting and quality upgrading: Evidence from an Experiment in Senegal PIM Webinar, October 27, 2020 Tanguy Bernard (Univ. Bordeaux & IFPRI), with Joshua Deutschman (Univ. Wisconsin-Madison) & Ouambi Yameogo (IITA)
- 19. Motivation • Linking producers to export markets can improve income and welfare (e.g. Minten et al. 2009; Reardon et al. 2009; Atkin et al. 2017; Barrett et al. 2020) • Requires to meet international quality standards – often a major entry barrier (e.g. Ferro et al. 2015; Fontagné et al. 2015; Fernandes et al. 2019) • Implies producers to change practices or invest in new technologies • Farmers’ changes of practices/uptake of new technologies are constrained by market imperfections • Credit alone cannot unlikely relaxes adoption constraint (e.g. Karlan et al., 2014) • Insurance provision, suffers from limited uptake (e.g; Cole et al. 2014; Cai, 2016; Elabed and Carter, 2015) • Output market reforms may not sustain lobbying efforts from local traders (e.g. Bernard et al. 2018) → Suggests bundling interventions together to address several of these constraints (Abate et al., 2018; Deutschmann et al., 2019) • Contract farming arrangements can help address market imperfections and increase productivity or quality (Arouna et al., 2019; Macchiavello and Miquel-Florensa, 2019). • Can be difficult in contexts with limited institutional capacity (Fafchamps, 2004; Bellemare, 2010; Mujawamariya et al., 2013) • Effectiveness depend either effective institutions or informal relationships (Brown et al., 2004; Michler and Wu, 2020).
- 20. This study • Context • Aflatoxins control recognized as a key public health challenge (Partnership for Aflatoxin Control in Africa, 2015) • Small-scale producers in Senegal’s peanut bassin, face stringent Aflatoxins’ requirement to export on European market • Aflasafe: an affordable and effective bio-control technology developped and promoted in Africa by IITA • Research question • To what extent are bundle contract arrangements more/less effective at promoting uptake of Aflasafe, a brand new technology ? • Subsequent question: which contract features (and combination) matter most ? • Test of a new contractual offer which bundles: • Credit for the purchase of Aflasafe • Extension for the use of Aflsafe • Price premium for low-aflatoxins groundnuts • Randomized control trial • Work with two partner groundnut coops, each working in > 50 villages • Randomly select 40 villages, 10 farmers per village. Final sample = 396 farmers • Assign 20 villages to new contract offer, 20 as controls, stratified at commune-level • Timing • June-July 2019 : Baseline survey and treatment assignement • August 2019: Access and extension for use of Aflasafe • December 2019 – January 2020: test of samples • June 2020: endline survey
- 21. Treatment and compliance • Outcomes of interest • Uptake of technology (purchase of Aflasafe) • Output quality (satisfies EU standards) • Fulfillment of contract (share sold to coop) Treatment Control Information Health hazard of aflatoxins yes yes Agronomic potential of Aflasafe yes yes Availability Coupon to redeem 10kg of Aflasafe from coop shop yes yes Payment of Aflasafe (10 000 CFA ~20 USD) credit cash Extension Demo video yes yes Field demo yes maybe Price premium 40 CFA/kg guarranteed maybe
- 22. Uptake of new technology (Aflasafe) • Large effect of treatment on on uptake of new technology – much larger than effects of non- bundled interventions in existing literature. • Heterogeneity: • Treatment effect mostly driven by risk-averse individuals
- 23. Effect on quality – compliance with EU standards • Aflatoxin contamination is indeed a problem in the groundnut basin of Senegal: more than 30 percent of farmers in the control group exhibited contamination exceeding European Union import standards. • Positive but relatively small (12 percentage point) effect of treatment on average • Important heterogeneity: farmers in high-risk of aflatoxins areas who receive a contract offer, produce groundnuts is 44 percentage point (138%) more likely to comply with international standards.
- 24. Fulfillment of contract – sales to coops • Supply to cooperative: relatively large positive effect on extensive and intensive margin (anout twice the size of the loan for Aflasafe) • Heterogeneity: • Effect of treatment nearly three times as large for high-reciprocity farmers • Effect is twice as large for new farmers and lead farmers
- 25. Follow-up • Could a cheaper contract with fewer contract elements provide similar benefits? • Possible general equilibrium effects of such contracts on quality composition of groundnuts traded in local markets
- 26. Q&A Recording of this webinar will be available on the PIM website shortly after the live event. All registrants will receive a follow- up email with the link to the webinar materials (video, presentation, podcast). Previous PIM Webinars: http://bit.ly/PIMwebinars If you want to receive alerts about future PIM Webinars, sign up here: https://pim.cgiar.org/subscribe/ …and follow us on: @PIM_CGIAR @PIM.CGIAR