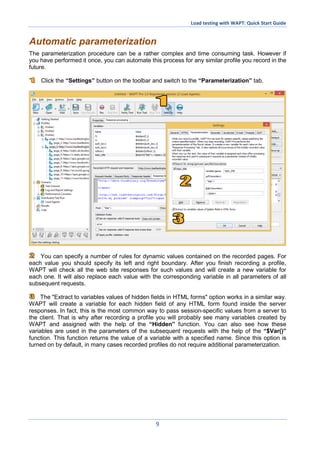
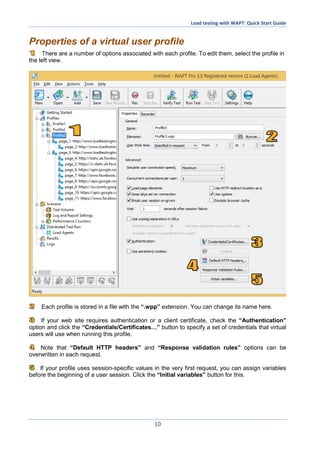
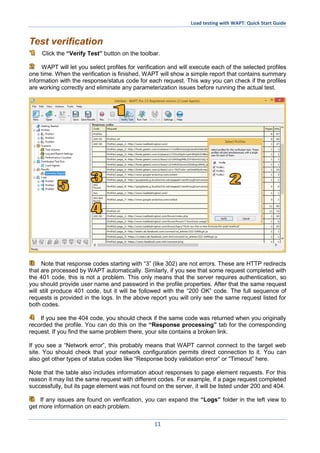
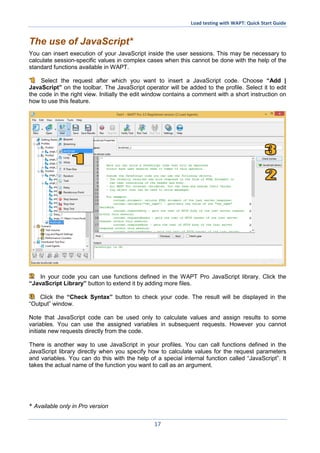
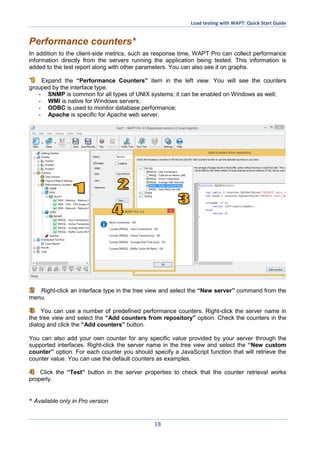
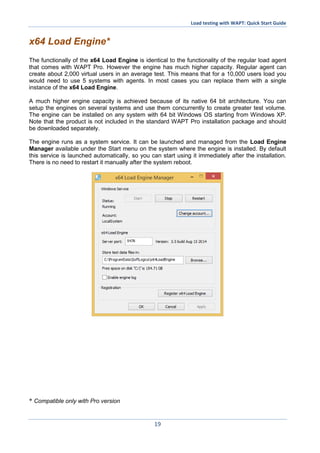
This document provides step-by-step instructions for creating a simple load test using the WAPT load testing tool. It describes creating a test scenario, recording a virtual user profile by navigating a web application in a browser, parameterizing dynamic values, specifying the load parameters, and reviewing results. The goal is to demonstrate the basic workflow for load testing a web application and interpreting results using WAPT's features.
Web API 2 With MVC 5.
MVC 5 introduces Web API 2 which contains very useful features like IHttpActionResult , Cross-Origin Resource Sharing , Atttribute Routing etc...
Krunal Trivedi explains here Web API 2 With MVC 5.
For more details visit http://iamkrunaltrivedi.com/?p=758 and http://iamkrunaltrivedi.com/?p=773
Relationship marketing as promise managementJorge Prado
Apresentação do capítulo Relationship marketing as promise management, de Christian Grönroos, publicado em 2013 no livro The SAGE handbook of marketing theory.
What really defines marketing relationshipJorge Prado
Apresentação do artigo What really defines marketing relationship: a review of definitions and general and sector-specific defining constructs, escrito por Arun Kumar Agariya e Deepali Singh, publicado em 2011 na Journal of Relationship Marketing.
Resource from Apache JMeter and Online. Taken this topic for Testing Team at Bullseye for knowledge sharing day - 26th April 2013. Thanks guys for listening!.
In this article, I take a brief look at a tool which performs, essentially, Record Playback test creation and Execution - TestIm Chrome extension.
I was very pleasantly surprised by what I discovered.
This tool has definitely a place in the Test Automation toolbox, but, in my view, for business-related settings.
This article looks at a specific "record-and-playback" testing tool, TestIm, and finds that it performs surprisingly well. It seems that the long-held view that such approaches are unreliable and lead to flaky tests is unfounded. The Phoenix Rises ...
About Basics of IBM Rational Performance Tester Tool.
It describes what is RPT? how to do a simple script in RPT.
And how to execute it?.
Its a brief idea about RPT
BI-Validator Usecase - Stress Test PlanDatagaps Inc
BI-Validator's Stress Test Plan can simulate user load with out the need for writing any scripts/code. With multiple settings and options, it is easy to replicate real-time user behavior and see how the BI Tool will perform.
Unleash Unlimited Potential with One-Time Purchase
BoxLang is more than just a language; it's a community. By choosing a Visionary License, you're not just investing in your success, you're actively contributing to the ongoing development and support of BoxLang.
Globus Compute wth IRI Workflows - GlobusWorld 2024Globus
As part of the DOE Integrated Research Infrastructure (IRI) program, NERSC at Lawrence Berkeley National Lab and ALCF at Argonne National Lab are working closely with General Atomics on accelerating the computing requirements of the DIII-D experiment. As part of the work the team is investigating ways to speedup the time to solution for many different parts of the DIII-D workflow including how they run jobs on HPC systems. One of these routes is looking at Globus Compute as a way to replace the current method for managing tasks and we describe a brief proof of concept showing how Globus Compute could help to schedule jobs and be a tool to connect compute at different facilities.
First Steps with Globus Compute Multi-User EndpointsGlobus
In this presentation we will share our experiences around getting started with the Globus Compute multi-user endpoint. Working with the Pharmacology group at the University of Auckland, we have previously written an application using Globus Compute that can offload computationally expensive steps in the researcher's workflows, which they wish to manage from their familiar Windows environments, onto the NeSI (New Zealand eScience Infrastructure) cluster. Some of the challenges we have encountered were that each researcher had to set up and manage their own single-user globus compute endpoint and that the workloads had varying resource requirements (CPUs, memory and wall time) between different runs. We hope that the multi-user endpoint will help to address these challenges and share an update on our progress here.
Innovating Inference - Remote Triggering of Large Language Models on HPC Clus...Globus
Large Language Models (LLMs) are currently the center of attention in the tech world, particularly for their potential to advance research. In this presentation, we'll explore a straightforward and effective method for quickly initiating inference runs on supercomputers using the vLLM tool with Globus Compute, specifically on the Polaris system at ALCF. We'll begin by briefly discussing the popularity and applications of LLMs in various fields. Following this, we will introduce the vLLM tool, and explain how it integrates with Globus Compute to efficiently manage LLM operations on Polaris. Attendees will learn the practical aspects of setting up and remotely triggering LLMs from local machines, focusing on ease of use and efficiency. This talk is ideal for researchers and practitioners looking to leverage the power of LLMs in their work, offering a clear guide to harnessing supercomputing resources for quick and effective LLM inference.
Code reviews are vital for ensuring good code quality. They serve as one of our last lines of defense against bugs and subpar code reaching production.
Yet, they often turn into annoying tasks riddled with frustration, hostility, unclear feedback and lack of standards. How can we improve this crucial process?
In this session we will cover:
- The Art of Effective Code Reviews
- Streamlining the Review Process
- Elevating Reviews with Automated Tools
By the end of this presentation, you'll have the knowledge on how to organize and improve your code review proces
Essentials of Automations: The Art of Triggers and Actions in FMESafe Software
In this second installment of our Essentials of Automations webinar series, we’ll explore the landscape of triggers and actions, guiding you through the nuances of authoring and adapting workspaces for seamless automations. Gain an understanding of the full spectrum of triggers and actions available in FME, empowering you to enhance your workspaces for efficient automation.
We’ll kick things off by showcasing the most commonly used event-based triggers, introducing you to various automation workflows like manual triggers, schedules, directory watchers, and more. Plus, see how these elements play out in real scenarios.
Whether you’re tweaking your current setup or building from the ground up, this session will arm you with the tools and insights needed to transform your FME usage into a powerhouse of productivity. Join us to discover effective strategies that simplify complex processes, enhancing your productivity and transforming your data management practices with FME. Let’s turn complexity into clarity and make your workspaces work wonders!
Software Engineering, Software Consulting, Tech Lead, Spring Boot, Spring Cloud, Spring Core, Spring JDBC, Spring Transaction, Spring MVC, OpenShift Cloud Platform, Kafka, REST, SOAP, LLD & HLD.
OpenMetadata Community Meeting - 5th June 2024OpenMetadata
The OpenMetadata Community Meeting was held on June 5th, 2024. In this meeting, we discussed about the data quality capabilities that are integrated with the Incident Manager, providing a complete solution to handle your data observability needs. Watch the end-to-end demo of the data quality features.
* How to run your own data quality framework
* What is the performance impact of running data quality frameworks
* How to run the test cases in your own ETL pipelines
* How the Incident Manager is integrated
* Get notified with alerts when test cases fail
Watch the meeting recording here - https://www.youtube.com/watch?v=UbNOje0kf6E
Globus Connect Server Deep Dive - GlobusWorld 2024Globus
We explore the Globus Connect Server (GCS) architecture and experiment with advanced configuration options and use cases. This content is targeted at system administrators who are familiar with GCS and currently operate—or are planning to operate—broader deployments at their institution.
Top Features to Include in Your Winzo Clone App for Business Growth (4).pptxrickgrimesss22
Discover the essential features to incorporate in your Winzo clone app to boost business growth, enhance user engagement, and drive revenue. Learn how to create a compelling gaming experience that stands out in the competitive market.
Enhancing Research Orchestration Capabilities at ORNL.pdfGlobus
Cross-facility research orchestration comes with ever-changing constraints regarding the availability and suitability of various compute and data resources. In short, a flexible data and processing fabric is needed to enable the dynamic redirection of data and compute tasks throughout the lifecycle of an experiment. In this talk, we illustrate how we easily leveraged Globus services to instrument the ACE research testbed at the Oak Ridge Leadership Computing Facility with flexible data and task orchestration capabilities.
May Marketo Masterclass, London MUG May 22 2024.pdfAdele Miller
Can't make Adobe Summit in Vegas? No sweat because the EMEA Marketo Engage Champions are coming to London to share their Summit sessions, insights and more!
This is a MUG with a twist you don't want to miss.
Utilocate offers a comprehensive solution for locate ticket management by automating and streamlining the entire process. By integrating with Geospatial Information Systems (GIS), it provides accurate mapping and visualization of utility locations, enhancing decision-making and reducing the risk of errors. The system's advanced data analytics tools help identify trends, predict potential issues, and optimize resource allocation, making the locate ticket management process smarter and more efficient. Additionally, automated ticket management ensures consistency and reduces human error, while real-time notifications keep all relevant personnel informed and ready to respond promptly.
The system's ability to streamline workflows and automate ticket routing significantly reduces the time taken to process each ticket, making the process faster and more efficient. Mobile access allows field technicians to update ticket information on the go, ensuring that the latest information is always available and accelerating the locate process. Overall, Utilocate not only enhances the efficiency and accuracy of locate ticket management but also improves safety by minimizing the risk of utility damage through precise and timely locates.
We describe the deployment and use of Globus Compute for remote computation. This content is aimed at researchers who wish to compute on remote resources using a unified programming interface, as well as system administrators who will deploy and operate Globus Compute services on their research computing infrastructure.
2. Load testing with WAPT: Quick Start Guide
2
Creating a test scenario
We will start with creating a test scenario. It includes all the general parameters of the test, such
as the number of virtual users, type of load and test duration.
Click the “New” button on the toolbar. This will launch the New Scenario Wizard.
In this example we will create a simple performance test. Choose the "Performance Test"
option on the first page of the Wizard and click the “Next” button to continue.
On the second page of the Wizard you can specify the basic parameters for the ramp-up load
recommended for the performance testing. The number of virtual users will grow during the test
and you can make it grow faster or slower. This will let you compare the performance of your web
application on different test phases depending on the changing load.
Click the “Next” button to proceed to Page 3.
3. Load testing with WAPT: Quick Start Guide
3
Test duration options
On Page 3 you can choose the test duration. You can either specify an exact time for the test
or set the total number of sessions that should be executed by all virtual users. Now let’s proceed
to Page 4.
The last page of the Wizard contains some important hints on how to create a test and
interpret its results. Click the “Finish” button to proceed to the test recording.
Note that any options you choose in the Scenario Wizard can be adjusted later. To do this click
the “Test Volume” item in the left view of the WAPT window. The type of test only changes the
default values of the load parameters you see in the wizard.
* * *
The most important part of the work is the design of the virtual user profiles. One profile is created
for each type of virtual users. It contains user path through the web site and other parameters
required for the correct emulation of the user sessions. One profile is usually executed by multiple
virtual users concurrently. You need to create more than one profile only if you expect that some
users will have significantly different behavior and/or will visit different parts of the site being
tested (like site admins and regular users).
One execution of a profile creates one user session. As soon a user finishes a session, it starts a
new one, and so on until the test is finished. So, during the test each virtual user emulates multiple
successive real users visiting the site one after another.
4. Load testing with WAPT: Quick Start Guide
4
Creating a virtual user profile
Initially profiles are recorded with the help of a browser. You should simply perform step by step
all the actions of the user that you want to emulate. WAPT will record everything in the form of
HTTP requests. During the test WAPT will execute multiple copies of the recorded session by
sending the same sequence of requests with modified parameters. This modification is also called
“parameterization”. It is required because some parameters should have different values in each
emulated user session.
After you complete the New Scenario Wizard, WAPT will automatically proceed to recording a
profile. In the future you can click the “Rec” button on the toolbar to record another one. This will
open the “Recording Options” dialog.
Choose a name for your profile.
You can either use the embedded Internet Explorer window for recording, or choose an
external browser for this purpose. Embedded window provides more visibility and lets WAPT
better organize the recorded requests. However if you experience any problems using it (like
JavaScript error messages appearing during recording or some application features not working),
try using one of the external browsers instead. Embedded browser has limited support for
JavaScript execution.
It is strictly recommended to delete browser cache files and cookies before starting the
recording. This is required to record a session independent from all the previous user activity that
may have been performed on your system. Only in such case it will be possible to reproduce the
recorded session correctly. WAPT will perform the cleanup automatically if you leave the
corresponding options checked. Note that it may take up to few minutes when you do this for the
first time.
Click the “Ok” button to start recording.
5. Load testing with WAPT: Quick Start Guide
5
Recording a user session
Type the URL of your web site or application to the address bar and click the “Go” button (or
press Enter). As you navigate through the web site inside the browser window, WAPT will record
all your steps in a sequence of HTTP requests.
These requests will start appearing in the left view. Note that sometimes when you click a link
WAPT adds several requests while the page loads. Additional requests are initiated by JavaScript
code running on the page. They can appear when you work with the web interface controls or at
random times. This is also the result of AJAX calls made by your application.
If you record using the embedded browser, WAPT will place these requests in a tree. In case of
an external browser all such requests will be also recorded, but may appear on the same level
with other requests. You can organize them into a tree manually by dragging and dropping with
the mouse. This will simplify the future work with the profile.
Additional requests to images, .js and .css files do not appear in the list. They are recorded as
“page elements”. After recording you can find them in the properties of the corresponding page
request.
Note that WAPT works as a proxy between the browser and the target web site. Because of that
you may experience some delays when working with your web application. Try to use it without
haste. Do not click next link until you see that the current step has been fully recorded.
After you finish recording, click the “Stop Rec” button on the toolbar. You can record several
more profiles in a similar way, or proceed with just one.
6. Load testing with WAPT: Quick Start Guide
6
Properties of a request and its parameterization
Select a request in the left view. The right view will contain two tabs. The “Properties” tab is
where you can view and edit the properties of the selected request.
The most important property is the list of parameters. These parameters deliver session-
specific data from the client part of your web application to the server. For example, many
applications send user name and password as parameters of the login request.
There are no standard names and meanings for all parameters. Each web application can use its
own custom ones to pass its specific data. The number of parameters, their names and values
may be different for each request.
Initially all parameters have static values that were used in the recorded session. However you
can change this. For example, if you need each virtual user in your test to use a different name
and password, you can do this with the help of special WAPT functions. This is called
“Parameterization”. The understanding of this concept is very important for successful use of
any load testing tool, including WAPT.
To edit any parameter, select it in the list and click the “Edit” button to the right of the list (or just
double-click the parameter line).
In the “Edit Parameter” dialog box you can specify how to calculate the value for the
selected parameter. In the example shown on the screenshot above the value of the parameter is
calculated with the help of the “Ordered List” function that takes one of three names from the list.
You can specify longer list to have more samples, or provide a file with values instead. Other
functions can generate random values, extract them from server responses and use variables
assigned earlier.
7. Load testing with WAPT: Quick Start Guide
7
The processing of server responses
Switch to the “Response processing” tab. Here you can specify what to do after receiving the
response to the selected request.
Let’s suppose that the application you need to test works with some items or documents. During
each session the user selects an item from the list, modifies its properties and saves changes. To
emulate such session properly you need to specify the correct item ID in the properties of all
requests that retrieve the item and save it. However this ID is different in each user session. You
can only take it from the list of items returned by the server.
That is why you may need to specify how to extract the required value from the server response
and assign it to a variable. This variable can be used in all subsequent requests instead of the
initially recorded value.
The list of variables is provided at the top of the “Response processing” tab. You can
assign variables using the same set of functions as for the parameters. The difference is that
variables are updated after receiving server response, whereas parameters are calculated before
sending the request. In the above example, the “$Search()” function is used to extract a random
topic title from a page containing several such titles. This is done in a test for a web site forum.
The tab contains full information on the initially recorded request and response to it. You can
search for any text there. This is very useful, if you want to find the initially recorded value and its
bounding text which can be used to specify the arguments of the “$Search()” function.
There is one more useful option in the processing of server responses. You can specify
custom validation rules here. You can make WAPT identify application-specific errors even if they
are not reported through the HTTP response codes. In the above example the response is treated
as valid, if it does not contain the “error” word inside.
8. Load testing with WAPT: Quick Start Guide
8
Bunch parameterization
More than one request in a profile may require the same parameterization. A session-specific
value may be produced by the server in a response and used as a parameter in several
subsequent requests.
To speed up the work with such value, select it in the list of parameters and click the
“Parametrize” button. The “Parameterization” dialog will appear. You can also open it through
the “Edit” menu and enter the value manually.
Click the "Find" button to find all occurrences of the value in the profile. In the left pane of the
dialog you will see all available "sources". This means all places in server responses from which
the value can be extracted. The right pane contains the list of all "uses" of the value.
You should select one source and put checkmarks near all "uses" that you want to parameterize.
You can see the details of each source and use in the main WAPT window while clicking on items
in the dialog. It is usually preferable to select the earliest source, i.e. the place where the value
appeared for the first time.
Click the "Create variable and parameterize selected uses" button. WAPT will
automatically create a variable from the selected source and assign it with the help of the
“$Search()” function. You will be able to see that variable in the processing of the corresponding
response. It will also appear in all parameterized uses instead of the initial value.
9. Load testing with WAPT: Quick Start Guide
9
Automatic parameterization
The parameterization procedure can be a rather complex and time consuming task. However if
you have performed it once, you can automate this process for any similar profile you record in the
future.
Click the “Settings” button on the toolbar and switch to the “Parameterization” tab.
You can specify a number of rules for dynamic values contained on the recorded pages. For
each value you should specify its left and right boundary. After you finish recording a profile,
WAPT will check all the web site responses for such values and will create a new variable for
each one. It will also replace each value with the corresponding variable in all parameters of all
subsequent requests.
The "Extract to variables values of hidden fields in HTML forms" option works in a similar way.
WAPT will create a variable for each hidden field of any HTML form found inside the server
responses. In fact, this is the most common way to pass session-specific values from a server to
the client. That is why after recording a profile you will probably see many variables created by
WAPT and assigned with the help of the “Hidden” function. You can also see how these
variables are used in the parameters of the subsequent requests with the help of the “$Var()”
function. This function returns the value of a variable with a specified name. Since this option is
turned on by default, in many cases recorded profiles do not require additional parameterization.
10. Load testing with WAPT: Quick Start Guide
10
Properties of a virtual user profile
There are a number of options associated with each profile. To edit them, select the profile in
the left view.
Each profile is stored in a file with the “.wpp” extension. You can change its name here.
If your web site requires authentication or a client certificate, check the “Authentication”
option and click the “Credentials/Certificates…” button to specify a set of credentials that virtual
users will use when running this profile.
Note that “Default HTTP headers” and “Response validation rules” options can be
overwritten in each request.
If your profile uses session-specific values in the very first request, you can assign variables
before the beginning of a user session. Click the “Initial variables” button for this.
11. Load testing with WAPT: Quick Start Guide
11
Test verification
Click the “Verify Test” button on the toolbar.
WAPT will let you select profiles for verification and will execute each of the selected profiles
one time. When the verification is finished, WAPT will show a simple report that contains summary
information with the response/status code for each request. This way you can check if the profiles
are working correctly and eliminate any parameterization issues before running the actual test.
Note that response codes starting with “3” (like 302) are not errors. These are HTTP redirects
that are processed by WAPT automatically. Similarly, if you see that some request completed with
the 401 code, this is not a problem. This only means that the server requires authentication, so
you should provide user name and password in the profile properties. After that the same request
will still produce 401 code, but it will be followed with the “200 OK” code. The full sequence of
requests is provided in the logs. In the above report you will only see the same request listed for
both codes.
If you see the 404 code, you should check if the same code was returned when you originally
recorded the profile. You can do this on the “Response processing” tab for the corresponding
request. If you find the same problem there, your site contains a broken link.
If you see a “Network error”, this probably means that WAPT cannot connect to the target web
site. You should check that your network configuration permits direct connection to it. You can
also get other types of status codes like “Response body validation error” or “Timeout” here.
Note that the table also includes information about responses to page element requests. For this
reason it may list the same request with different codes. For example, if a page request completed
successfully, but its page element was not found on the server, it will be listed under 200 and 404.
If any issues are found on verification, you can expand the “Logs” folder in the left view to
get more information on each problem.
12. Load testing with WAPT: Quick Start Guide
12
Log viewer
Log Viewer provides the detailed information on all requests, responses, and errors appeared
during the test run or verification. This information is structured with the help of a tree view that
includes profiles, virtual users, sessions and requests.
Expand the “Logs” folder in the left view and select a session.
In the upper right view you will see the log lines of the following types.
Information messages like “Connecting to…”, “Local IP…” and any messages written to the
log by JavaScript operators.
Page requests. Successful ones are painted green. Requests completed with errors are
painted red.
Requests to page elements in grey color with indent under each page request. You can
expand and collapse them.
“Values of variables” lines that provide information on the values of all variables used in the
next request.
You can select any line and see the details in the lower part of the view. For each request
you can switch between different tabs containing request and response headers and bodies.
You can compare any part to the initially recorded content. This way you can check what
parameter or header values were different in this specific session. You can also see if the server
responded as usual or produced a significantly different content, which may indicate a problem.
The useful search option is also available here.
Note that by default logging is disabled for efficiency reasons. So if you want to get logs after a
test run, you should enable this feature on the “Log and Report Settings” page. You can save
all log files by choosing “File | Save Logs…” from the menu.
13. Load testing with WAPT: Quick Start Guide
13
Test Volume
After you make sure that all your profiles are working correctly you can specify the load
parameters for the actual test.
Select the “Test Volume” item in the left view inside the “Scenario” folder.
In the right view you can see the list of all your profiles. Check the ones you want to use in
the test.
You can specify certain load options separately for each profile. Note that these options are
shown for the currently selected profile (highlighted with blue selection). If you want to edit options
of a different one, select it in the list.
In the above example, we have 3 profiles with different types of load (constant, growing and
periodic). Second profile (with the rump-up load) is selected and its options are shown below the
list.
The graph at the bottom of the page shows how the load will be distributed between profiles
during the test. Each profile is shown with a different color.
In the Pro version of the product you can also specify different load agents for different
profiles. By default virtual users are allocated to agents automatically, which means that all agents
execute all profiles.
Now we have finished designing our test, so we can save it. Click the “Save” button on the
toolbar to save your test scenario to a file. All profiles will be also saved to separate files in the
same folder. Keep all these files, if you want to open the same test in the future.
14. Load testing with WAPT: Quick Start Guide
14
Selecting load agents* and starting the test
If you use the Pro version of WAPT, you can generate the test load with the help of several
computers. Each of them should run a special service called Load Agent. By default one of the
agents is installed on the same system with the workplace component of the product. So you can
run the test using your own system. However if you need a greater load, you can attach additional
load agents.
Select the “Load Agents” item in the left view inside the “Distributed Test Run” folder.
Click the “Search LAN for available load agents” button to search your Local Area Network
for computers with installed agents. If you have remote agents located outside the LAN, you can
add them manually using the “Add” button. Since the connection between the workplace
component and load agents is done over TCP/IP, you need to make sure that your network
configuration allows connections to the specified addresses.
Put checkmarks near agents that you want to use in the test. You should check at least one.
Click the “Run Test” button on the toolbar to start your test.
If you use the regular version of WAPT, the load will be generated by the only one built-in agent,
so just click the “Run Test” button to start the test.
* Available only in Pro version
15. Load testing with WAPT: Quick Start Guide
15
Test results
You can start monitoring the test results right after you launch the test. You may only need to wait
several seconds for the first data to appear.
The results are represented in the form of Summary Report, Summary Graphs and graphs for
each user profile and single request. You can select the corresponding option in the left view.
On graphs you can choose between several tabs at the top and select parameters you would
like to see on the graph at the bottom area. Each parameter is shown with a specific shape and
color. All graphs have two vertical scales to represent parameter values. Bottom left corner image
( ) near the parameter description means that the value is specified on the left scale. Bottom
right corner image ( ) refers to the right scale.
In the above example, the number of pages per second (green graph) is specified on the left
scale, whereas the number of active users (black graph) is specified on the right scale.
You can save the results of a test run either as an HTML report, or as a special results file
with the “.wpr” extension. In the latter case you will be able to open that file with WAPT at any
time again, browse graphs and work with the results like right after the test.
16. Load testing with WAPT: Quick Start Guide
16
Extension Modules
WAPT can test any web application that uses HTTP(s) protocol for client-server communication. It
is not usually important which framework and technologies were used to create the application
and what hardware and software is used to run its components.
Still there are two situations in which you may benefit from using modules that provide extended
support for some specific technologies.
The following modules facilitate the test design process.
Module for ASP.net Testing
Modules for JSON Format
With the help of these modules you will be able to create your tests faster and in a more
convenient environment. Both modules are optional, but we recommend installing them in case
your web application uses the corresponding technology.
Some web technologies allow applications to pass data between the client and the server parts
using complex technology-specific structures. To perform conversion of such structures to and
from standard XML format, the following modules are required.
Module for Adobe Flash Testing
Module for Silverlight Testing
Module for GWT Testing
With the help of these modules you will be able to parameterize any session-specific values
appearing in the test of an application using the corresponding technology.
It is very easy to find out if you need a specific module to test your web application. When you
finish recording a test with WAPT, it will show you a warning message with recommendations.
Each of the modules is provided with a separate installation package, but the integration is very
smooth. You only need to install the module to the same system where you run WAPT or WAPT
Pro workplace.
17. Load testing with WAPT: Quick Start Guide
17
The use of JavaScript*
You can insert execution of your JavaScript inside the user sessions. This may be necessary to
calculate session-specific values in complex cases when this cannot be done with the help of the
standard functions available in WAPT.
Select the request after which you want to insert a JavaScript code. Choose “Add |
JavaScript” on the toolbar. The JavaScript operator will be added to the profile. Select it to edit
the code in the right view. Initially the edit window contains a comment with a short instruction on
how to use this feature.
In your code you can use functions defined in the WAPT Pro JavaScript library. Click the
“JavaScript Library” button to extend it by adding more files.
Click the “Check Syntax” button to check your code. The result will be displayed in the
“Output” window.
Note that JavaScript code can be used only to calculate values and assign results to some
variables. You can use the assigned variables in subsequent requests. However you cannot
initiate new requests directly from the code.
There is another way to use JavaScript in your profiles. You can call functions defined in the
JavaScript library directly when you specify how to calculate values for the request parameters
and variables. You can do this with the help of a special internal function called “JavaScript”. It
takes the actual name of the function you want to call as an argument.
* Available only in Pro version
18. Load testing with WAPT: Quick Start Guide
18
Performance counters*
In addition to the client-side metrics, such as response time, WAPT Pro can collect performance
information directly from the servers running the application being tested. This information is
added to the test report along with other parameters. You can also see it on graphs.
Expand the “Performance Counters” item in the left view. You will see the counters
grouped by the interface type.
- SNMP is common for all types of UNIX systems; it can be enabled on Windows as well;
- WMI is native for Windows servers;
- ODBC is used to monitor database performance;
- Apache is specific for Apache web server.
Right-click an interface type in the tree view and select the “New server” command from the
menu.
You can use a number of predefined performance counters. Right-click the server name in
the tree view and select the “Add counters from repository” option. Check the counters in the
dialog and click the “Add counters” button.
You can also add your own counter for any specific value provided by your server through the
supported interfaces. Right-click the server name in the tree view and select the “New custom
counter” option. For each counter you should specify a JavaScript function that will retrieve the
counter value. You can use the default counters as examples.
Click the “Test” button in the server properties to check that the counter retrieval works
properly.
* Available only in Pro version
19. Load testing with WAPT: Quick Start Guide
19
x64 Load Engine*
The functionally of the x64 Load Engine is identical to the functionality of the regular load agent
that comes with WAPT Pro. However the engine has much higher capacity. Regular agent can
create about 2,000 virtual users in an average test. This means that for a 10,000 users load you
would need to use 5 systems with agents. In most cases you can replace them with a single
instance of the x64 Load Engine.
A much higher engine capacity is achieved because of its native 64 bit architecture. You can
setup the engines on several systems and use them concurrently to create greater test volume.
The engine can be installed on any system with 64 bit Windows OS starting from Windows XP.
Note that the product is not included in the standard WAPT Pro installation package and should
be downloaded separately.
The engine runs as a system service. It can be launched and managed from the Load Engine
Manager available under the Start menu on the system where the engine is installed. By default
this service is launched automatically, so you can start using it immediately after the installation.
There is no need to restart it manually after the system reboot.
* Compatible only with Pro version