Downloaded 461 times


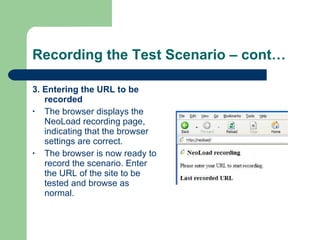


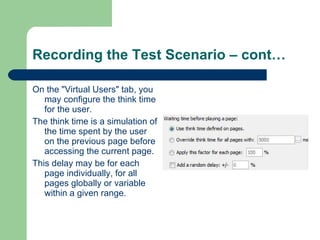

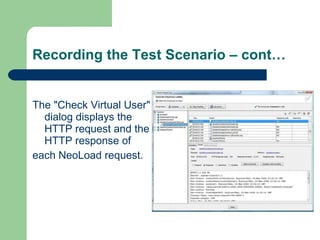

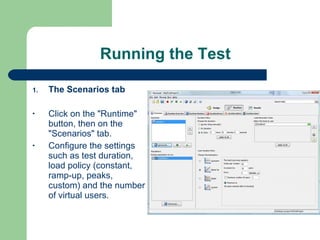


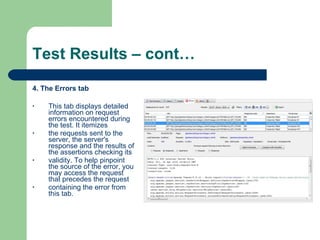


NeoLoad is a load testing tool that allows users to record browser sessions, define virtual users and test scenarios, run load tests, and analyze results. The document provides an overview of NeoLoad and guides users through setting up and running a sample load test in 3 main steps: recording a test scenario, running the test, and analyzing results. Key features of NeoLoad discussed include recording browser sessions, configuring virtual users and populations, running tests while monitoring performance, and filtering and graphing results.