- Wal-Mart reported record second quarter earnings for fiscal year 2009, with net sales increasing 10.4% to $101.6 billion and income from continuing operations increasing 9.3% to $3.385 billion.
- Comparable store sales in the US increased 4.5% for the quarter without fuel and 5.0% with fuel.
- The company raised its full-year earnings forecast to between $3.43 to $3.50 per share based on solid operating performance and capital efficiency in the first half of the year.
wal mart store Quarterly Earnings Releases2008finance1
Wal-Mart reported record sales and earnings for the fourth quarter and full fiscal year of 2008. Fourth quarter sales reached $106.3 billion, an 8.3% increase over the previous year. Net income increased 4% to $4.1 billion compared to $3.9 billion last year. For the full fiscal year, sales increased 8.6% to $374.5 billion and net income grew 5.8% to $12.9 billion. The company expects continued earnings growth in fiscal year 2009, forecasting earnings per share between $3.30-$3.43.
- Walmart reported record second quarter earnings for fiscal year 2009, with net sales of over $101.6 billion, a 10.4% increase from the previous year, and income from continuing operations of $3.385 billion, a 9.3% increase.
- The company raised its full-year earnings forecast, expecting earnings per share from continuing operations to be between $3.43 to $3.50, up from a previous range.
- For the third quarter of fiscal year 2009, the company estimates comparable store sales in the US to increase between 1-2% and earnings per share to be between $0.73-$0.76.
Wal Mart Store Financial ResultsNovember 12/04/08finance1
Walmart reported sales figures for November 2008. Overall sales increased 1.6% compared to November 2007. Walmart US sales increased 6.5% due to positive traffic and average ticket increases. Sam's Club sales increased 1.4% driven by fresh foods and consumables, though fuel price declines reduced comparable sales by 3%. International sales declined 11% due to currency fluctuations but increased 7.7% excluding currency effects. Walmart expects December comparable sales to be near the high end of 1-3% guidance.
Wal-Mart reported sales results for the 5-week and 35-week periods ending October 5, 2007. Comparable store sales increased 0.8% for Wal-Mart Stores and 4.4% for Sam's Club in the US. Internationally, the UK, Brazil, and China saw continued growth while Mexico slowed. Based on the sales results, Wal-Mart raised its quarterly earnings guidance from $0.62-0.65 to $0.66-0.69 per share.
- Wal-Mart reported third quarter fiscal year 2009 results, with net sales increasing 7.5% to $97.6 billion and income from continuing operations increasing 6.6% to $3.03 billion compared to the previous year.
- US comparable store sales increased 2.7% for Walmart and 4.5% for Sam's Club. International sales grew 11.2% and segment operating income increased 10.6%.
- For the full fiscal year, Wal-Mart estimates diluted earnings per share will be between $3.42-$3.46, lowered from previous guidance due to currency exchange rate impacts.
Wal-Mart reported second quarter sales of $91.99 billion, an 8.8% increase over the previous year. Net income was $3.11 billion, a 4.1% increase. Earnings per share were $0.76. For the third quarter, Wal-Mart estimates comparable store sales will increase 1-3% and earnings per share will be $0.62-$0.65. For the full fiscal year, earnings per share are estimated at $3.05-$3.13.
The weekly economic update from Major League Investments provides the following information:
- Job growth increased in July with 163,000 new jobs added, though the unemployment rate ticked up to 8.3%.
- Personal incomes rose but consumer spending was flat, and the personal savings rate increased.
- Home prices rose 2.2% in May according to the S&P/Case-Shiller Home Price Index.
- The manufacturing sector contracted again according to the ISM manufacturing index.
Questions For Management And Directors, A Roadmap For Expansion And Growthharrylong
Fremont Michigan Insuracorp provides property and casualty insurance in Michigan. While it has a strong balance sheet and growing book value, its personal lines have become unprofitable despite growing premiums. The document raises concerns about this and questions what management is doing to address the issue. It suggests management should take actions like ranking agencies by losses, stopping credit scoring, and expanding operations outside of Michigan to improve profitability.
Owens & Minor is the leading distributor of medical and surgical supplies in the US. In 2001, the company grew sales by 9% while maintaining a gross margin of 10.7% and improving earnings per share to $1.03 excluding unusual items. The company strengthened its balance sheet by refinancing debt and increased business with group purchasing organization customers using its CostTrack pricing model. Owens & Minor focuses on service, partnerships, consistency and using technology like WISDOM to meet customer needs, positioning it for continued leadership in the evolving healthcare supply chain.
Unum Group reported first quarter 2008 results, with operating income increasing 19% compared to first quarter 2007. Risk trends remained favorable across all operating segments. The company increased its full year 2008 operating earnings guidance to a range of $2.37 to $2.42 per diluted share, up from previous guidance. Favorable claims experience in most business lines drove increases in operating income despite volatile market conditions.
The document provides an 11-year financial summary of Wal-Mart Stores, Inc. from 1995 to 2005, showing key metrics such as net sales, operating expenses, net income, and earnings per share grew at a compound annual growth rate of around 15%. It also includes projections for financial statements such as the income statement and balance sheet from 2006 to 2010, with assumptions around revenue, expense, and capital expenditure growth rates.
Mercer Capital's Value Focus: Convenience Store Industry | Q1 2016 | Segment:...Mercer Capital
Mercer Capital’s Convenience Store Industry newsletter is a quarterly publication providing perspective on valuation issues pertinent to multi-unit retailing and QSR industries.
Avery Dennison reported its third quarter 2008 results. Revenue increased 3% to $1.72 billion due to currency effects, but organic revenue declined 2% due to slowing economic conditions. Operating income declined 6% to $96 million due to margin pressure from rising raw material costs outpacing price increases. For 2008, the company lowered its earnings guidance to $2.65-2.85 per share due to further weakening expected in Q4 from inventory reductions and economic uncertainty. It expects record free cash flow of $375 million despite the challenges.
Unum Group reported financial results for the third quarter of 2008. While net income was $108.0 million, this included realized investment losses of $108.9 million. Excluding these losses, after-tax income was $216.9 million. The group disability benefit ratio continued trending downward. Across segments, Unum US saw increases in operating income for disability and voluntary lines, while UK saw a decrease in operating income of 4.9% compared to the prior year. Overall the company demonstrated continued strong performance across core segments and a strong capital position is being maintained despite challenges in the current economic environment.
Piaggio Group reported a 3.3% increase in net sales to €351.7 million for the first quarter of 2011 compared to the same period last year. EBITDA grew 6.1% to €33.7 million, representing a 9.6% margin. Net income increased 4.1% to €3 million, maintaining an 0.8% margin on sales. Volumes were up 3.7% overall to 149,000 units sold, with strong growth in the Commercial Vehicles India segment.
This document provides an overview of TIM Participacoes S.A.'s 4Q08 results and the competitive Brazilian telecommunications market. It shows that in 4Q08, TIM's subscriber base grew 22% year-over-year to 36.4 million mainly due to pre-paid growth, while post-paid lines declined 3%. Revenue increased 5.1% in 2008. The document also outlines the large and growing Brazilian mobile market, noting high churn rates and increasing competitive pressures as the fourth mobile number portability program launches in 2009.
Mercer Capital's Value Focus: Convenience Store Industry | Q2 2015 | Segment:...Mercer Capital
Mercer Capital’s Convenience Store Industry newsletter is a quarterly publication providing perspective on valuation issues pertinent to multi-unit retailing and QSR industries.
The New River Valley real estate market continues a slow but steady recovery, according to the document. While sales increased slightly year-over-year in Q3 2012, inventory levels dropped significantly across all categories. Lower inventory levels are key to a balanced market and increased buyer confidence. The recovery is expected to continue gradually as inventory falls and interest rates remain low, though an anticipated spike in inventory in spring 2013 could slow progress if it causes levels to rise too much.
The document provides an economic update for the week of July 30, 2012. Key points include:
- Consumer sentiment improved slightly but remains at a 2012 low. New and pending home sales declined in June from the previous month but were up from a year ago.
- Second quarter GDP growth was the slowest since late 2011. Durable goods orders unexpectedly increased in June.
- Stocks had their best three-day period of the year last week amid hopes that the ECB would take action to support the euro. The Dow, Nasdaq, and S&P 500 all rose around 2% for the week.
- US and Asian stock futures fell, while European stocks dropped, as concerns over global growth weighed on investor sentiment.
- Aecon Group reported a 143% rise in quarterly earnings due to lower costs and margin improvements.
- Canadian Tire reported higher-than-expected quarterly revenue and profit helped by strong demand for apparel and home products.
Digital Marketing Now: 7 Strategies for Surviving the DownturnAustin AMA
David Lankelevich of E Marketer presented Seven Strategies for Surviving the Downturn at the Austin American Marketing Association (AMA) monthly Power Lunch Series on January 15, 2009.
Interested in more marketing programs and networking? Visit the Austin American Marketing Association website (www.austinama.org) for coming events and the AMA blog (www.austinama.org/blog) to be a part of the conversation.
The document summarizes AutoZone's 2008 annual stockholders' meeting. It discusses AutoZone's position as the largest auto parts retailer in the US, with over $6.5 billion in annual sales. It highlights AutoZone's strategic priorities of growing its US retail and commercial segments, expanding in Mexico, and growing its ALLDATA business. The document also reviews AutoZone's strong financial performance in recent years and its focus on continued sales growth, improving customer satisfaction, and managing costs.
This document provides a summary and analysis of 2011 ABC Fas-Fax reports for 502 newsstand titles. Key findings include:
- Overall newsstand units and dollars declined over 11% from 2010 to 2011, shedding 78 million units and $300 million in retail dollars.
- Fully 80% of titles posted losses in both units and retail dollars sold, the lowest ratio of gainers to decliners on record.
- Weekly, mens, and automotive categories fared poorly while womens, home, and food categories declined less severely.
- Celebrity weeklies, a historically strong category, suffered double-digit losses for the third consecutive year, with units down nearly 30 million (-14%) and
1) Smithfield Foods is the world's largest pork processor and hog producer, with $11 billion in revenues in 2006. It processes 27 million hogs annually, representing 26% of the US market.
2) Joseph Luter will step down as CEO on August 31, 2006 after 31 years, but will remain as chairman. C. Larry Pope will become the new CEO.
3) In fiscal 2006, Smithfield Foods reported income from continuing operations of $180.3 million, down from record net income of $296.2 million the previous year, due to an oversupply of protein in the US marketplace in the fourth quarter.
CSU's card base and managed accounts continued to outperform market growth between 2007 and 2008. CSU's gross revenue increased 11.3% to R$101.2 million in 3Q08, driven by growth at CardSystem and MarketSystem. EBITDA increased 40.8% to R$16.7 million in 3Q08 due to growth in payment processing and management services. CSU reduced its net debt from R$98 million to R$95.2 million in 3Q08 through cash generation and debt repayment.
This document is the 2003 Annual Report, Notice of Annual Meeting, and Proxy Statement for Bed Bath & Beyond Inc. It includes the following:
1) A letter to shareholders from the co-chairmen and CEO thanking shareholders and associates for the company's success in fiscal year 2003 and outlining plans for continued growth.
2) Selected financial data showing the company's strong growth over the past 12 years as a public company, including a 32.2% increase in net earnings in fiscal 2003.
3) Notice of the upcoming annual meeting and instructions for electronic voting and accessing annual reports online to save the company money on printing and mailing costs.
4) A management discussion and analysis section outlining
Wal-Mart reported its sales figures for March 2007. Total sales were $30.675 billion, an 11.7% increase from March 2006. Comparable store sales increased 4% in the US. For April 2007, Wal-Mart expects comparable sales in the US to be flat to down 2% due to the shift in Easter and strong sales in April 2006. Earnings per share for the first quarter of fiscal year 2008 are estimated to be between $0.68 to $0.71.
This document summarizes ConocoPhillips' consolidated income statement and income by segment for 2007 and 2008. In 2007, the company reported total revenues of $194.5 billion and net income of $11.9 billion. However, impairment charges related to expropriated assets in the International E&P segment resulted in a net loss for that segment. In 2008, total revenues increased to $201.3 billion and net income grew to $14.8 billion, with the International E&P segment returning to profitability. The U.S. E&P and R&M segments were the largest contributors to income in both years.
This document provides financial and operational results for AT&T across several business segments. Key highlights include:
- Wireless operating revenues increased 6% to $49.3 billion in 2008, with segment income increasing 58% to $10.8 billion. The number of wireless customers grew 5% to over 77 million.
- Wireline operating revenues declined 2% to $69.9 billion while segment income declined 7% to $11.2 billion in 2008 compared to 2007.
- Advertising & Publishing operating revenues declined 6% to $5.5 billion in 2008, with segment income declining 20% to $1.7 billion.
- ConocoPhillips reported revenues of $34.7 billion for Q3 2004, up from $26.5 billion in Q3 2003, and net income of $2 billion, up from $1.3 billion.
- Earnings per share for Q3 2004 were $2.86, up from $1.90 in Q3 2003.
- Oil and gas production volumes were up slightly from Q3 2003, with crude oil production of 733 thousand barrels per day consolidated and 844 thousand barrels per day total.
- ConocoPhillips reported revenues of $47.9 billion for Q1 2006, up 23% from $38.9 billion in Q1 2005, with net income of $3.29 billion, up 13% from $2.91 billion.
- Oil and gas production increased from Q1 2005, with oil production up 777 thousand barrels per day, and gas production up 3.55 billion cubic feet per day.
- Refining and marketing sales volumes also increased compared to Q1 2005, with US refinery crude oil runs up 1.84 million barrels per day from 1.96 million.
This document summarizes Chevron's fourth quarter 2008 earnings conference call. It discusses Chevron's Q4 2008 earnings of $4.9 billion and earnings per share of $2.44. It also provides details on Chevron's 2008 return on capital employed, debt ratio, and share repurchases. The document reviews Chevron's Q4 2008 earnings performance across its upstream, downstream, and other segments and discusses its 2009 capital and exploratory budget and production outlook.
This document provides consolidated income statements and cash flow information for 2007 and the first quarter of 2008 for an oil and gas company. It summarizes revenues, expenses, income by business segment, tax rates, certain items included in net income, and cash flows. For 2007, the company reported total revenues of $194.5 billion, net income of $11.9 billion, and net cash provided by operating activities of $11.9 billion. For the first quarter of 2008, total revenues were $56.6 billion and net income was $4.1 billion.
Chevron reported record third quarter earnings of $7.9 billion, more than double the third quarter of 2007 earnings. Higher crude oil and natural gas prices contributed to strong upstream performance, while improved margins and minimal refinery downtime benefited downstream operations. Total production for 2008 is estimated to be 2.55 million barrels per day, though hurricanes Gustav and Ike disrupted about 35,000 barrels per day of production. Fourth quarter production is forecast to be 2.62 million barrels per day as major projects come online.
ConocoPhillips reported financial results for the third quarter and first nine months of 2005:
- Revenues for the quarter increased to $49.7 billion, up from $34.7 billion in the same period last year, driven by higher oil and gas prices. Net income was $3.8 billion compared to $2 billion last year.
- For the first nine months of the year, revenues were $131.2 billion compared to $96.8 billion last year. Net income was $9.85 billion compared to $5.7 billion in the same period of 2004.
- Oil and gas production for the quarter averaged 790 thousand barrels of oil equivalent per day for
- ConocoPhillips reported significantly higher revenues and net income for both the fourth quarter and full year 2004 compared to the same periods in 2003, driven by higher oil and gas prices and increased production volumes.
- Revenues for the fourth quarter of 2004 were $40.1 billion, up 54% from $26 billion in the fourth quarter of 2003. Net income for the fourth quarter was $2.4 billion, up 138% from $1 billion.
- For the full year 2004, revenues were $136.9 billion compared to $105.1 billion in 2003. Net income was $8.1 billion compared to $4.7 billion in 2003.
This 11-year financial summary provides key financial metrics for Walmart from 1991-2001. Some key points:
- Net sales increased each year, growing 16% in 2001 to $191 billion, driven by domestic and international expansion as well as a 5% increase in comparable store sales.
- Operating expenses increased slightly as a percentage of sales in 2001 due to higher maintenance, repair and depreciation costs. Gross margins remained relatively steady.
- Interest costs increased in 2001 and 2000 due to higher debt levels resulting from the acquisition of ASDA in 2000.
- Net income grew 16% in 2001 to $6.3 billion, with basic earnings per share reaching $1.41.
Chevron 2008 JPMorgan Annual Energy Symposium: Heavy Oil finance1
Gary Luquette, President of North America Exploration and Production at Chevron, presented at the JPMorgan Annual Energy Symposium on Heavy Oil. Chevron has a large global heavy oil portfolio and is focused on becoming a leader in developing and producing heavy oil resources. Chevron utilizes new technologies, builds organizational capabilities, and transfers knowledge across its operations to maximize production from its extensive heavy oil assets around the world.
This document provides financial and operational results for AT&T's wireless segment. Some key highlights include:
- Wireless operating revenues for 2008 were $49.3 billion, up 15.6% from 2007. Segment income was $10.8 billion for 2008, up 58.5% from 2007.
- As of December 31, 2008, AT&T had 77 million wireless customers, up 10.4% from a year earlier. Postpaid subscribers totaled 60.1 million in Q4 2008.
- Wireless data revenues in Q4 2008 were $3.1 billion, up 51.7% year-over-year, reflecting increased data usage and adoption of smartphones.
The document is a notice and proxy statement for General Electric's 2002 Annual Meeting. It provides details about the meeting such as the date, time, and location in Waukesha, Wisconsin. It also lists the items to be voted on including the election of directors, appointment of auditors, executive compensation plans, and eight shareholder proposals. Biographies are provided for the 16 nominees up for election to the board of directors.
AT&T reported strong third quarter results in 2008, highlighted by growth in wireless subscribers and revenues. They gained 2 million new wireless subscribers total, with a record 1.7 million postpaid additions. This growth was powered by 2.4 million activations of the new iPhone 3G and rapid adoption of wireless data services. AT&T also grew its U-verse TV subscriber base to 781,000 and saw stable trends in business services. However, earnings were reduced by costs associated with the iPhone launch and hurricane-related expenses.
The 2004 Burlington Resources annual report discusses the company's strong financial and operational performance in 2004 and outlook for 2005. Some key points:
- Burlington reported record financial results in 2004, including $1.527 billion in net income and a 12% increase in production to 2,817 MMCFE/day.
- The company replaced 125% of its 2004 production at a low finding cost of $1.27/MCFE and increased total reserves to 12.0 TCFE.
- Burlington expects to continue growing production 3-8% annually in 2005 through investment in its core asset base focused on North America.
- Challenges include continually upgrading the drilling inventory
The document announces the annual meeting of shareholders of Wal-Mart Stores, Inc. to be held on June 6, 2003. The purposes of the meeting are to elect directors, vote on approval of an amended management incentive plan, ratify the appointment of an independent accounting firm, and act on seven shareholder proposals. Shareholders as of April 8, 2003 are entitled to vote. The document provides details on voting procedures and proxies.
The document is a notice and proxy statement for General Electric's 2006 Annual Meeting. It provides details on the meeting such as the date, time, and location in Philadelphia. It lists 15 nominees for election to the board of directors and provides brief biographies for each. It also lists several matters that will be voted on including the election of directors, ratification of the independent auditor, and six shareholder proposals.
Wal Mart Store Financial ResultsMay 06/05/08finance1
Wal-Mart reported a 9.8% increase in total net sales for the four-week period ending May 30, 2008 compared to the same period the previous year. Comparable store sales increased 4.0% for Wal-Mart Stores, 6.5% for Sam's Club, and 4.4% for total US stores. Internationally, sales grew strongest in the UK, Brazil, and China. For the upcoming five-week period in June, Wal-Mart estimates comparable store sales in the US to increase between 2-4%, excluding fuel.
Wal Mart Store Financial ResultsDecember 01/08/09finance1
Walmart reported net sales figures for December and year-to-date. International sales decreased 10.4% due to currency impacts but increased 8.3% excluding currency. Comparable store sales increased for Walmart US and total US but decreased for Sam's Club. Fourth quarter earnings are expected to be lower than previously estimated due to softer sales at Sam's Club and International as well as higher expenses.
Wal-Mart reported third quarter sales of $90.9 billion, an 8.8% increase over the prior year. Net income was $2.86 billion. Comparable store sales in the US increased 1.5% with fuel and 1.4% without. For the fourth quarter, Wal-Mart estimates US comparable store sales will be flat to up 2% and earnings per share will be between $0.99-$1.03.
wal mart store Quarterly Earnings Releases2008finance1
Wal-Mart reported third quarter sales of $90.9 billion, an 8.8% increase over the prior year. Net income was $2.86 billion. Comparable store sales in the US increased 1.5% with fuel and 1.4% without. For the fourth quarter, Wal-Mart estimates US comparable store sales will be flat to up 2% and earnings per share will be between $0.99-$1.03.
Wal-Mart reported its sales figures for October and the first 39 weeks of the fiscal year. Total sales increased 8.4% to $27.92 billion for the 4-week period and increased 8.6% to $269.81 billion for the 39-week period compared to the same periods last year. Comparable store sales increased 0.0% for Walmart stores and 2.7% for Sam's Club in the US for the 4-week period. The company expects US comparable store sales to be between flat and up 2% for the upcoming November period.
- The Progressive Corporation reported strong financial results for the second quarter and first half of 2005, with net premiums written growth of 8% and an underwriting margin of 85.6%.
- Progressive saw growth in both new customers and retention of existing customers, with policies in force up 7-16% across business lines.
- Strategic initiatives around the Drive and Progressive Direct brands, expanded claims service centers, and technology projects were progressing well in the first half of the year.
- The Progressive Corporation reported strong financial results for the second quarter and first half of 2005, with net premiums written growth of 8% and an underwriting margin of 85.6%.
- Progressive saw growth in both new customers and retention of existing customers, with policies in force up 7-16% across business lines.
- Strategic initiatives around claims handling, branding, and technology were making progress, including expanding the number of claims service centers, deploying new customer billing and claims management platforms, and breaking ground on a new data center.
- The Progressive Corporation reported financial results for the third quarter of 2006, with net income increasing 34% over the third quarter of 2005.
- However, the CEO noted growth is lagging expectations and retention of existing customers, not just acquiring new customers, will be a key focus going forward.
- Some initiatives to improve retention include potentially lowering rates to retain price-sensitive customers, improving customer service, and offering homeowners insurance.
- For the quarter, the combined ratio was 87.3% versus 90.4% for the third quarter of 2005, indicating continued strong underwriting performance.
- The Progressive Corporation reported financial results for the third quarter of 2006, with net income increasing 34% over the third quarter of 2005.
- However, the CEO noted growth was lagging expectations and retention of existing customers, not just acquiring new customers, would be a strategic focus going forward.
- Some initiatives to improve retention included potentially lowering rates, improving customer service and satisfaction, and offering homeowners insurance through partnerships.
- For the quarter, the combined ratio was 87.3% versus 90.4% the prior year, demonstrating continued strong underwriting performance.
- The Progressive Corporation reported net income of $84 billion for the second quarter of 2006, a slight increase from $81 billion in the same period in 2005.
- Growth in new policies and premiums written was lower than expected at 2% due to softer market pricing conditions and increased competition.
- The combined ratio for the quarter was 86.6%, excellent and only 0.5 points higher than the prior year, demonstrating continued strong profitability.
The Progressive Corporation reported financial results for the second quarter of 2006, with net premiums written growing 2% over the same period in 2005. While profits remained strong, with an underwriting margin of 14.1%, growth was lower than expected. Progressive saw the greatest growth challenges in their Drive brand within the independent agency channel. They are also seeing a shift to more customers researching and initiating quotes online rather than by phone. Commercial auto grew policies by 9% in the quarter. Progressive aims to balance further profitability and growth by enhancing their brands and marketing to attract more customers in all channels.
Wal Mart Store Financial ResultsFebruary 03/07/08finance1
Wal-Mart reported an 8.9% increase in total net sales for the four-week period ending February 29, 2008 compared to the same period the previous year. Comparable store sales increased 2.6% in the US and international sales increased 19.8%. Strength was seen in grocery, health and wellness, and entertainment categories in the US. The company estimates comparable store sales in the US to be flat to up 2% for the upcoming five-week period.
The Progressive Corporation reported financial results for the first quarter of 2006, with the following key highlights:
- Net premiums written increased 2% compared to the first quarter of 2005.
- Net income was $436.6 million, up 6% from the prior year.
- The combined ratio was 85.9%, relatively unchanged from the prior year.
- Policies in force grew 2% for Drive Insurance and 8% for Progressive Direct.
QLT Inc. reported financial results for the first quarter of 2009, with total revenue up 12.7% from the previous year. Revenue from drug Eligard increased 24.5% due to higher sales and royalties. Revenue from drug Visudyne was down slightly despite a 23.9% drop in sales. Operating income was $5.5 million compared to an operating loss of $8.9 million in the previous year, driven by lower operating expenses and higher Eligard revenue. Earnings per share was $0.02 compared to a $0.14 loss per share in the previous year.
The Progressive Corporation reported its financial results for the third quarter of 2005. Net premiums written increased 7% year-over-year to $10.8 billion. The combined ratio was strong at 90.4% despite losses from Hurricanes Katrina and Rita totaling $185 million. Progressive responded quickly to Katrina, resolving over 90% of claims by the end of October. The company also began offering auto insurance in New Jersey during the quarter.
Raytheon reported strong financial results for the third quarter of 2008, with sales up 12% and earnings per share up 17%. The company increased its full-year earnings guidance and announced a new $2 billion share repurchase plan. All of Raytheon's business segments experienced sales growth in the quarter.
This document provides information from Fannie Mae's 2008 Q3 10-Q Credit Supplement. It includes tables and analysis on Fannie Mae's single-family mortgage credit book of business, including details by key product features, state, vintage, and delinquency rates. It also provides forecasts for future home price declines in 2008 and from peak to trough, expected to be in the upper end of estimated ranges of 7-9% and 15-19%, respectively.
The Progressive Corporation corrected a footnote in its October 10, 2008 earnings release. The footnote regarding preferred stocks was incorrect, reversing the amounts for redeemable and nonredeemable preferred stock. All other numbers in the earnings release and condensed balance sheet were correct as originally stated. In September, Progressive reported a net loss of $630.8 million compared to net income of $103.8 million in September 2007, largely due to $1.039 billion in write-downs on securities. Total policies in force increased 1% to over 10.5 million compared to September 2007.
Similar to wal mart store Quarterly Earnings Releases2009 (20)
AT&T reported strong first quarter 2008 results with consolidated revenue growth of 4.6% year-over-year, led by improved results in wireless and enterprise services. Wireless revenues increased 18.3% due to strong subscriber gains and growth in wireless data services, and AT&T added 1.3 million wireless subscribers. Enterprise revenues grew led by a 22.9% increase in IP-based data services. Adjusted earnings per share grew 13.8% over the first quarter of 2007, highlighting AT&T's 12th consecutive quarter of double-digit earnings growth.
AT&T reported solid second quarter results in 2008, with key highlights including:
- Wireless revenues grew 15.8% driven by subscriber gains and 52% growth in wireless data services. Total wireless subscribers increased by over 1.3 million.
- Wholesale customer revenue declines improved, with revenues down just 0.2% versus a year ago.
- EPS was $0.63, up from $0.47 a year ago, while adjusted EPS was $0.76, up from $0.70 a year ago.
AT&T reported fourth quarter and full year 2008 results, highlighting strong wireless subscriber gains, accelerated growth of U-verse TV subscribers passing 1 million, and continued double-digit growth in IP data services. Wireless revenues grew 13.2% in Q4 2008 led by a 51.2% increase in wireless data revenues. AT&T added 2.1 million wireless subscribers in Q4 2008 and accelerated its U-verse TV ramp with 264,000 new subscribers. For the full year 2008, AT&T reported revenues of $124 billion, net income of $12.9 billion, and earnings per share increased 11.3% over 2007.
This document is a notice and proxy statement for the 2000 Annual Meeting of Share Owners of General Electric Company. It provides information on items to be voted on at the meeting, including the election of 16 directors, appointment of independent auditors, a proposal to increase authorized shares for a 3-for-1 stock split, and 11 shareholder proposals. Brief biographies of the 16 nominees for director positions are also included.
This document is a notice and proxy statement for General Electric Company's 2001 Annual Meeting. It provides information on the date, time, and location of the meeting, as well as details on voting procedures. Shareholders will vote on electing directors, appointing independent auditors, and seven shareholder proposals relating to issues such as cumulative voting, workplace codes of conduct, and nuclear power reporting. Biographies of the 19 nominees for director positions are also included.
The document is a notice and proxy statement for General Electric's 2003 annual shareholder meeting. It provides details on the meeting such as date, time, location, and items to be voted on including election of directors and appointment of auditors. It also includes biographies of the 17 nominees for election to the board of directors.
The document is a notice and proxy statement for General Electric's 2004 Annual Meeting. It notifies shareholders that the meeting will be held on April 28, 2004 in Louisville, Kentucky at 10:00am to vote on the election of directors, ratification of the independent auditor selection, adding a revenue measurement to executive performance goals, and 15 shareholder proposals. Shareholders of record as of March 1, 2004 are entitled to vote.
The document is a notice and proxy statement for General Electric's 2005 Annual Meeting. It provides information on the date, time, and location of the meeting in Cincinnati, Ohio. It lists 15 nominees for election to the board of directors and provides brief biographies for each nominee. It also lists several matters that will be voted on at the meeting, including the election of directors, ratification of the independent auditor, and seven shareholder proposals.
This document provides preliminary financial highlights and operating metrics for ConocoPhillips for the first quarter of 2004 compared to the first quarter of 2003. Some key figures include:
- Total revenues of $30.2 billion for the first quarter of 2004, up from $27.1 billion in the same period of 2003.
- Net income of $1.6 billion for the first quarter of 2004, up from $1.2 billion in the first quarter of 2003.
- Oil and gas production of 941 thousand barrels per day for the first quarter of 2004, up slightly from 935 thousand barrels per day in the same period of 2003.
ConocoPhillips reported financial highlights for the second quarter of 2004 including revenues of $31.9 billion and net income of $2.1 billion. Earnings per share were $3.01 for the quarter. The company experienced higher crude oil and natural gas sales prices and volumes compared to the prior year. However, costs and expenses also increased, including purchases of crude oil and products, production and operating expenses, and taxes.
This document provides financial highlights and selected financial data for ConocoPhillips for the first quarter of 2005 compared to the first quarter of 2004. Some key figures include:
- Net income for Q1 2005 was $2.912 billion compared to $1.616 billion in Q1 2004.
- Income from continuing operations was $2.923 billion in Q1 2005 compared to $1.603 billion in Q1 2004.
- Total worldwide crude oil and natural gas production was 942 thousand barrels of oil equivalent per day in Q1 2005.
- Total revenues for Q1 2005 were $38.918 billion compared to $30.217 billion in Q1 2004.
This document provides financial highlights and selected financial data for ConocoPhillips for the three month and twelve month periods ending December 31, 2005 and 2004. Some key details include:
- Revenues for the three months ending December 31, 2005 were $52.2 billion compared to $40.1 billion for the same period in 2004.
- Net income for the twelve months ending December 31, 2005 was $13.5 billion compared to $8.1 billion for the same period in 2004.
- Earnings per share (diluted) for continuing operations for the twelve months ending December 31, 2005 were $9.63 compared to $5.79 for the same period in 2004.
- ConocoPhillips reported revenues of $48.5 billion for the second quarter of 2006, up 14% from the same period in 2005. Net income was $5.2 billion, up 66% from $3.1 billion in 2005.
- Earnings per share increased to $3.09 per share from $2.21 per share in 2005. Production volumes increased across oil, natural gas, and natural gas liquids.
- Capital expenditures totaled $3.4 billion for the quarter, up 9% from 2005, primarily directed towards expanding E&P operations internationally and upgrading refineries.
- ConocoPhillips reported financial results for the third quarter and first nine months of 2006. Total revenues were $49.6 billion for Q3 2006 and $146 billion for the first nine months of the year.
- Net income was $3.9 billion for Q3 2006, comparable to $3.8 billion for the same period in 2005. For the first nine months, net income was $12.4 billion in 2006 compared to $9.9 billion in 2005.
- Earnings per share on a diluted basis were $2.31 for Q3 2006 and $7.78 for the first nine months of 2006.
This document provides financial highlights and operating data for ConocoPhillips for the fourth quarter and full year 2006 compared to 2005. Some key details:
- Revenues for Q4 2006 were $42.5 billion compared to $52.2 billion for Q4 2005. Full year revenues were $188.5 billion in 2006 versus $183.4 billion in 2005.
- Net income for Q4 2006 was $3.2 billion compared to $3.7 billion for Q4 2005. Full year net income was $15.6 billion in 2006 versus $13.5 billion in 2005.
- Average daily oil and gas production for Q4 2006 was 859 thousand barrels of oil equivalent for consolidated
This document provides financial highlights and operating data for ConocoPhillips for the first quarter of 2007 compared to the first quarter of 2006. Some key figures include:
- Net income of $3.546 billion in Q1 2007 compared to $3.291 billion in Q1 2006.
- Oil and gas production increased from the year-ago period, with crude oil production of 840 thousand barrels per day in Q1 2007 versus 777 thousand barrels per day in Q1 2006.
- Capital expenditures and investments totaled $2.847 billion in Q1 2007 compared to $4.514 billion in the same period of 2006.
This document provides financial highlights and selected financial data for ConocoPhillips for the third quarter and first nine months of 2007 compared to the same periods in 2006. Some key details include total revenues of $47.9 billion for the third quarter of 2007, net income of $3.7 billion, and cash flows from operating activities of $6 billion. Capital expenditures and investments totaled $2.6 billion for the third quarter.
ConocoPhillips reported financial highlights for Q4 2007 and full year 2007. Revenues for Q4 2007 were $54.3 billion compared to $42.5 billion for Q4 2006. Net income for Q4 2007 was $4.4 billion compared to $3.2 billion for Q4 2006. Earnings per share for Q4 2007 were $2.75 diluted compared to $1.91 diluted for Q4 2006. Cash flows from operating activities for 2007 were $24.6 billion compared to $21.5 billion for 2006. Capital expenditures for 2007 were $11.8 billion compared to $15.6 billion for 2006.
This document provides consolidated income statement and segment income information for ExxonMobil for 2007 and 2008. In 2007, ExxonMobil earned a net income of $11.9 billion, with the largest contributors being the Upstream (E&P) segments. Several large impairment charges in the International E&P segment resulted in a net loss for that segment. In 2008, ExxonMobil's net income increased to $9.6 billion for the periods reported, with the Upstream segments again contributing the most income. Certain items included large gains and impairments in various segments in both years.
“Amidst Tempered Optimism” Main economic trends in May 2024 based on the results of the New Monthly Enterprises Survey, #NRES
On 12 June 2024 the Institute for Economic Research and Policy Consulting (IER) held an online event “Economic Trends from a Business Perspective (May 2024)”.
During the event, the results of the 25-th monthly survey of business executives “Ukrainian Business during the war”, which was conducted in May 2024, were presented.
The field stage of the 25-th wave lasted from May 20 to May 31, 2024. In May, 532 companies were surveyed.
The enterprise managers compared the work results in May 2024 with April, assessed the indicators at the time of the survey (May 2024), and gave forecasts for the next two, three, or six months, depending on the question. In certain issues (where indicated), the work results were compared with the pre-war period (before February 24, 2022).
✅ More survey results in the presentation.
✅ Video presentation: https://youtu.be/4ZvsSKd1MzE
Navigating Your Financial Future: Comprehensive Planning with Mike Baumannmikebaumannfinancial
Learn how financial planner Mike Baumann helps individuals and families articulate their financial aspirations and develop tailored plans. This presentation delves into budgeting, investment strategies, retirement planning, tax optimization, and the importance of ongoing plan adjustments.
Budgeting as a Control Tool in Government Accounting in Nigeria
Being a Paper Presented at the Nigerian Maritime Administration and Safety Agency (NIMASA) Budget Office Staff at Sojourner Hotel, GRA, Ikeja Lagos on Saturday 8th June, 2024.
Discovering Delhi - India's Cultural Capital.pptxcosmo-soil
Delhi, the heartbeat of India, offers a rich blend of history, culture, and modernity. From iconic landmarks like the Red Fort to bustling commercial hubs and vibrant culinary scenes, Delhi's real estate landscape is dynamic and diverse. Discover the essence of India's capital, where tradition meets innovation.
Fabular Frames and the Four Ratio ProblemMajid Iqbal
Digital, interactive art showing the struggle of a society in providing for its present population while also saving planetary resources for future generations. Spread across several frames, the art is actually the rendering of real and speculative data. The stereographic projections change shape in response to prompts and provocations. Visitors interact with the model through speculative statements about how to increase savings across communities, regions, ecosystems and environments. Their fabulations combined with random noise, i.e. factors beyond control, have a dramatic effect on the societal transition. Things get better. Things get worse. The aim is to give visitors a new grasp and feel of the ongoing struggles in democracies around the world.
Stunning art in the small multiples format brings out the spatiotemporal nature of societal transitions, against backdrop issues such as energy, housing, waste, farmland and forest. In each frame we see hopeful and frightful interplays between spending and saving. Problems emerge when one of the two parts of the existential anaglyph rapidly shrinks like Arctic ice, as factors cross thresholds. Ecological wealth and intergenerational equity areFour at stake. Not enough spending could mean economic stress, social unrest and political conflict. Not enough saving and there will be climate breakdown and ‘bankruptcy’. So where does speculative design start and the gambling and betting end? Behind each fabular frame is a four ratio problem. Each ratio reflects the level of sacrifice and self-restraint a society is willing to accept, against promises of prosperity and freedom. Some values seem to stabilise a frame while others cause collapse. Get the ratios right and we can have it all. Get them wrong and things get more desperate.
13 Jun 24 ILC Retirement Income Summit - slides.pptxILC- UK
ILC's Retirement Income Summit was hosted by M&G and supported by Canada Life. The event brought together key policymakers, influencers and experts to help identify policy priorities for the next Government and ensure more of us have access to a decent income in retirement.
Contributors included:
Jo Blanden, Professor in Economics, University of Surrey
Clive Bolton, CEO, Life Insurance M&G Plc
Jim Boyd, CEO, Equity Release Council
Molly Broome, Economist, Resolution Foundation
Nida Broughton, Co-Director of Economic Policy, Behavioural Insights Team
Jonathan Cribb, Associate Director and Head of Retirement, Savings, and Ageing, Institute for Fiscal Studies
Joanna Elson CBE, Chief Executive Officer, Independent Age
Tom Evans, Managing Director of Retirement, Canada Life
Steve Groves, Chair, Key Retirement Group
Tish Hanifan, Founder and Joint Chair of the Society of Later life Advisers
Sue Lewis, ILC Trustee
Siobhan Lough, Senior Consultant, Hymans Robertson
Mick McAteer, Co-Director, The Financial Inclusion Centre
Stuart McDonald MBE, Head of Longevity and Democratic Insights, LCP
Anusha Mittal, Managing Director, Individual Life and Pensions, M&G Life
Shelley Morris, Senior Project Manager, Living Pension, Living Wage Foundation
Sarah O'Grady, Journalist
Will Sherlock, Head of External Relations, M&G Plc
Daniela Silcock, Head of Policy Research, Pensions Policy Institute
David Sinclair, Chief Executive, ILC
Jordi Skilbeck, Senior Policy Advisor, Pensions and Lifetime Savings Association
Rt Hon Sir Stephen Timms, former Chair, Work & Pensions Committee
Nigel Waterson, ILC Trustee
Jackie Wells, Strategy and Policy Consultant, ILC Strategic Advisory Board
Explore the world of investments with an in-depth comparison of the stock market and real estate. Understand their fundamentals, risks, returns, and diversification strategies to make informed financial decisions that align with your goals.
BIHC Briefing June 2024 from Bank+Insurance Hybrid Capital in association wit...
wal mart store Quarterly Earnings Releases2009
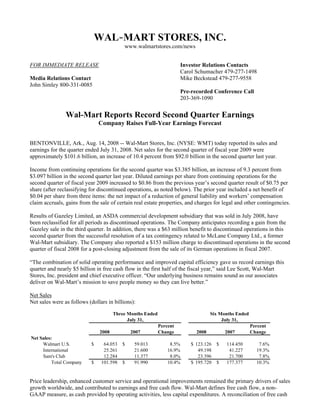
1. WAL-MART STORES, INC.
www.walmartstores.com/news
FOR IMMEDIATE RELEASE Investor Relations Contacts
Carol Schumacher 479-277-1498
Mike Beckstead 479-277-9558
Media Relations Contact
John Simley 800-331-0085
Pre-recorded Conference Call
203-369-1090
Wal-Mart Reports Record Second Quarter Earnings
Company Raises Full-Year Earnings Forecast
BENTONVILLE, Ark., Aug. 14, 2008 -- Wal-Mart Stores, Inc. (NYSE: WMT) today reported its sales and
earnings for the quarter ended July 31, 2008. Net sales for the second quarter of fiscal year 2009 were
approximately $101.6 billion, an increase of 10.4 percent from $92.0 billion in the second quarter last year.
Income from continuing operations for the second quarter was $3.385 billion, an increase of 9.3 percent from
$3.097 billion in the second quarter last year. Diluted earnings per share from continuing operations for the
second quarter of fiscal year 2009 increased to $0.86 from the previous year’s second quarter result of $0.75 per
share (after reclassifying for discontinued operations, as noted below). The prior year included a net benefit of
$0.04 per share from three items: the net impact of a reduction of general liability and workers’ compensation
claim accruals, gains from the sale of certain real estate properties, and charges for legal and other contingencies.
Results of Gazeley Limited, an ASDA commercial development subsidiary that was sold in July 2008, have
been reclassified for all periods as discontinued operations. The Company anticipates recording a gain from the
Gazeley sale in the third quarter. In addition, there was a $63 million benefit to discontinued operations in this
second quarter from the successful resolution of a tax contingency related to McLane Company Ltd., a former
Wal-Mart subsidiary. The Company also reported a $153 million charge to discontinued operations in the second
quarter of fiscal 2008 for a post-closing adjustment from the sale of its German operations in fiscal 2007.
“The combination of solid operating performance and improved capital efficiency gave us record earnings this
quarter and nearly $5 billion in free cash flow in the first half of the fiscal year,” said Lee Scott, Wal-Mart
Stores, Inc. president and chief executive officer. “Our underlying business remains sound as our associates
deliver on Wal-Mart’s mission to save people money so they can live better.”
Net Sales
Net sales were as follows (dollars in billions):
Three Months Ended Six Months Ended
July 31, July 31,
Percent Percent
2008 2007 Change 2008 2007 Change
Net Sales:
Walmart U.S. $ 64.053 $ 59.013 8.5% $ 123.126 $ 114.450 7.6%
International 25.261 21.600 16.9% 49.198 41.227 19.3%
Sam's Club 12.284 11.377 8.0% 23.396 21.700 7.8%
Total Company $ 101.598 $ 91.990 10.4% $ 195.720 $ 177.377 10.3%
Price leadership, enhanced customer service and operational improvements remained the primary drivers of sales
growth worldwide, and contributed to earnings and free cash flow. Wal-Mart defines free cash flow, a non-
GAAP measure, as cash provided by operating activities, less capital expenditures. A reconciliation of free cash
2. 2
flow for the first half of this fiscal year to the most directly comparable GAAP measure for the same period also
is available on a Form 8-K furnished today with the Securities and Exchange Commission and at
www.walmartstores.com/investors.
“We have improved customer traffic and ticket and overall sales growth in our markets,” Scott added. “While
inflation and higher fuel costs are pressuring suppliers, retailers and customers worldwide, we’re confident that
Wal-Mart is well-positioned for this economy.”
Segment Operating Income
Segment operating income for each operating segment, which is defined as income from continuing operations
before net interest expense, income taxes, unallocated corporate overhead and minority interest, was as follows
(dollars in billions):
Three Months Ended Six Months Ended
July 31, July 31,
Percent Percent
Change Change
2008 2007 2008 2007
Operating Income:
Walmart U.S.* $ 4.715 $ 4.256 10.8% $ 9.077 $ 8.235 10.2%
International 1.202 1.032 16.5% 2.244 1.908 17.6%
Sam's Club* 0.432 0.445 -2.9% 0.818 0.815 0.4%
* During the quarter ending July 31, 2007, the reduction of general liability and workers’ compensation accruals, gains from
the sale of certain real estate properties and charges for legal and other contingencies contributed, on a net basis, $265
million and $16 million of segment operating income of Walmart U.S. and Sam’s Club, respectively.
Comparable Store Sales
The Company reports comparable store sales in this earnings release based on the calendar months in the
quarters that ended July 31, 2008 and 2007. Comparable store sales for the United States were as follows:
Without Fuel With Fuel Fuel Impact
Three Months Ended Three Months Ended Three Months Ended
July 31, July 31, July 31,
2008 2007 2008 2007 2008 2007
Walmart U.S. 4.6% 1.2% 4.6% 1.2% 0.0% 0.0%
Sam's Club 3.7% 5.9% 7.2% 6.5% 3.5% 0.6%
Total U.S. 4.5% 1.9% 5.0% 2.0% 0.5% 0.1%
Without Fuel With Fuel Fuel Impact
Six Months Ended Six Months Ended Six Months Ended
July 31, July 31, July 31,
2008 2007 2008 2007 2008 2007
Walmart U.S. 3.7% 0.6% 3.7% 0.6% 0.0% 0.0%
Sam's Club 3.7% 5.3% 6.9% 5.4% 3.2% 0.1%
Total U.S. 3.7% 1.3% 4.2% 1.3% 0.5% 0.0%
3. 3
Guidance
“For the third quarter of fiscal year 2009, we estimate the Company’s comparable store sales increase in the
United States to be between one and two percent, which continues to reflect some sales volatility from week to
week,” said Tom Schoewe, Wal-Mart Stores, Inc. executive vice president and chief financial officer. “We
expect the Company’s earnings per share from continuing operations for the third quarter to be between $0.73
and $0.76 and are raising our current forecast for earnings from continuing operations for the full fiscal year to a
range of $3.43 to $3.50 per share.”
After this earnings release has been furnished to the SEC, a pre-recorded call offering additional comments on
the quarter will be available to all investors. Callers may listen to this call by dialing 203-369-1090. The
information included in this release and the pre-recorded phone call are available in the investor information area
on the Company’s Web site at www.walmartstores.com/investors.
Wal-Mart Stores, Inc. operates Walmart discount stores, supercenters, Neighborhood Markets and Sam’s Club
locations in the United States. The Company operates in Argentina, Brazil, Canada, China, Costa Rica, El
Salvador, Guatemala, Honduras, Japan, Mexico, Nicaragua, Puerto Rico and the United Kingdom and, through a
joint venture, in India. The Company's common stock is listed on the New York Stock Exchange under the
symbol WMT. More information about Wal-Mart can be found by visiting www.walmartstores.com. Online
merchandise sales are available at www.walmart.com and www.samsclub.com.
###
Ed. Note: The terms “Wal-Mart” and “Wal-Mart Stores” refer to the corporate entity. “Walmart,” expressed as
one word and without hyphenation, refers to the brand name of the Company’s U.S. operations. This distinction
came after the Company announced the introduction of a new logo for its U.S. store operations in June.
This release contains statements as to our management’s expectation regarding recording a gain from the sale of
Gazeley Limited in the third quarter of fiscal year 2009, our management’s belief that the Company is well-
positioned for this economy, our management’s expectations regarding the comparable store sales increase in the
United States in the third quarter of fiscal year 2009 and the Company’s expectations for its diluted earnings per
share from continuing operations for the third quarter of fiscal year 2009 and for all of fiscal year 2009 that Wal-
Mart believes are “forward-looking statements” within the meaning of the Private Securities Litigation Reform
Act of 1995, as amended. These statements are intended to enjoy the protection of the safe harbor for forward-
looking statements provided by that Act. These statements can be identified by the use of the word “anticipates,”
“estimate,” “expect,” “well-positioned” or “forecast” in the statements. These forward-looking statements are
subject to risks, uncertainties and other factors, domestically and internationally, including, the cost of goods,
competitive pressures, geopolitical events and conditions, general economic conditions, consumer credit
availability, inflation, consumer spending patterns and debt levels, currency exchange fluctuations, trade
restrictions, changes in tariff and freight rates, changes in the costs of gasoline, diesel fuel, other energy,
transportation, utilities, labor and health care, accident costs, casualty and other insurance costs, interest rate
fluctuations, capital market conditions, weather conditions, damage to the Company’s facilities from natural
disasters, regulatory matters and other risks. The Company discusses certain of these factors more fully in its
additional filings with the SEC, including its last annual report on Form 10-K filed with the SEC, and this
release should be read in conjunction with that annual report on Form 10-K, together with all of the Company’s
other filings, including current reports on Form 8-K, made with the SEC through the date of this release. The
Company urges you to consider all of these risks, uncertainties and other factors carefully in evaluating the
forward-looking statements contained in this release. As a result of these matters, changes in facts, assumptions
not being realized or other circumstances, the Company’s actual results may differ materially from the expected
results discussed in the forward-looking statements contained in this release. The forward-looking statements
made in this release are made only as of the date of this release, and the Company undertakes no obligation to
update them to reflect subsequent events or circumstances.
4. 4
WAL-MART STORES, INC. AND SUBSIDIARIES
CONDENSED CONSOLIDATED STATEMENTS OF INCOME
(Unaudited)
(Amounts in millions except per share data)
SUBJECT TO RECLASSIFICATION
Three Months Ended Six Months Ended
July 31, July 31,
2008 2007 2008 2007
Revenues:
Net sales $ 101,598 $ 91,990 $195,720 $ 177,377
Membership and other income 1,069 1,009 2,241 2,000
102,667 92,999 197,961 179,377
Costs and expenses:
Cost of sales 77,642 70,589 149,528 135,900
Operating, selling, general and administrative expenses 19,228 17,127 37,328 33,371
5,797 5,283 11,105 10,106
Operating income
Interest:
Debt 450 446 938 852
Capital leases 77 42 149 111
Interest income (71) (84) (135) (169)
Interest, net 456 404 952 794
5,341 4,879 10,153 9,312
Income from continuing operations before income taxes and minority interest
1,826 1,676 3,496 3,208
Provision for income taxes
3,515 3,203 6,657 6,104
Income from continuing operations before minority interest
(130) (106) (252) (206)
Minority interest
3,385 3,097 6,405 5,898
Income from continuing operations
64 (145) 66 (120)
Income (loss) from discontinued operations, net of tax
$ 3,449 $ 2,952 $ 6,471 $ 5,778
Net income
Net income per common share:
Basic income per common share from continuing operations $ 0.86 $ 0.75 $ 1.62 $ 1.43
Basic income (loss) per common share from discontinued operations 0.01 (0.03) 0.02 (0.02)
$ 0.87 $ 0.72 $ 1.64 $ 1.41
Basic net income per common share
Diluted income per common share from continuing operations $ 0.86 $ 0.75 $ 1.62 $ 1.43
Diluted income (loss) per common share from discontinued operations 0.01 (0.03) 0.01 (0.03)
$ 0.87 $ 0.72 $ 1.63 $ 1.40
Diluted net income per common share
Weighted-average number of common shares:
Basic 3,945 4,102 3,951 4,112
Diluted 3,958 4,108 3,962 4,118
$ - $ - $ 0.95 $ 0.88
Dividends declared per common share
5. 5
WAL-MART STORES, INC. AND SUBSIDIARIES
CONDENSED CONSOLIDATED BALANCE SHEETS
(Unaudited)
(Amounts in millions)
SUBJECT TO RECLASSIFICATION July 31, July 31, January 31,
2008 2007 2008
ASSETS
Current assets:
Cash and cash equivalents $ 6,907 $ 6,073 $ 5,499
Receivables 3,226 2,767 3,654
Inventories 35,382 34,184 35,180
Prepaid expenses and other 3,311 2,915 2,760
Current assets of discontinued operations 708 448 492
Total current assets 49,534 46,387 47,585
Property and equipment, at cost 126,698 116,648 122,642
Less accumulated depreciation (31,591) (26,771) (28,771)
Property and equipment, net 95,107 89,877 93,871
Property under capital leases 5,740 5,515 5,736
Less accumulated amortization (2,645) (2,448) (2,594)
Property under capital leases, net 3,095 3,067 3,142
Goodwill 16,400 14,655 16,071
Other assets and deferred charges 2,755 2,959 2,841
Non-current assets of discontinued operations 4 4 4
$ 166,895 $ 156,949 $ 163,514
Total assets
LIABILITIES AND SHAREHOLDERS’ EQUITY
Current liabilities:
Commercial paper $ 4,347 $ 8,117 $ 5,040
Accounts payable 29,933 27,748 30,370
Dividends payable 1,927 1,794 -
Accrued liabilities 15,607 14,025 15,724
Accrued income taxes 555 168 1,000
Long-term debt due within one year 2,180 3,176 5,913
Obligations under capital leases due within one year 324 189 316
Current liabilities of discontinued operations 31 33 91
Total current liabilities 54,904 55,250 58,454
Long-term debt 34,168 27,966 29,799
Long-term obligations under capital leases 3,544 3,594 3,603
Deferred income taxes and other 5,410 5,449 5,111
Minority interest 2,076 2,404 1,939
Commitments and contingencies
Shareholders' equity:
Common stock and capital in excess of par value 3,986 3,412 3,425
Retained earnings 57,883 55,414 57,319
Accumulated other comprehensive income 4,924 3,460 3,864
Total shareholders’ equity 66,793 62,286 64,608
$ 166,895 $ 156,949 $ 163,514
Total liabilities and shareholders’ equity
6. 6
WAL-MART STORES, INC. AND SUBSIDIARIES
CONDENSED CONSOLIDATED STATEMENTS OF CASH FLOWS
(Unaudited)
(Amounts in millions)
Six Months Ended
SUBJECT TO RECLASSIFICATION July 31,
2008 2007
Cash flows from operating activities:
Net income $ 6,471 $ 5,778
(Income) loss from discontinued operations, net of tax (66) 120
Income from continuing operations 6,405 5,898
Adjustments to reconcile income from continuing operations to net cash provided by
operating activities:
Depreciation and amortization 3,366 3,060
Other 315 101
Changes in certain assets and liabilities, net of effects of acquisitions:
Decrease in accounts receivable 578 255
Decrease (increase) in inventories 95 (64)
Decrease in accounts payable (150) (1,134)
Decrease in accrued liabilities (626) (1,918)
Net cash provided by operating activities 9,983 6,198
Cash flows from investing activities:
Payments for property and equipment (5,074) (6,971)
Proceeds from disposal of property and equipment 492 319
Investment in international operations, net of cash acquired (74) (467)
Other investing activities 129 (61)
Net cash used in investing activities (4,527) (7,180)
Cash flows from financing activities:
(Decrease) increase in commercial paper (639) 5,487
Proceeds from issuance of long-term debt 4,648 3,818
Payment of long-term debt (4,061) (5,435)
Dividends paid (1,878) (1,811)
Purchase of Company stock (2,184) (2,484)
Other financing activities (85) (435)
Net cash used in financing activities (4,199) (860)
Effect of exchange rates on cash 115 169
Net increase (decrease) in cash and cash equivalents 1,372 (1,673)
Cash and cash equivalents at beginning of year (1) 5,569 7,767
Cash and cash equivalents at end of period (2) $ 6,941 $ 6,094
(1) Includes cash and cash equivalents of discontinued operations of $70 million and $49 million at January 31, 2008 and
2007, respectively.
(2) Includes cash and cash equivalents of discontinued operations of $34 million and $21 million at July 31, 2008 and
2007, respectively.