BPPG response - Options for Defined Benefit schemes - 19Apr24.pdf
AT&T Third-Quarter Earnings Package
1. InvestorBriefing
No. 262 | October 22, 2008
3rd QUARTER 2008
Strong Wireless Gains, Sound Operational
Execution Highlight AT&T’s Third Quarter;
Results Led by 2.4 Million iPhone 3G Activations,
Rapid Wireless Data Growth
AT&T Inc. reported third-quarter results highlighted by
AT&T delivered its best-ever
strong wireless gains and stable business trends, including
quarterly postpaid wireless
continued double-digit growth in IP data services and a
subscriber gain, accelerated its
major turnaround in wholesale revenue growth. Total
U-verse video subscriber ramp
wireless revenues grew 15.4 percent, driven by a significant
and sustained stable trends
step up in retail postpaid subscriber additions, continued
in business services.
rapid adoption of wireless data services and robust demand
for integrated devices, led by the Apple iPhone 3G.
Third-quarter highlights included the following:
• otal wireless subscribers increased by 2.0 million to reach 74.9 million in
T
service, with a net gain in retail postpaid wireless subscribers of 1.7 million.
This was the largest quarterly postpaid subscriber increase in the
company’s history.
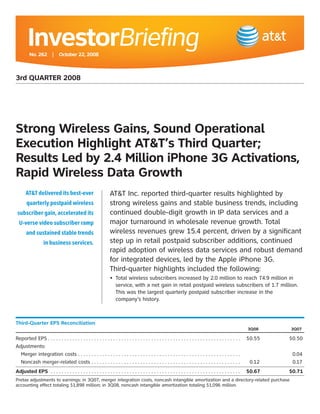
Third-Quarter EPS Reconciliation
3Q08 3Q07
Reported EPS . . . . . . . . . . . . . . . . . . . . . . . . . . . . . . . . . . . . . . . . . . . . . . . . . . . . . . . . . . . . . . . . . . . . . . . $0.55 $0.50
Adjustments:
Merger integration costs . . . . . . . . . . . . . . . . . . . . . . . . . . . . . . . . . . . . . . . . . . . . . . . . . . . . . . . . . . . . 0.04
Noncash merger-related costs . . . . . . . . . . . . . . . . . . . . . . . . . . . . . . . . . . . . . . . . . . . . . . . . . . . . . . . 0.12 0.17
Adjusted EPS . . . . . . . . . . . . . . . . . . . . . . . . . . . . . . . . . . . . . . . . . . . . . . . . . . . . . . . . . . . . . . . . . . . . . . $0.67 $0.71
Pretax adjustments to earnings: in 3Q07, merger integration costs, noncash intangible amortization and a directory-related purchase
accounting effect totaling $1,898 million; in 3Q08, noncash intangible amortization totaling $1,096 million.
2. 2
InvestorBriefing | 3Q 2008
Page TWO
• T&T further accelerated its ramp of
A
next-generation, IP-based TV service and THREE
Page
AT&T ADJUSTED CONSOLIDATED REVENUES
Dollars in billions
Strong gains in ended the third quarter with 781,000
$31.3
wireless and AT&T U-verseSM TV AT&T ADJUSTEDin service. INCOME MA
subscribers OPERATING
$30.9
$30.7
continued double- This reflects a third-quarter net gain of
$30.4
$30.3
digit growth in 232,000, up from 170,000 subscribers 24
IP data services added in the second23.9%
quarter of this year.
24.0%
23.7%
drove AT&T’s AT&T is on a trajectory to exceed its
target of more than 1 million U-verse TV
third-quarter
subscribers by year-end 2008. U-verse
revenue growth.
network deployment now passes
14 million living units.
REPORTED RESULTS
For the quarter ended Sept. 30, 2008, AT&T’s
3Q07 4Q07 1Q08 2Q08 3Q08
consolidated revenues totaled $31.3 billion,
Revenues for 2007 are adjusted to exclude merger-related directory
2Q07 3Q07 4Q07 1Q
purchase accounting impacts.
up 4.0 percent versus reported results in the
Reported 16.8% 17.6% 18.1% 19
year-earlier quarter and up 3.3 percent
Merger integration and amortization costs and ot
• ostpaid subscriber growth was boosted by
P compared with third-quarter 2007 pro forma income ma
are excluded from adjusted operating
the dramatic market success of the Apple revenues, which exclude merger-related
iPhone 3G, which was launched in the accounting impacts on directory revenues.
United States as an AT&T exclusive on Consolidated revenue growth was driven
July 11. Third-quarter activations of the by 15.4 percent growth in wireless revenues
iPhone 3G totaled 2.4 million, approximately and a 16.2 percent increase in wireline IP
40 percent of them for wireless customers data revenues, which includes AT&T U-verse
who were new to AT&T. services and business offerings such as VPNs,
• ireless data revenues grew 50.5 percent,
W managed Internet services and hosting.
reflecting continued strong increases in Gains in these areas more than offset
areas such as Internet access, messaging, pressures in the macro-environment and a
e-mail and related services. Wireless decline in wireline consumer voice, which
Internet access revenues and multimedia was consistent with trends in recent quarters.
message volumes more than doubled Compared with results for the year-earlier
versus results for the year-earlier quarter. quarter, AT&T’s reported operating expenses
• ireline business trends were stable,
W for the third quarter of 2008 were $25.7 billion
with enterprise, regional business and versus $24.8 billion; reported operating
wholesale revenues all up sequentially, income was $5.6 billion, up from $5.3 billion;
led by growth in IP data services such as and AT&T’s reported operating income margin
virtual private networks (VPNs), managed was 17.9 percent, up from 17.6 percent.
Internet services and hosting. AT&T’s reported third-quarter 2008 net
income totaled $3.2 billion, up from
$3.1 billion in the year-earlier quarter,
and reported earnings per diluted share
totaled $0.55, up from $0.50 in the third
quarter of 2007.
3. 3
InvestorBriefing | 3Q 2008
ADJUSTED RESULTS Based on third-quarter customer response,
AT&T is optimistic regarding continued strong
AT&T’s adjusted results for the third quarter
iPhone 3G activations and is confident in the
of 2008 exclude noncash merger-related
long-term value created by this investment
amortization expenses. For the third quarter
in acquiring high-value, data-centric wireless
of 2007, adjusted results excluded merger
subscribers. As a result, AT&T expects its
integration costs, merger-related
dilution associated with the iPhone 3G
amortization expenses and a merger-
will run above its previous expectation, and
related directory accounting effect.
AT&T now expects, depending on volumes,
Compared with results for the year-earlier
its full-year 2008 wireless service OIBDA
quarter, AT&T’s adjusted operating expenses
margin to be better than 37 percent versus
for the third quarter of 2008 totaled
its previous outlook of 39 percent to
$24.6 billion versus $23.1 billion; adjusted
40 percent. AT&T expects its full-year
operating income was $6.7 billion, compared
adjusted consolidated operating income
with $7.2 billion; and AT&T’s adjusted
margin to be approximately 23 percent
operating income margin was 21.4 percent
versus its previous outlook of approximately
versus 23.7 percent. AT&T’s adjusted
24 percent.
third-quarter 2008 net income totaled
$3.9 billion versus $4.3 billion in the
STRONG BALANCE SHEET
year-earlier quarter, and adjusted earnings
AT&T’s cash from operating activities for the
per diluted share totaled $0.67, compared
third quarter of 2008 totaled $9.3 billion,
with $0.71 in the third quarter of 2007.
capital expenditures totaled $5.3 billion and
iPHONE 3G IMPACTS AND free cash flow (cash from operations minus
HURRICANE-RELATED EXPENSES capital expenditures) totaled $4.0 billion.
Through the first three quarters of 2008,
AT&T’s third-quarter 2008 reported and
cash from operating activities totaled
adjusted margins and earnings reflect
$22.8 billion, capital expenditures totaled
revenue growth and continued progress with
$14.8 billion and free cash flow totaled
previously outlined cost initiatives, offset by
$7.9 billion. AT&T continues to expect full-
hurricane-related expenses and effects on
year 2008 capital expenditures in the
wireless results from the iPhone 3G. Impacts
mid-teens as a percentage of total revenues
from the company’s iPhone 3G initiative
and expects full-year 2008 free cash flow
reduced third-quarter pretax earnings by
of approximately $14 billion.
approximately $900 million or $0.10 per
Through the first three quarters of 2008,
share, and costs related to hurricanes
dividends paid totaled $7.2 billion, shares
reduced pretax earnings by approximately
repurchased totaled 164.2 million for
$145 million or $0.02 per share.
$6.1 billion and AT&T ended the third quarter
with 5.9 billion shares outstanding.
4. 4
InvestorBriefing | 3Q 2008
AT&T’s balance sheet continues to be Advertising & Publishing results for 2007
strong. During the third quarter, AT&T were affected by accounting adjustments
reduced total debt by $3.4 billion. At the following AT&T’s late 2006 acquisition of
end of the quarter, AT&T’s long-term debt BellSouth. In accordance with purchase
was $59.4 billion and total debt was accounting rules, deferred revenues and
$76.8 billion. Cash and cash equivalents at expenses for all BellSouth directories
the end of the quarter totaled $1.6 billion. delivered prior to the close of the merger
AT&T’s third-quarter debt-to-total- were eliminated from 2007 consolidated
capitalization ratio was 40.6 percent, and results. This elimination of amortizations
the company’s annualized debt-to-EBITDA reduced third-quarter 2007 consolidated
ratio was 1.7. revenues by $196 million and consolidated
operating expenses by $64 million.
ADDITIONAL BACKGROUND ON AT&T manages its print directory business
ADJUSTED AND PRO FORMA RESULTS using amortized results. As a result, 2007
AT&T’s adjusted earnings for the third amortized results are shown in the
quarter of 2008 exclude noncash, pretax Advertising & Publishing segment on
amortization costs related to acquisitions AT&T’s Statement of Segment Income.
totaling $1.1 billion or $0.12 per diluted In 2008, both consolidated and segment
share. Adjusted results for the third quarter results reflect amortization accounting.
of 2007 excluded: (1) pretax cash merger-
related integration costs totaling
$322 million or $0.04 per diluted share;
(2) noncash, pretax merger-related costs
totaling $1.4 billion or $0.16 per diluted
share; and (3) a merger-related directory
accounting impact of $132 million or
$0.01 per diluted share.
5. 5
InvestorBriefing | 3Q 2008
Wireless
AT&T delivered strong AT&T significantly accelerated growth in advanced wireless services in the
third quarter. Results included a major step up in retail postpaid subscriber
wireless subscriber additions and a continued strong ramp in wireless data revenues from areas
such as Internet access, e-mail and multimedia messaging. Expansion in
and revenue growth in these areas was boosted by robust demand for integrated devices, led by
strong performance from the Apple iPhone 3G, which was launched in the
the third quarter, powered United States as an AT&T exclusive on July 11.
by 2.4 million iPhone 3G STRONGEST QUARTERLY POSTPAID NET ADDS
IN COMPANY’S HISTORY
activations and rapid In the third quarter, AT&T posted the largest postpaid net subscriber gain
for any quarter in its history. Retail postpaid net subscriber additions of
adoption of advanced 1.7 million were up nearly 40 percent versus results in the year-earlier
third quarter and accounted for more than 85 percent of AT&T’s 2.0 million
data services. total wireless net adds.
Gross subscriber flow totaled 5.7 million, and postpaid gross adds for the
third quarter topped 3.8 million, with both totals exceeding results in the
year-earlier quarter. Total monthly subscriber churn in the third quarter was
1.7 percent, flat with results for the year-earlier quarter, and postpaid churn
improved to 1.2 percent from 1.3 percent in the third quarter of 2007.
2.4 MILLION iPHONE 3G ACTIVATIONS
Postpaid subscriber growth was boosted by the dramatic market success of
the iPhone 3G. Third-quarter activations of the iPhone 3G totaled 2.4 million,
2.4 times results for the original iPhone through the end of the third quarter in
2007. Approximately 40 percent of iPhone 3G activations in the third quarter
of 2008 were for wireless customers who were new to AT&T. In addition,
AT&T’s iPhone exclusive has delivered subscribers with ARPU (average monthly
revenues per subscriber) approximately 1.6 times higher and churn rates
significantly lower than the company’s overall postpaid subscriber base.
The iPhone and other integrated devices are key to AT&T’s success in driving
wireless data growth and in expanding flow share of high-value subscribers.
During the third quarter, more than two-thirds of the company’s postpaid net
adds came from customers choosing an integrated device, and 22 percent of
AT&T’s postpaid wireless subscribers now have an integrated device, up from
10.5 percent one year earlier.
6. USE THESE 6
InvestorBriefing | 3Q 2008
Wireless - Chart ONE
Wireless - Chart TW
Driven by subscriber gains and data
AT&T WIRELESS REVENUES
growth, AT&T’s total wireless revenues
AT&T WIRELESS SUBSCRIBERS
Dollars in billions
increased 15.4 percent to $12.6 billion, and
$12.6
Strong subscriber In millions
$12.0
$11.8
wireless service revenues, which exclude
$11.4
gains and rapid $10.9
handset and accessory sales, grew
adoption of data 71.4
14.3 percent to $11.3 billion. Total 70.1 service
services drove
ARPU was $50.80, flat versus the year-
AT&T’s 15.4 percent 65.7
earlier third quarter, and retail postpaid
third-quarter
subscriber ARPU was $58.99, up 2.6 percent
growth in total
versus the third quarter of 2007.
wireless revenues.
To spur continued strong growth in
wireless data services, AT&T has expanded
its 3G network coverage to 324 cities, with
plans to expand to nearly 350 by the end
of the year. AT&T’s 3G network is the
3Q07 4Q07 1Q08 2Q08 3Q08
3Q07 4Q07 1Q08
nation’s fastest, according to third-party included 1.7 m
Subscriber increase in 4Q07
CONTINUED RAPID EXPANSION data, and allows typical download speeds
through acquisition; 2Q08 increase included
added through acquisition.
IN WIRELESS DATA of up to 1.7 megabits per second.
AT&T’s wireless data revenues grew More than 17 million AT&T wireless
50.5 percent versus the year-earlier quarter subscribers now use 3G devices, up
to $2.7 billion, reflecting strong increases in approximately 4 million over the past three
areas such as Internet access, messaging, months. At the end of the third quarter,
e-mail and related services. Wireless Internet AT&T’s total wireless broadband-capable
access revenues more than doubled versus subscribers — those using 3G LaptopConnect
results for the year-earlier quarter, and cards and broadband-speed integrated
multimedia message volumes were also devices with a QWERTY or touch-screen
more than double third-quarter 2007 levels. keyboard — totaled nearly 5.9 million, up
In the third quarter, data represented 2.8 million over the past three months and
24.2 percent of AT&T’s total wireless service more than 4.4 million over the past year.
revenues, up from 18.4 percent in the third
quarter of 2007. Chart TWO
Wireless - Wireless - Chart TH
WIRELESS MARGINS
On a reported basis, third-quarter wireless
operating expenses totaled $10.2 billion,
AT&T WIRELESS SUBSCRIBERS AT&T POSTPAID NET SUBSCRIBER ADD
operating income was $2.4 billion and
In millions In thousands
AT&T increased its 74.9
AT&T’s wireless operating income margin
72.9
wireless subscriber 71.4 was 18.9 percent versus 18.0 percent in the
70.1
base by 2.0 million
year-earlier third quarter. On an adjusted
in the third quarter
basis, third-quarter wireless operating
1,212 1,178
65.7
and by 9.2 million
expenses totaled $9.7 billion, operating
over the past year. income was $2.9 billion and AT&T’s wireless
operating income margin was 22.8 percent 705
versus 26.4 percent in the year-earlier third
quarter. AT&T’s third-quarter wireless OIBDA
service margin was 33.5 percent versus an
unadjusted 37.3 percent and an adjusted
3Q07 4Q07 1Q08 2Q08 3Q08
39.1 percent in the year-earlier quarter.
3Q07 4Q07 1Q08
Subscriber increase in 4Q07 included 1.7 million subscribers added
through acquisition; 2Q08 increase included 182,000 subscribers
added through acquisition.
7. 7
InvestorBriefing | 3Q 2008
Wireless - Chart THREE Wireless - Chart FOUR
wireless research firms. AT&T also offers
AT&T POSTPAID NET SUBSCRIBER ADDITIONS
the broadest global coverage DATA REVENUES
AT&T WIRELESS of any U.S.
In thousands
AT&T delivered its provider, with voice roaming available in
Dollars in billions
1,693
best-ever quarterly more than 200 countries; access to e-mail, $2.5
the Web and other data applications in
net gain in postpaid $2.3
more than 145 countries; and access to
subscribers, up $2.0
1,212 1,178
mobile broadband 3G networks in more
$1.8
39.7 percent versus
than 60 countries.
results in the third 894
Building on this foundation, AT&T is
quarter of 2007. 705
defining and delivering the next generation
of wireless by advancing network
capabilities, offering breakthrough
devices and launching innovative services.
In addition to its highly successful launch
3Q07 4Q07 1Q08 2Q08 3Q08 3Q07 4Q07 1Q08 2Q08
of the Apple iPhone 3G, over the past
ed
s several weeks, AT&T:
In addition to operational improvements, • oined with Samsung Mobile to launch
J
year-over-year margin comparisons reflect Samsung RugbyTM, the first rugged handset
approximately $900 million of pressure to feature AT&T’s breakthrough Video
associated with the iPhone 3G and ShareSM calling and to run on the largest
approximately $55 million of expenses due Push to Talk network in the country.
to hurricanes. Without the iPhone and • xpanded its location-based services
E
hurricane impacts, AT&T’s third-quarter (LBS) portfolio with the launch of two
wireless OIBDA service margin would have new navigation applications, MapQuest
been approximately 42 percent. (OIBDA Navigator and AAA Mobile navigator, and
service margin is operating income before announced the deployment of assisted
depreciation and amortization, divided by GPS technology (A-GPS) in its wireless
total service revenues.) network to enhance existing and
planned location-based services. The
LEADER IN WIRELESS INNOVATION
new applications add to the company’s
AT&T operates the nation’s largest wireless AT&T Navigator and AT&T Navigator
digital voice and data network and offers Global Edition offerings, and AT&T’s
the Wireless - Chart FOUR
nation’s fastest 3G network according deployment of A-GPS paves the way for
to data compiled by leading independent new offers from AT&T in the LBS space,
including plans for a family-oriented
AT&T WIRELESS DATA REVENUES service and a location-enabled social
Dollars in billions
networking service.
1,693
AT&T’s wireless $2.7
• nnounced the launch of “My
A
$2.5
data revenues grew
$2.3
Communities,” a new downloadable
50.5 percent year
$2.0 gateway that lets users create and
over year, driven by $1.8
manage multiple social networking
increased usage of
accounts through a single dashboard
wireless Internet
view on their mobile phone. My
and data access,
Communities offers a diverse roster
messaging and
of social networks, and through
media bundles.
My Communities, subscribers can
register for social sites directly from
their phone. From an easy-to-use
3Q08 3Q07 4Q07 1Q08 2Q08 3Q08
8. 8
InvestorBriefing | 3Q 2008
dashboard view, My Communities users • nnounced the availability of AT&T
A
can upload photos from their phone, Navigator Global Edition, the only
view and respond to new messages, GPS-based service available from a U.S.
approve and deny friend requests and wireless carrier to provide international
view and post new comments across navigation capabilities. The service can be
multiple sites. Updates are synched used in 20 countries on AT&T-powered
across mobile and online channels smartphones featuring built-in GPS
in real time. capabilities. AT&T Navigator Global Edition’s
• ith Sierra Wireless, announced the
W coverage area includes most countries
availability of the AT&T USBConnect in western Europe, North America, the
Mercury, the newest and smallest addition U.S. Caribbean and six cities in China.
to AT&T’s High Speed Packet Access • nnounced the availability of Microsoft
A
(HSPA)-capable lineup of LaptopConnect System Center Mobile Device Manager
devices. The device provides plug-and-play 2008, an enterprise-grade mobile device
installation by including a preloaded management solution that also provides
version of AT&T Communication Manager security, mobile VPN and software
software for Microsoft Windows Vista, distribution for Windows Mobile devices.
XP and 2000 notebooks and Sierra’s AT&T also announced the availability of
WatcherTM software for Mac notebooks the MDM Early Adopter QuickStart
(versions 10.4.11 or later). Program that was developed cooperatively
• oined with LG Mobile Phones to launch
J by AT&T and Enterprise Mobile and is an
the LG InvisionTM, a new multimedia device exclusive offering designed to assist AT&T
for users who want the best in video on customers with deploying the Microsoft
their mobile phone. It is the smallest mobility solution.
Mobile TV-capable phone in the U.S.,
at just a little more than 4 inches tall,
2 inches wide and less than one-half
inch thick.
9. 9
InvestorBriefing | 3Q 2008
Wireline
Third-quarter results in Third-quarter revenues in AT&T’s wireline segment totaled $17.6 billion versus
$17.9 billion in the year-earlier quarter. Results included AT&T’s fourth consecutive
AT&T’s wired operations quarter of strong mid-teens growth in total wireline IP data revenues, up
16.2 percent versus the year-earlier quarter. Consumer IP data revenues, which
included continued include broadband and U-verse services, grew 19.0 percent, and business IP data
revenues from products such as VPNs, managed Internet services and hosting
double-digit growth in were up 14.7 percent. Growth in these areas largely offset expected declines in
voice and legacy packet-switched data products.
IP data revenues, Third-quarter wireline results were highlighted by an accelerated ramp in
AT&T U-verse TV subscribers and stable business trends, including a return to
stable business trends, growth in wholesale revenues. AT&T’s total business revenues — comprised of
the enterprise, regional and wholesale customer categories — grew 0.3 percent
including a major versus the year-earlier quarter to $11.5 billion. All three business categories
posted sequential revenue growth in the third quarter.
turnaround in wholesale, Compared with results for the year-earlier quarter, on a reported basis,
third-quarter wireline operating expenses totaled $14.8 billion versus
and an accelerated ramp $15.0 billion; operating income was $2.7 billion versus $3.0 billion; and AT&T’s
wireline operating income margin was 15.6 percent versus 16.5 percent.
in AT&T U-verse Adjusted wireline results exclude merger-related integration and amortization
expenses for the third quarter of 2007 and exclude only merger-related
TV subscribers.
amortization expenses for the third quarter of 2008. Compared with results for
the year-earlier quarter, third-quarter adjusted wireline operating expenses
totaled $14.4 billion versus $14.4 billion; adjusted operating income was
$3.1 billion versus $3.6 billion; and AT&T’s adjusted wireline operating income
margin was 17.9 percent versus 19.9 percent. In addition to operational drivers,
third-quarter 2008 results include approximately $90 million in costs related
to hurricanes.
The following wireline highlights include ongoing shifts in customer categories
to reflect AT&T’s management of customer relationships.
WHOLESALE TURNAROUND
In the third quarter, AT&T delivered a return to growth in wholesale revenues,
extending a major turnaround of trends in this category over the past year.
Wholesale revenues totaled $3.5 billion, up 0.8 percent sequentially and
0.7 percent versus the year-earlier quarter. This was AT&T’s third consecutive
quarter of sequential revenue growth in wholesale revenues.
10. 10
InvestorBriefing | 3Q 2008
Wireline
Wireline
AT&T WHOLESALE REVENUES — Y
integrators, Internet service providers
GROWTH RATES
AT&T WIRELINE IP DATA REVENUES
and content providers.
Dollars in billions
In recent weeks, AT&T announced it has
AT&T’s IP data service $2.8
$2.7
received a Market Leadership Award for its
$2.6 $2.6
revenues, including $2.4
U.S. Wholesale Metro SONET service portfolio
U-verse services and
from Frost & Sullivan, a global growth
business products (4.0)%
consulting company. In addition, the
such as VPNs,
AT&T Wholesale organization received four
managed Internet
2008 ATLANTIC-ACM Wholesale Metro
services and hosting, (7.0)%
Carrier Excellence Awards based on the
grew 16.2 percent
results of the third annual Metro Carrier
year over year. (8.5)%
Report Card, which evaluates the
performance of metro carriers by their
3Q07 4Q07 1Q08
Enterprise service
wholesale customers and is (3.0)% on(0.7)%
based more
3Q07 4Q07 1Q08 2Q08 3Q08
IP data as a percentage revenue growth 0.4%
of total wireline data revenues 39.9% 41.5% 42.3% 43.4% 44.0%
than 3,000 individual carrier evaluations. to 2006 pro form
2007 comparisons are
results from the former BellSouth and
The turnaround in wholesale trends from acquired operations.
STABLE ENTERPRISE TRENDS
reflects solid demand from wireless carriers, Total enterprise revenues in the third quarter
Internet service providers, content providers totaled $4.7 billion, up 0.8 percent
and other customers along with increased sequentially and down 1.4 percent versus
revenues from the agreement announced the year-earlier quarter, reflecting solid
last fall that makes AT&T the primary global sales results with some economic pressures
network management services provider on voice and data transport volumes.
to IBM. Enterprise fundamentals in terms of closed
AT&T is one of the largest wholesale sales, a strong sales funnel and new service
transport and communications service adoption remain solid, and the company
providers in the world, maintaining expects revenues from major contracts,
Wireline
connections to more than 600 carriers in such as its agreements with Royal Dutch
more than 220 countries and territories, Shell and with U.S. government agencies,
and delivers a full portfolio of end-to-end, to increase in the quarters ahead.
reliable and highly secure network, voice, AT&T is the premier provider for enterprise
data and IP solutions to carriers, wireless AT&T TOTAL ENTERPRISE REVENUE GROWTH RATES
Wireline customers, delivering networking services
Wireline
operators, cable providers, systems 2
and solutions to multinational corporations, 1.2%
1 governmental agencies and regionally
AT&T WHOLESALE REVENUES — YEAR-OVER-YEAR based domestic companies. The company
AT&T U-VERSE TV CONNECTIONS IN SER
GROWTH RATES 0
continues to expand itsthousands
In capabilities through
(0.2)%
AT&T has delivered -1 network expansion and enhancement of
0.7%
a substantial service capabilities. For example, in August,
(1.7)%
(0.2)%
-2
AT&T announced the global (2.0)% launch of AT&T
turnaround in
5
-3 Synaptic HostingSM, its next-generation
wholesale revenue
utility computing service with managed
growth, driven by (3.9)%
(4.0)%
-4
networking, security and storage for
solid demand and 379
1Q07 2Q07 3Q07 4Q07 1Q08
businesses. And in September, the company
increased revenues Enterprise service
revenue growth (3.0)% (0.7)% 0.4% 1.5% 2.1%
launched AT&T Mobile Enterprise Applications,
(7.0)%
from the company’s 231
2007 comparisons are to 2006 pro forma results, which combine
results from the formerhosted and managed mobile
which offers BellSouth and AT&T and exclude revenues
global network
126
integration solutions and application
from acquired operations.
(8.5)%
services agreement
consulting services for companies that
with IBM.
3Q07 4Q07 1Q08 2Q08 3Q08 want to extend their business-critical
Enterprise service
3Q07 4Q07 1Q08 2
revenue growth (3.0)% (0.7)% 0.4% 1.5% 2.1%
information to mobile employees.
2007 comparisons are to 2006 pro forma results, which combine
results from the former BellSouth and AT&T and exclude revenues
from acquired operations.
11. 11
InvestorBriefing | 3Q 2008
REGIONAL CONSUMER RESULTS
In recognition of the high quality of AT&T’s
enterprise capabilities, in August, leading Third-quarter regional consumer revenues
industry analyst firm Gartner Inc. positioned continued trends of recent quarters, with
AT&T in the Leaders Quadrant of its “Magic growth in revenues from broadband and
Quadrant for U.S. Wireless Service Providers, AT&T U-verse services in large part offsetting
2008” report, and Gartner gave the company pressures in traditional voice, as the
the same ranking in its “Managed and consumer space moves through a
Professional Network Service Providers, transformation from primarily voice-
Worldwide” report. centered relationships to connections
driven by mobility, broadband and video.
REGIONAL BUSINESS GROWTH Third-quarter regional consumer revenues
AT&T posted third-quarter growth in regional totaled $5.5 billion, down 3.8 percent. This
business revenues of 0.7 percent sequentially reflects operational trends and a change
and 2.3 percent versus the year-earlier in AT&T’s relationship with Yahoo!® Inc.,
quarter to $3.2 billion. which provides portal services to AT&T’s
Regional business data revenues grew nearly 15 million wireline broadband
8.4 percent year over year, led by Ethernet subscribers. Under the new arrangement,
and IP data services including managed announced in the second quarter of 2008,
Internet and VPNs. IP data and Ethernet, AT&T no longer pays monthly portal fees
which made up 53.6 percent of AT&T’s and receives a reduced level of shared
regional business data revenues, grew advertising revenues from Yahoo!
18.9 percent versus the year-earlier third Reflecting growth in wireline broadband
quarter. and AT&T U-verse services, revenues per
AT&T’s portfolio of communications services consumer household served increased
for its regional business customers includes 4.3 percent versus the year-earlier third
wireless, broadband Internet access, business quarter. Regional consumer revenue
e-mail services, Web hosting, unified connections (retail voice, high speed
messaging, remote data storage and network Internet and video) totaled 47.5 million
security options. at the end of the quarter versus 49.6 million
To further differentiate its products for at the end of the third quarter of 2007 and
regional business customers, AT&T is 48.4 million at the end of the second quarter
offering attractive bundles and term of 2008. Over the past year, total consumer
contract offers with an increased focus broadband and TV connections increased
on wireless including FamilyTalk® plans by 1.9 million.
for small and midsized firms. In addition, AT&T’s innovations in the consumer space
AT&T is expanding its data and broadband include marketing broadband/wireless
capabilities. For example, in September, bundles and combining wireline broadband
the company launched AT&T Tech Support with wireless LaptopConnect service and
360SM, an information technology helpdesk AT&T’s extensive Wi-Fi availability.
that provides live, technical service In September, AT&T announced the
designed specifically for small businesses, introduction of AT&T HomeManagerTM —
including online computer support. an innovative home phone that combines
access to Internet content and popular
wireless phone applications with traditional
12. 12
InvestorBriefing | 3Q 2008
Wireline
Wireline
On October 1, AT&T announced that AT&T
AT&T U-VERSE TV CONNECTIONS IN SERVICE
U-verse TV ranked highest in customer
AT&T AVERAGE MONTHLY CONSUMER REV
In thousands
satisfaction among residential television
781 PER HOUSEHOLD SERVED
customers in the North Central, South and
AT&T continues to
0.7%
West regions in the J.D. Power and $60.
accelerate subscriber $59.73
$59.43
Associates 2008 Residential Television
growth in its advanced $58.91
549
Service Provider Satisfaction StudySM.
IP-based TV service,
Customers evaluated AT&T’s performance
as customers respond
and reliability, customer service, cost of
379
positively to the
service, billing and offerings and promotions.
high-quality viewing
In October, AT&T announced agreements
231
experience and rich
with Circuit City and Wal-Mart to sell AT&T
set of features 126
U-verse TV and AT&T U-verse High Speed
U-verse offers.
Internet in more than 600 retail locations.
08
These are the first national retail agreements
2Q07 3Q07 4Q07 1Q0
3Q07 4Q07 1Q08 2Q08 3Q08
%
for AT&T U-verse.
bine
nues
home phone service. Using a portable,
BROADBAND GROWTH
seven-inch color touch-screen frame, AT&T
At the end of the third quarter, AT&T’s
HomeManager provides one-touch access
wireline broadband subscribers, including
from anywhere in the home to a robust
both consumer and business customers,
lineup of popular features and content,
totaled 14.8 million, up 148,000 in the
including visual voice mail, weather reports,
quarter and 1.1 million over the past year.
e-mail access, local news, a portable
Customers increasingly use both wireline
speakerphone and more.
and wireless connections for broadband
connectivity, as reflected in AT&T’s strong
ACCELERATED RAMP IN AT&T
growth in wireless LaptopConnect cards
U-VERSE TV SUBSCRIBERS
and integrated devices. In recognition of
AT&T further accelerated its ramp in U-verse
this trend, AT&T now also provides data
TV growth with a net gain of 232,000
on total broadband connections, which
subscribers in the third quarter, up from
combines wireline and wireless subscribers.
170,000 added in the second quarter of
Total broadband-capable connections in
this year. At the end of the quarter,
service increased 2.9 million in the third
subscribers to the company’s next-
quarter to reach 20.7 million. (Wireless
generation, IP-based TV service totaled
broadband connections include data users
781,000, on a trajectory to exceed AT&T’s
with 3G LaptopConnect cards and
target of more than 1 million U-verse TV
broadband-speed integrated devices with
subscribers by year-end 2008. U-verse
a QWERTY or touchscreen keyboard.)
network deployment now passes 14 million
living units. AT&T’s rollout of Total Home
DVR service is under way and expected to
be completed by the end of the year.
Attach rates for broadband service continue
to be high, at more than 85 percent.
13. 13
InvestorBriefing | 3Q 2008
NATIONAL MASS MARKETS Data transport service revenues increased
1.6 percent year over year, and packet-
Revenues from AT&T’s national mass markets
switched data revenues, which include
category, which includes the remainder of
Frame Relay and ATM services, were down
the former AT&T’s standalone long distance
15.1 percent, consistent with industry trends.
and local bundled business, totaled
In the third quarter, 73.4 percent of AT&T’s
$636 million in the third quarter,
data revenues came from retail business
repre enting a decline of 28.7 percent year
s
and consumer customers. These retail data
over year. Results are as expected and
revenues were up 7.4 percent versus results
consistent with trends over the past
for the year-earlier quarter.
several quarters. National mass markets
represented 3.6 percent of total wireline
WIRELINE VOICE SERVICES
revenues in the third quarter and
AT&T’s third-quarter wireline voice revenues,
accounted for 65.5 percent of AT&T’s
which include retail local voice and long
year-over-year decline in total wireline
distance as well as wholesale voice, totaled
revenues.
$9.5 billion, representing a decline of
8.1 percent versus results for the third
PRODUCT CATEGORIES
quarter of 2007. These results continue
trends in recent quarters, reflecting the
WIRELINE DATA SERVICES
industrywide migration of voice usage
AT&T’s data revenues, which include results
from wired to wireless platforms, customer
from several customer categories, grew
transitions to broadband and VoIP services
5.3 percent versus results for the year-earlier
and increased local voice competition.
third quarter to $6.4 billion.
Data growth was led by a 16.2 percent
increase in revenues from IP-based services,
with continued gains in high speed Internet,
managed Internet, VPN and hosting services.
14. 14
InvestorBriefing | 3Q 2008
Advertising
& Publishing
AT&T is a leader in local AT&T’s Advertising & Publishing segment offers businesses a full suite of local
search options, including print and Internet Yellow Pages in addition to Web site
search, with more than design, search engine marketing and mobile search.
AT&T’s Advertising & Publishing operations deliver 173 million directories to
1,250 print directories and residences and businesses in 22 states and have a premier online presence
nationwide with YELLOWPAGES.COM, which offers consumers access to local
YELLOWPAGES.COM, business information, the latest business listings, city guides, maps and driving
directions. Combined, these print and online products receive approximately
its fast-growing online 5 billion consumer searches a year for local business information and provide
more than 1 million advertisers with valuable sales leads to help their
search service. businesses grow.
Advertising & Publishing revenue trends reflect migration from print to
electronic search, including rapid growth at AT&T’s YELLOWPAGES.COM.
Advertising & Publishing’s Internet revenues increased 29.7 percent versus the
year-earlier quarter, and total Advertising & Publishing revenues declined
7.3 percent, in part reflecting revenues lost through the sale of a sales agency
business that serves independent telephone companies. That transaction closed
in the second quarter of 2008. Excluding revenues from this sold unit, Advertising
& Publishing revenues would have declined 5.0 percent year over year.
Compared with reported results in the year-earlier quarter, reported operating
expenses totaled $929 million versus $993 million; operating income totaled
$421 million, compared with $464 million; and the segment’s operating income
margin was 31.2 percent versus 31.8 percent.
Adjusted results for Advertising & Publishing exclude merger-related noncash
amortization costs in both quarters. Compared with results in the year-earlier
quarter, third-quarter 2008 adjusted operating expenses totaled $744 million
versus $763 million; adjusted operating income totaled $606 million, compared
with $694 million; and the segment’s adjusted operating income margin was
44.9 percent versus 47.6 percent.
15. 15
InvestorBriefing | 3Q 2008
Other
AT&T’s Other segment AT&T’s Other segment includes results from AT&T’s Sterling Commerce
operations and AT&T’s customer information services operations, both of
includes results from its which are included in segment revenues and operating expenses. Customer
information services include operator services and directory assistance.
Sterling Commerce unit, Sterling Commerce is one of the world’s largest providers of multi-enterprise
collaboration solutions, serving the retail, consumer packaged goods,
customer information manufacturing, financial services, health care and telecommunications
industries.
services and equity The Other segment also includes AT&T’s proportionate share of results
from Telmex, América Móvil and Telmex Internacional, which are shown in the
investments in Telmex, Equity in Net Income of Affiliates line for this segment. AT&T’s equity interest
in each company is more than 8 percent.
América Móvil and América Móvil is one of the leading providers of telecommunications
services in Latin America, with more than 165 million wireless subscribers
Telmex Internacional. at the end of the second quarter of 2008 in countries throughout the region,
including 52.9 million in Mexico.
Telmex is the leading telecommunications company in Mexico. Telmex and
its subsidiaries provide a wide range of telecommunications services, data
and video transmission, Internet access and integrated telecommunications
solutions. Telmex Internacional has telecommunications operations in
Argentina, Brazil, Chile, Colombia, Ecuador, Mexico, Peru and Uruguay.
On a reported basis, Other segment income totaled $338 million in the
third quarter versus $203 million in the year-earlier quarter. Segment revenues
totaled $501 million, compared with $562 million for the third quarter of 2007.
Equity in Net Income of Affiliates totaled $257 million, up from $159 million
in the year-earlier quarter.
16. 16
InvestorBriefing | 3Q 2008
AT&T Inc.
Consolidated Statements of Income (Unaudited)
(Dollars in Millions Except per Share Amounts)
Three Months Ended Nine Months Ended
9/30/08 9/30/08
9/30/07 % Change 9/30/07 % Change
Operating Revenues
$11,227 $32,726
Wireless service $ 9,834 14.2% $28,417 15.2%
9,313 28,525
Voice 10,164 -8.4% 30,997 -8.0%
6,144 18,170
Data 5,880 4.5% 17,281 5.1%
1,333 4,114
Directory 1,240 7.5% 3,417 20.4%
3,325 9,417
Other 3,014 10.3% 8,467 11.2%
Total Operating Revenues 31,342 92,952
30,132 4.0% 88,579 4.9%
Operating Expenses
Cost of services and sales (exclusive of depreciation
13,070 36,972
and amortization shown separately below) 11,736 11.4% 34,816 6.2%
7,676 22,976
Selling, general and administrative 7,770 -1.2% 22,497 2.1%
4,978 14,839
Depreciation and amortization 5,322 -6.5% 16,354 -9.3%
Total Operating Expenses 25,724 74,787
24,828 3.6% 73,667 1.5%
Operating Income 5,618 18,165
5,304 5.9% 14,912 21.8%
Interest Expense 858 2,577
887 -3.3% 2,639 -2.3%
Equity in Net Income of Affiliates 257 712
162 58.6% 545 30.6%
Other Income (Expense) – Net (81) (91)
(17) — 614 —
Income Before Income Taxes 4,936 16,209
4,562 8.2% 13,432 20.7%
Income Taxes 1,706 5,746
1,499 13.8% 4,617 24.5%
Net Income $ 3,230 $10,463
$ 3,063 5.5% $ 8,815 18.7%
Basic Earnings Per Share $ 0.55 $ 1.76
$ 0.50 10.0% $ 1.43 23.1%
Weighted Average Common
5,893 5,938
Shares Outstanding (000,000) 6,088 -3.2% 6,152 -3.5%
Diluted Earnings Per Share $ 0.55 $ 1.75
$ 0.50 10.0% $ 1.42 23.2%
Weighted Average Common Shares
5,921 5,971
Outstanding with Dilution (000,000) 6,129 -3.4% 6,196 -3.6%
17. 17
InvestorBriefing | 3Q 2008
AT&T Inc.
Statements of Segment Income (Unaudited)
(Dollars in Millions)
Three Months Ended Nine Months Ended
9/30/08 9/30/08
9/30/07 % Change 9/30/07 % Change
Wireless
Segment Operating Revenues
$11,273 $32,869
Service $ 9,860 14.3% $28,492 15.4%
1,345 3,607
Equipment 1,077 24.9% 2,837 27.1%
Total Segment Operating Revenues 12,618 36,476
10,937 15.4% 31,329 16.4%
Segment Operating Expenses
4,989 13,261
Cost of services and equipment sales 4,079 22.3% 11,690 13.4%
3,849 10,489
Selling, general and administrative 3,183 20.9% 9,136 14.8%
1,401 4,327
Depreciation and amortization 1,709 -18.0% 5,410 -20.0%
Total Segment Operating Expenses 10,239 28,077
8,971 14.1% 26,236 7.0%
Segment Operating Income 2,379 8,399
1,966 21.0% 5,093 64.9%
Equity in Net Income of Affiliates — 5
3 -100.0% 12 -58.3%
Minority Interest (57) (186)
(43) -32.6% (143) -30.1%
Segment Income $ 2,322 $ 8,218
$ 1,926 20.6% $ 4,962 65.6%
Wireline
Segment Operating Revenues
$ 9,515 $29,191
Voice $10,356 -8.1% $31,619 -7.7%
6,401 18,893
Data 6,076 5.3% 17,918 5.4%
1,634 4,698
Other 1,509 8.3% 4,389 7.0%
Total Segment Operating Revenues 17,550 52,782
17,941 -2.2% 53,926 -2.1%
Segment Operating Expenses
8,128 23,908
Cost of sales 7,778 4.5% 23,396 2.2%
3,354 10,305
Selling, general and administrative 3,868 -13.3% 11,354 -9.2%
3,331 9,770
Depreciation and amortization 3,334 -0.1% 10,076 -3.0%
Total Segment Operating Expenses 14,813 43,983
14,980 -1.1% 44,826 -1.9%
Segment Income $ 2,737 $ 8,799
$ 2,961 -7.6% $ 9,100 -3.3%
Advertising & Publishing
Segment Operating Revenues $ 1,350 $ 4,174
$ 1,457 -7.3% $ 4,378 -4.7%
Segment Operating Expenses
461 1,321
Cost of sales 417 10.6% 1,214 8.8%
274 972
Selling, general and administrative 338 -18.9% 1,067 -8.9%
194 609
Depreciation and amortization 238 -18.5% 743 -18.0%
Total Segment Operating Expenses 929 2,902
993 -6.4% 3,024 -4.0%
Segment Income $ 421 $ 1,272
$ 464 -9.3% $ 1,354 -6.1%
Other
Segment Operating Revenues $ 501 $ 1,557
$ 562 -10.9% $ 1,658 -6.1%
Segment Operating Expenses 420 1,862
518 -18.9% 1,673 11.3%
Segment Operating Income (Loss) 81 (305)
44 84.1% (15) —
Equity in Net Income of Affiliates 257 707
159 61.6% 533 32.6%
Segment Income $ 338 $ 402
$ 203 66.5% $ 518 -22.4%