
More Related Content
What's hot
What's hot (14)
Viewers also liked
Similar to conoco phillips 2005Fourth Quarter
Similar to conoco phillips 2005Fourth Quarter (20)
More from finance1
More from finance1 (11)
Recently uploaded
Recently uploaded (20)
conoco phillips 2005Fourth Quarter
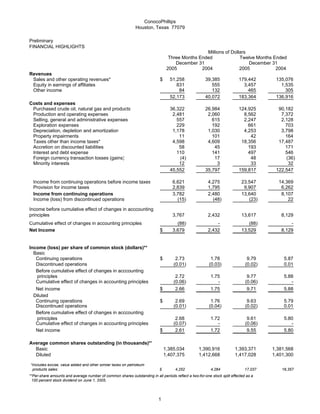
- 1. ConocoPhillips Houston, Texas 77079 Preliminary FINANCIAL HIGHLIGHTS Millions of Dollars Three Months Ended Twelve Months Ended December 31 December 31 2005 2004 2005 2004 Revenues Sales and other operating revenues* $ 51,258 39,385 179,442 135,076 Equity in earnings of affiliates 831 555 3,457 1,535 Other income 84 132 465 305 52,173 40,072 183,364 136,916 Costs and expenses Purchased crude oil, natural gas and products 36,322 26,984 124,925 90,182 Production and operating expenses 2,481 2,060 8,562 7,372 Selling, general and administrative expenses 557 615 2,247 2,128 Exploration expenses 229 192 661 703 Depreciation, depletion and amortization 1,178 1,030 4,253 3,798 Property impairments 11 101 42 164 Taxes other than income taxes* 4,598 4,609 18,356 17,487 Accretion on discounted liabilities 58 45 193 171 Interest and debt expense 110 141 497 546 Foreign currency transaction losses (gains) (4) 17 48 (36) Minority interests 12 3 33 32 45,552 35,797 159,817 122,547 Income from continuing operations before income taxes 6,621 4,275 23,547 14,369 Provision for income taxes 2,839 1,795 9,907 6,262 Income from continuing operations 3,782 2,480 13,640 8,107 Income (loss) from discontinued operations (15) (48) (23) 22 Income before cumulative effect of changes in acccounting principles 3,767 2,432 13,617 8,129 Cumulative effect of changes in accounting principles (88) - (88) - Net Income $ 3,679 2,432 13,529 8,129 Income (loss) per share of common stock (dollars)** Basic Continuing operations $ 2.73 1.78 9.79 5.87 Discontinued operations (0.01) (0.03) (0.02) 0.01 Before cumulative effect of changes in acccounting principles 2.72 1.75 9.77 5.88 Cumulative effect of changes in accounting principles (0.06) - (0.06) - Net income $ 2.66 1.75 9.71 5.88 Diluted Continuing operations $ 2.69 1.76 9.63 5.79 Discontinued operations (0.01) (0.04) (0.02) 0.01 Before cumulative effect of changes in acccounting principles 2.68 1.72 9.61 5.80 Cumulative effect of changes in accounting principles (0.07) - (0.06) - Net income $ 2.61 1.72 9.55 5.80 Average common shares outstanding (in thousands)** Basic 1,385,034 1,390,916 1,393,371 1,381,568 Diluted 1,407,375 1,412,668 1,417,028 1,401,300 *Includes excise, value added and other similar taxes on petroleum products sales: $ 4,252 4,284 17,037 16,357 **Per-share amounts and average number of common shares outstanding in all periods reflect a two-for-one stock split effected as a 100 percent stock dividend on June 1, 2005. 1
- 2. ConocoPhillips Houston, Texas 77079 Preliminary SELECTED FINANCIAL DATA Millions of Dollars Three Months Ended Twelve Months Ended December 31 December 31 2005 2004 2005 2004 INCOME (LOSS) FROM CONTINUING OPERATIONS E&P United States $ 1,325 935 4,290 2,942 International 1,105 736 4,144 2,760 Total E&P 2,430 1,671 8,434 5,702 Midstream 147 100 688 235 R&M United States 805 484 3,407 2,126 International 251 269 849 617 Total R&M 1,056 753 4,256 2,743 LUKOIL Investment 189 74 714 74 Chemicals 114 83 323 249 Emerging Businesses (4) (24) (20) (102) Corporate and other (150) (177) (755) (794) Consolidated $ 3,782 2,480 13,640 8,107 CUMULATIVE EFFECT OF ACCOUNTING CHANGES E&P United States $ (2) - $ (2) - International (2) - (2) - Total E&P (4) - (4) - Midstream - - - - R&M United States (78) - (78) - International (5) - (5) - Total R&M (83) - (83) - LUKOIL Investment - - - - Chemicals - - - - Emerging Businesses (1) - (1) - Corporate and other - - - - Consolidated $ (88) - $ (88) - INCOME (LOSS) FROM DISCONTINUED OPERATIONS Corporate and other (15) (48) (23) 22 SUMMARY OF NET INCOME (LOSS) E&P United States $ 1,323 935 4,288 2,942 International 1,103 736 4,142 2,760 Total E&P 2,426 1,671 8,430 5,702 Midstream 147 100 688 235 R&M United States 727 484 3,329 2,126 International 246 269 844 617 Total R&M 973 753 4,173 2,743 LUKOIL Investment 189 74 714 74 Chemicals 114 83 323 249 Emerging Businesses (5) (24) (21) (102) Corporate and other (165) (225) (778) (772) Net income $ 3,679 2,432 13,529 8,129 2
- 3. ConocoPhillips Houston, Texas 77079 Preliminary SELECTED FINANCIAL DATA Three Months Ended Twelve Months Ended December 31 December 31 2005 2004 2005 2004 INCOME FROM CONTINUING OPERATIONS Effective tax rate % 42.9 % 42.0 42.1 43.6 Millions of Dollars FOREIGN CURRENCY GAINS (LOSSES) AFTER-TAX E&P $ 1 (28) 7 (13) Midstream - (1) 7 (1) R&M (3) 11 (52) 12 LUKOIL Investment - - (1) - Chemicals - - - - Emerging Businesses (1) - (1) - Corporate and other (15) 23 (42) 44 $ (18) 5 (82) 42 CASH FLOWS FROM OPERATING ACTIVITIES Income from continuing operations $ 3,782 2,480 13,640 8,107 Depreciation, depletion and amortization 1,178 1,030 4,253 3,798 Property impairments 11 101 42 164 Dry hole costs and leasehold impairment 138 75 349 417 Accretion on discounted liabilities 58 45 193 171 Deferred income taxes 348 27 1,101 1,025 Undistributed equity earnings (92) (236) (1,774) (777) Net (gain) loss on asset dispositions (14) (34) (278) (116) Other (140) (295) (139) (190) Working capital changes (595) 10 246 (601) Net cash provided by continuing operations 4,674 3,203 17,633 11,998 Net cash provided by (used in) discontinued operations 1 (6) (5) (39) Net cash provided by operating activities $ 4,675 3,197 17,628 11,959 CAPITAL EXPENDITURES AND INVESTMENTS E&P United States $ 416 368 1,637 1,314 International 1,250 1,184 5,047 3,935 1,666 1,552 6,684 5,249 Midstream - 1 839 7 R&M 663 574 1,738 1,344 LUKOIL Investment 637 2,649 2,160 2,649 Chemicals - - - - Emerging Businesses - 1 5 75 Corporate and other* 81 60 194 172 $ 3,047 4,837 11,620 9,496 *Excludes discontinued operations OTHER At December 31, 2005 At December 31, 2004 Total debt $12,516 15,002 Common stockholders' equity $52,731 42,723 3
- 4. ConocoPhillips Houston, Texas 77079 Preliminary OPERATING HIGHLIGHTS BY SEGMENT Three Months Ended Twelve Months Ended December 31 December 31 2005 2004 2005 2004 Thousands of Barrels Daily E&P Crude oil produced United States Alaska 291 313 294 298 Lower 48 54 50 59 51 345 363 353 349 Norway 188 211 197 207 United Kingdom 62 66 60 64 Canada 22 24 23 25 China 23 17 23 25 Indonesia 13 18 15 15 Vietnam 37 33 29 33 Timor Sea 36 34 33 21 Other 51 55 53 58 Total consolidated 777 821 786 797 Equity affiliates 116 103 121 108 Total Worldwide 893 924 907 905 Syncrude 20 20 19 21 Natural gas liquids produced United States Alaska* 21 24 20 23 Lower 48 31 26 30 26 52 50 50 49 Norway 11 9 9 8 Canada 10 11 10 10 Timor Sea 19 16 16 9 Other 7 6 6 8 Total Worldwide 99 92 91 84 13 13 9 13 *Includes reinjected volumes sold lease-to-lease. Millions of Cubic Feet Daily Natural gas produced* United States Alaska 172 163 169 165 Lower 48 1,264 1,214 1,212 1,223 1,436 1,377 1,381 1,388 Norway 264 306 272 301 United Kingdom 851 852 751 818 Canada 430 442 425 433 Timor Sea 33 35 34 35 Indonesia 330 266 298 250 Vietnam 19 19 18 16 Other 105 59 84 71 3,468 3,356 3,263 3,312 Total consolidated Equity affiliates 3 4 7 5 Total Worldwide 3,471 3,360 3,270 3,317 *Represents quantities available for sale. Excludes gas equivalent of NGL shown above. Liquefied natural gas sales 118 107 117 105 LUKOIL Investment Production (MBOE/D)* 293 159 246 40 Refinery crude oil throughput (MB/D)* 156 77 122 19 *Represents our estimated net share of LUKOIL. 4
- 5. ConocoPhillips Houston, Texas 77079 Preliminary OPERATING HIGHLIGHTS Three Months Ended Twelve Months Ended December 31 December 31 2005 2004 2005 2004 E&P Per Unit Average sales prices Crude oil (per barrel) United States Alaska $ 57.61 44.37 52.24 38.47 Lower 48 46.62 42.30 45.24 36.95 Total U.S. 55.86 44.08 51.09 38.25 International 54.49 41.75 52.27 37.18 Total consolidated 55.06 42.79 51.74 37.65 Equity affiliates 38.90 26.55 37.79 24.18 Total Worldwide 53.05 40.96 49.87 36.06 Natural gas-lease (per MCF) United States Alaska 3.01 2.23 2.75 2.35 Lower 48 9.37 6.04 7.28 5.46 Total U.S. 9.17 5.92 7.12 5.33 International 7.19 4.63 5.78 4.14 Total consolidated 7.96 5.13 6.32 4.62 Equity affiliates 0.28 0.25 0.26 2.19 Total Worldwide 7.94 5.13 6.30 4.61 Midstream Thousands of Barrels Daily Natural gas liquids extracted Consolidated United States 22 23 22 32 International - 49 25 45 Equity affiliates United States* 172 113 142 111 International 6 7 6 6 200 192 195 194 *Represents 30.3 percent interest in Duke Energy Field Services, LLC (DEFS), through June 30,2005 and 50 percent interest beginning in July 2005. Per Barrel U.S. product prices Weighted average NGL** Consolidated $ 42.70 34.40 36.68 29.38 DEFS 41.84 33.69 35.52 28.60 **Prices are based on index prices from the Mont Belvieu and Conway market hubs that are weighted by natural-gas-liquids component and location mix. 5
- 6. ConocoPhillips Houston, Texas 77079 Three Months Ended Twelve Months Ended December 31 December 31 2005 2004 2005 2004 Thousands of Barrels Daily R&M United States Crude oil capacity 2,182 2,160 2,180 2,164 Crude oil runs 1,853 2,005 1,996 2,059 Refinery production 2,037 2,232 2,186 2,245 International* Crude oil capacity 428 428 428 437 Crude oil runs 435 438 424 396 Refinery production 458 453 439 405 U.S. Petroleum products outside sales Gasoline 1,368 1,415 1,374 1,356 Distillates 653 562 675 553 Aviation fuels 189 195 201 191 Other products 521 613 519 564 2,731 2,785 2,769 2,664 International 490 493 482 477 3,221 3,278 3,251 3,141 Per Gallon U.S. Average sales prices** Automotive gasoline-wholesale $ 1.77 1.40 1.73 1.33 Automotive gasoline-retail 1.96 1.62 1.88 1.52 Distillates-wholesale 2.06 1.41 1.80 1.24 *Includes ConocoPhillips' share of equity affiliates. **Excludes excise taxes. 6