How Automation is Driving Efficiency Through the Last Mile of Reporting
conoco phillips 2004Second Quarter
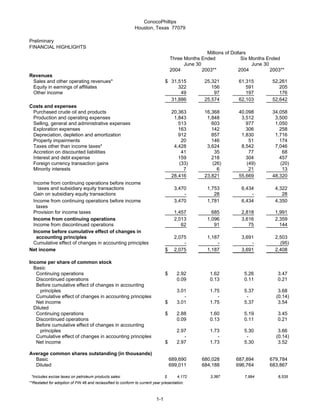
1. ConocoPhillips
Houston, Texas 77079
Preliminary
FINANCIAL HIGHLIGHTS
Millions of Dollars
Three Months Ended Six Months Ended
June 30 June 30
2004 2003** 2004 2003**
Revenues
Sales and other operating revenues* $ 31,515 25,321 61,315 52,261
Equity in earnings of affiliates 322 156 591 205
Other income 49 97 197 176
31,886 25,574 62,103 52,642
Costs and expenses
Purchased crude oil and products 20,363 16,368 40,098 34,058
Production and operating expenses 1,843 1,848 3,512 3,500
Selling, general and administrative expenses 513 603 977 1,050
Exploration expenses 163 142 306 258
Depreciation, depletion and amortization 912 857 1,830 1,716
Property impairments 20 146 51 174
Taxes other than income taxes* 4,428 3,624 8,542 7,046
Accretion on discounted liabilities 41 35 77 68
Interest and debt expense 159 218 304 457
Foreign currency transaction gains (33) (26) (49) (20)
Minority interests 7 6 21 13
28,416 23,821 55,669 48,320
Income from continuing operations before income
taxes and subsidiary equity transactions 3,470 1,753 6,434 4,322
Gain on subsidiary equity transactions - 28 - 28
Income from continuing operations before income 3,470 1,781 6,434 4,350
taxes
Provision for income taxes 1,457 685 2,818 1,991
Income from continuing operations 2,013 1,096 3,616 2,359
Income from discontinued operations 62 91 75 144
Income before cumulative effect of changes in
accounting principles 2,075 1,187 3,691 2,503
Cumulative effect of changes in accounting principles - - - (95)
Net income $ 2,075 1,187 3,691 2,408
Income per share of common stock
Basic
Continuing operations $ 2.92 1.62 5.26 3.47
Discontinued operations 0.09 0.13 0.11 0.21
Before cumulative effect of changes in accounting
principles 3.01 1.75 5.37 3.68
Cumulative effect of changes in accounting principles - - - (0.14)
Net income $ 3.01 1.75 5.37 3.54
Diluted
Continuing operations $ 2.88 1.60 5.19 3.45
Discontinued operations 0.09 0.13 0.11 0.21
Before cumulative effect of changes in accounting
principles 2.97 1.73 5.30 3.66
Cumulative effect of changes in accounting principles - - - (0.14)
Net income $ 2.97 1.73 5.30 3.52
Average common shares outstanding (in thousands)
Basic 689,690 680,028 687,894 679,784
Diluted 699,011 684,188 696,764 683,867
*Includes excise taxes on petroleum products sales: $ 4,172 3,387 7,994 6,535
**Restated for adoption of FIN 46 and reclassified to conform to current year presentation.
1-1
2. ConocoPhillips
Houston, Texas 77079
Preliminary
SELECTED FINANCIAL DATA
Millions of Dollars
Three Months Ended Six Months Ended
June 30 June 30
2004 2003 2004 2003
INCOME/(LOSS) FROM CONTINUING OPERATIONS
E&P
United States $ 671 517 1,306 1,195
International 683 560 1,305 1,007
Total E&P 1,354 1,077 2,611 2,202
Midstream 42 25 97 56
R&M
United States 734 248 1,137 523
International 84 73 145 187
Total R&M 818 321 1,282 710
Chemicals 46 12 85 (11)
Emerging Businesses (29) (23) (51) (57)
Corporate and other (218) (316) (408) (541)
Consolidated $ 2,013 1,096 3,616 2,359
CUMULATIVE EFFECT OF CHANGES IN
ACCOUNTING PRINCIPLES
E&P
United States $ - - - 142
International - - - -
Total E&P - - - 142
Midstream - - - -
R&M
United States - - - (125)
International - - - -
Total R&M - - - (125)
Chemicals - - - -
Emerging Businesses - - - -
Corporate and other - - - (112)
Consolidated $ - - - (95)
INCOME FROM DISCONTINUED OPERATIONS
Corporate and other 62 91 75 144
SUMMARY OF NET INCOME/(LOSS)
E&P
United States $ 671 517 1,306 1,337
International 683 560 1,305 1,007
Total E&P 1,354 1,077 2,611 2,344
Midstream 42 25 97 56
R&M
United States 734 248 1,137 398
International 84 73 145 187
Total R&M 818 321 1,282 585
Chemicals 46 12 85 (11)
Emerging Businesses (29) (23) (51) (57)
Corporate and other (156) (225) (333) (509)
Net income $ 2,075 1,187 3,691 2,408
1-2
3. ConocoPhillips
Houston, Texas 77079
Preliminary
SELECTED FINANCIAL DATA
Three Months Ended Six Months Ended
June 30 June 30
2004 2003 2004 2003
INCOME/(LOSS) FROM CONTINUING
OPERATIONS
Effective tax rate % 42.0 % 38.5 43.8 45.8
Millions of Dollars
FOREIGN CURRENCY GAINS/(LOSSES)
AFTER-TAX
E&P $ 14 (24) 19 (14)
Midstream - - - -
R&M 5 10 6 11
Chemicals - - - -
Emerging Businesses 1 1 1 -
Corporate and other - 18 6 19
$ 20 5 32 16
CASH FLOWS FROM OPERATING ACTIVITIES
Income from continuing operations $ 2,013 1,096 3,616 2,359
Depreciation, depletion and amortization 912 857 1,830 1,716
Property impairments 20 146 51 174
Dry hole costs and leasehold impairment 105 54 192 94
Accretion on discounted liabilities 41 35 77 68
Deferred taxes 310 10 670 253
Undistributed equity earnings (97) (66) (278) (48)
Net gain on asset dispositions (6) (28) (88) (84)
Other 65 (94) 135 (38)
Working capital changes (1,101) 16 (1,878) 652
Net cash provided by continuing operations 2,262 2,026 4,327 5,146
Net cash provided by discontinued operations 14 120 22 120
Net cash provided by operating activities $ 2,276 2,146 4,349 5,266
CAPITAL EXPENDITURES AND INVESTMENTS
E&P
United States $ 308 381 614 707
International 931 786 1,835 1,472
1,239 1,167 2,449 2,179
Midstream 2 2 5 4
R&M 278 245 493 448
Chemicals - - - -
Emerging Businesses 27 98 55 164
Corporate and other* 38 45 63 70
$ 1,584 1,557 3,065 2,865
*Excludes discontinued operations
OTHER
At June 30, 2004 At December 31, 2003
Total debt $15,619 17,780
Common stockholders' equity $37,826 34,366
1-3
4. ConocoPhillips
Houston, Texas 77079
Preliminary
OPERATING HIGHLIGHTS
BY SEGMENT
Three Months Ended Six Months Ended
June 30 June 30
2004 2003 2004 2003
Thousands of Barrels Daily
E&P
Crude oil produced
United States
Alaska 307 331 314 334
Lower 48 52 57 52 58
359 388 366 392
Norway 212 214 213 220
United Kingdom 64 82 66 85
Canada 25 31 26 32
China 28 27 30 25
Indonesia 14 17 15 19
Vietnam 31 15 31 16
Timor Sea 15 3 10 3
Other 61 73 61 73
Total consolidated 809 850 818 865
Equity affiliates 104 117 109 86
Total Worldwide 913 967 927 951
Syncrude 20 19 22 18
Natural gas liquids produced
United States
Alaska* 23 23 25 24
Lower 48 26 26 25 24
49 49 50 48
Norway 8 7 8 8
Canada 10 11 10 11
Other 12 5 10 4
Total Worldwide 79 72 78 71
15 14 15 14
*Includes reinjected volumes sold lease-to-lease.
Millions of Cubic Feet Daily
Natural gas produced*
United States
Alaska 147 162 166 175
Lower 48 1,226 1,311 1,229 1,324
1,373 1,473 1,395 1,499
Norway 303 273 312 289
United Kingdom 821 952 850 977
Canada 437 424 432 430
Timor Sea 32 61 36 61
Indonesia 237 246 243 235
Vietnam 15 - 16 -
Other 81 56 73 54
3,299 3,485 3,357 3,545
Total consolidated
Equity affiliates 4 11 6 11
Total Worldwide 3,303 3,496 3,363 3,556
*Represents quantities available for sale. Excludes gas equivalent of NGL shown above.
Liquefied natural gas sales 82 91 100 111
1-4
5. ConocoPhillips
Houston, Texas 77079
Preliminary
OPERATING HIGHLIGHTS
Three Months Ended Six Months Ended
June 30 June 30
2004 2003 2004 2003
E&P (continued)
Per Unit
Average sales prices
Crude oil (per barrel)
United States
Alaska $ 36.53 27.19 34.68 29.32
Lower 48 34.39 27.34 33.11 29.44
Total U.S. 36.22 27.21 34.45 29.34
International 34.58 25.62 33.02 28.30
Total consolidated 35.32 26.33 33.68 28.76
Equity affiliates 24.30 16.85 21.33 18.02
Total Worldwide 34.00 25.19 32.14 27.82
Natural gas-lease (per MCF)
United States
Alaska 2.23 1.88 2.39 1.92
Lower 48 5.36 4.72 5.13 5.10
Total U.S. 5.22 4.58 5.00 4.96
International 3.92 3.47 4.10 3.70
Total consolidated 4.44 3.92 4.46 4.21
Equity affiliates 0.31 4.89 3.14 4.85
Total Worldwide 4.43 3.93 4.46 4.21
Midstream
Thousands of Barrels Daily
Natural gas liquids extracted
Consolidated
United States 24 53 38 52
International 33 35 40 41
Equity affiliates
United States* 112 110 111 112
International 9 11 11 11
178 209 200 216
*Represents 30.3 percent interest in Duke Energy Field Services LLC (DEFS).
Per Barrel
U.S. product prices
Weighted average NGL**
Consolidated $ 26.42 20.99 26.05 23.29
DEFS 25.61 20.53 25.21 22.53
**Prices are based on index prices from the Mont Belvieu and Conway market hubs that are weighted by natural-gas-liquids
component and location mix.
1-5
6. ConocoPhillips
Houston, Texas 77079
Three Months Ended Six Months Ended
June 30 June 30
2004 2003 2004 2003
Thousands of Barrels Daily
R&M
United States
Crude oil capacity 2,168 2,168 2,168 2,168
Crude oil runs 2,119 2,128 2,112 2,068
Refinery production 2,300 2,357 2,273 2,305
International*
Crude oil capacity 447 442 447 442
Crude oil runs 276 376 325 386
Refinery production 318 407 364 421
U.S. Petroleum products outside sales
Gasoline 1,328 1,381 1,321 1,356
Distillates 538 590 554 595
Aviation fuels 191 164 185 164
Other products 573 493 545 501
2,630 2,628 2,605 2,616
International 440 448 472 438
3,070 3,076 3,077 3,054
Per Gallon
U.S. Average sales prices**
Automotive gasoline-wholesale $ 1.40 1.01 1.28 1.06
Automotive gasoline-retail 1.61 1.34 1.47 1.36
Distillates-wholesale 1.17 0.85 1.09 0.95
*Includes ConocoPhillips' share of equity affiliates.
**Excludes excise taxes.
1-6