Walmart reported net sales figures for December and year-to-date. International sales decreased 10.4% due to currency impacts but increased 8.3% excluding currency. Comparable store sales increased for Walmart US and total US but decreased for Sam's Club. Fourth quarter earnings are expected to be lower than previously estimated due to softer sales at Sam's Club and International as well as higher expenses.
Wal Mart Store Financial ResultsNovember 12/04/08finance1
Walmart reported sales figures for November 2008. Overall sales increased 1.6% compared to November 2007. Walmart US sales increased 6.5% due to positive traffic and average ticket increases. Sam's Club sales increased 1.4% driven by fresh foods and consumables, though fuel price declines reduced comparable sales by 3%. International sales declined 11% due to currency fluctuations but increased 7.7% excluding currency effects. Walmart expects December comparable sales to be near the high end of 1-3% guidance.
Wal Mart Store Financial ResultsMay 06/05/08finance1
Wal-Mart reported a 9.8% increase in total net sales for the four-week period ending May 30, 2008 compared to the same period the previous year. Comparable store sales increased 4.0% for Wal-Mart Stores, 6.5% for Sam's Club, and 4.4% for total US stores. Internationally, sales grew strongest in the UK, Brazil, and China. For the upcoming five-week period in June, Wal-Mart estimates comparable store sales in the US to increase between 2-4%, excluding fuel.
Wal-Mart reported its sales figures for October and the first 39 weeks of the fiscal year. Total sales increased 8.4% to $27.92 billion for the 4-week period and increased 8.6% to $269.81 billion for the 39-week period compared to the same periods last year. Comparable store sales increased 0.0% for Walmart stores and 2.7% for Sam's Club in the US for the 4-week period. The company expects US comparable store sales to be between flat and up 2% for the upcoming November period.
Wal-Mart reported sales results for the 5-week and 35-week periods ending October 5, 2007. Comparable store sales increased 0.8% for Wal-Mart Stores and 4.4% for Sam's Club in the US. Internationally, the UK, Brazil, and China saw continued growth while Mexico slowed. Based on the sales results, Wal-Mart raised its quarterly earnings guidance from $0.62-0.65 to $0.66-0.69 per share.
- Walmart reported record second quarter earnings for fiscal year 2009, with net sales of over $101.6 billion, a 10.4% increase from the previous year, and income from continuing operations of $3.385 billion, a 9.3% increase.
- The company raised its full-year earnings forecast, expecting earnings per share from continuing operations to be between $3.43 to $3.50, up from a previous range.
- For the third quarter of fiscal year 2009, the company estimates comparable store sales in the US to increase between 1-2% and earnings per share to be between $0.73-$0.76.
The document provides an executive summary of franchise sales and locations for 2007 compared to 2006. Some of the key findings include:
- Worldwide franchise sales increased 4.76% to $443.8 billion in 2007 from $423.6 billion in 2006.
- The number of total operating locations decreased slightly by 0.38% while international locations grew by 2.08%.
- Convenience stores like 7-Eleven, Circle K, and ampm saw strong sales growth, buoyed by high gas prices.
- Casual dining restaurants also fared well and added new chains to the top 200 list, with many showing substantial growth.
- Hotels performed well despite the slowing economy
Wal-Mart reported its sales figures for March 2007. Total sales were $30.675 billion, an 11.7% increase from March 2006. Comparable store sales increased 4% in the US. For April 2007, Wal-Mart expects comparable sales in the US to be flat to down 2% due to the shift in Easter and strong sales in April 2006. Earnings per share for the first quarter of fiscal year 2008 are estimated to be between $0.68 to $0.71.
Mercer Capital's Value Focus: Convenience Store Industry | Q1 2016 | Segment:...Mercer Capital
Mercer Capital’s Convenience Store Industry newsletter is a quarterly publication providing perspective on valuation issues pertinent to multi-unit retailing and QSR industries.
Here is the latest market results for the South Jefferson County area. If youb would like your neighborhoods sats send me an email and I will forwardand let me know where you live
Mercer Capital's Value Focus: Convenience Store Industry | Q2 2016 | Segment:...Mercer Capital
The document provides an overview and analysis of the convenience store, grocery store, and fast food industries. It discusses equity market performance for publicly traded companies in each segment. Valuations as measured by EBITDA multiples declined slightly for convenience stores but fell more for grocery stores during the quarter. Retail gasoline margins ended the first quarter well below historical averages but rebounded some in the following months. Generally fuel accounts for over 70% of convenience store sales but only one-third of gross margins, which have averaged 19.7 cents per gallon in recent years.
This document provides an analysis of Dow Jones & Company. It recommends buying Dow Jones stock, assigning it an intrinsic value of $44.82 based on a three-stage cash flow model, providing a 13% margin of safety from the current market price of $39.63. It then discusses challenges facing Dow Jones, including deteriorating performance at its Telerate division, shareholder pressure for improved returns, and secular growth in its business publishing unit.
Noble Roman's Inc provides information on its business model which focuses on licensing and franchising non-traditional pizza franchises, grocery take-n-bake pizza distribution, and stand-alone take-n-bake pizza franchises. It highlights historical revenue and profit growth, a sustainable and profitable business model positioned in the fast-growing take-n-bake pizza industry segment, and an experienced management team focused on continued growth and profitability.
The RayChel Realty Group's San Mateo County Real Estate Price Report indicated homes sold 26% faster in October than they did in September. And, 39% of San Mateo County home sellers received more than their original list prices. For more San Mateo County real estate statistics, as well as the San Carlos, Belmont, Redwood City, Foster City and San Mateo real estate markets analyzed by city, download this free market report.
Wal Mart Store Financial ResultsOctober 11/06/08finance1
Walmart reported sales results for October 2008, with total sales up 2.3% compared to the same period last year. Comparable store sales in the US increased 2.4% overall, led by a 2.2% increase at Walmart stores. International sales decreased 5.9% due to a strengthening US dollar but increased 8.9% excluding currency effects. The company expects US comparable store sales in November to increase between 1-3%.
Wal Mart Store Financial ResultsFebruary 03/07/08finance1
Wal-Mart reported an 8.9% increase in total net sales for the four-week period ending February 29, 2008 compared to the same period the previous year. Comparable store sales increased 2.6% in the US and international sales increased 19.8%. Strength was seen in grocery, health and wellness, and entertainment categories in the US. The company estimates comparable store sales in the US to be flat to up 2% for the upcoming five-week period.
wal mart store Quarterly Earnings Releases2009finance1
- Wal-Mart reported record second quarter earnings for fiscal year 2009, with net sales increasing 10.4% to $101.6 billion and income from continuing operations increasing 9.3% to $3.385 billion.
- Comparable store sales in the US increased 4.5% for the quarter without fuel and 5.0% with fuel.
- The company raised its full-year earnings forecast to between $3.43 to $3.50 per share based on solid operating performance and capital efficiency in the first half of the year.
wal mart store Quarterly Earnings Releases2008finance1
Wal-Mart reported record sales and earnings for the fourth quarter and full fiscal year of 2008. Fourth quarter sales reached $106.3 billion, an 8.3% increase over the previous year. Net income increased 4% to $4.1 billion compared to $3.9 billion last year. For the full fiscal year, sales increased 8.6% to $374.5 billion and net income grew 5.8% to $12.9 billion. The company expects continued earnings growth in fiscal year 2009, forecasting earnings per share between $3.30-$3.43.
This document summarizes the US confectionery market in early 2009. It notes that the US and world economies were in recession in 2008, negatively impacting consumer spending and retail sales. Commodity prices for cocoa, sugar, and corn sweeteners reached historic highs in 2008. The confectionery category experienced retail sales growth of 2.2% but manufacturers' shipments grew only 1% as consumers shifted spending to value channels. Chocolate candy makes up 58% of the confectionery category. Seasonal confectionery sales, such as Easter and Christmas, declined in 2008 compared to previous years. Trends in 2009 included growth of everyday gourmet chocolate, dark chocolate, and value products.
Walmart and Target reported strong second quarter results driven by increased online sales and improved profitability during the pandemic. The analyst expects this trend to continue in the second half of 2020 and 2021, with elevated online sales and higher margins as consumers limit shopping trips. Store sales may soften in the third quarter as economic uncertainty rises but rebound in the fourth quarter. Underlying profitability and cash flow are improving significantly for the retailers due to higher sales and lower expenses.
Wal-Mart reported third quarter sales of $90.9 billion, an 8.8% increase over the prior year. Net income was $2.86 billion. Comparable store sales in the US increased 1.5% with fuel and 1.4% without. For the fourth quarter, Wal-Mart estimates US comparable store sales will be flat to up 2% and earnings per share will be between $0.99-$1.03.
wal mart store Quarterly Earnings Releases2008finance1
Wal-Mart reported third quarter sales of $90.9 billion, an 8.8% increase over the prior year. Net income was $2.86 billion. Comparable store sales in the US increased 1.5% with fuel and 1.4% without. For the fourth quarter, Wal-Mart estimates US comparable store sales will be flat to up 2% and earnings per share will be between $0.99-$1.03.
- Wal-Mart reported third quarter fiscal year 2009 results, with net sales increasing 7.5% to $97.6 billion and income from continuing operations increasing 6.6% to $3.03 billion compared to the previous year.
- US comparable store sales increased 2.7% for Walmart and 4.5% for Sam's Club. International sales grew 11.2% and segment operating income increased 10.6%.
- For the full fiscal year, Wal-Mart estimates diluted earnings per share will be between $3.42-$3.46, lowered from previous guidance due to currency exchange rate impacts.
Walmart's Q1 sales increased nearly 9% to $134.6 billion due to strong demand during the COVID-19 pandemic. Ecommerce sales grew 74% in the US and 40% for Sam's Club. Operating income rose 6% to $5.2 billion despite $900 million in additional pandemic-related costs. The company withdrew its full-year guidance due to uncertainty around the pandemic's impact and economic stimulus measures.
Target's and Walmart's and what's happening to the retailthomas paulson
Walmart and Target's second quarter results showed improving profitability and cash generation for mega-discounters. Walmart and Target gained market share profitably while other retailers lost sales and profitability. Strong safety protocols implemented during COVID-19 helped boost customer loyalty and repeat visits. Trip consolidation increased significantly during the quarter, benefiting Walmart and Target and leaving other retailers behind. Looking ahead, underlying profit growth at Walmart is expected to continue in the second half of 2020, driven by expense leverage and lower online losses. However, store sales may soften due to economic uncertainty while digital sales growth remains robust.
What's happening i the housing market for Southwest California? Sales lag, prices climb, inventory up, affordability down - and watch out for that election.
US National Confectioners Association Trends ReportNeil Kimberley
This document provides an overview of the US confectionery market in 2007-2008. It summarizes that total retail sales were $29.1 billion in 2007, with manufacturers' shipments growing 3% to $18.9 billion. The top performing retail channels for confectionery were convenience stores, club stores, dollar stores, and drug stores. The chocolate category accounted for 56% of confectionery sales. The market is diverse with over 300 manufacturers, though the top 5 companies comprise 70% of the market.
Wal-Mart reported second quarter sales of $91.99 billion, an 8.8% increase over the previous year. Net income was $3.11 billion, a 4.1% increase. Earnings per share were $0.76. For the third quarter, Wal-Mart estimates comparable store sales will increase 1-3% and earnings per share will be $0.62-$0.65. For the full fiscal year, earnings per share are estimated at $3.05-$3.13.
Retail apocolypse and pension fund culpabilitythomas paulson
1) The retail apocalypse was caused by a combination of factors including adverse demographics, income bifurcation, student loan debt, supply-demand imbalance from overexpansion by retailers, more efficient business models like Amazon, and changes in consumer behavior toward e-commerce and mobile shopping.
2) E-commerce growth was significantly underappreciated as statistics undercounted sales on marketplaces and overcounted the retail sector by including categories like auto sales. This led to retailers being unprepared for the large shift to online shopping.
3) Private equity ownership of retailers exacerbated problems as high debt levels limited their ability to adapt to changes and led to market share losses and bankruptcies for some retailers.
Are you looking for information on how to sell your wine, beer and spirits in the United States? How about current in-depth data analysis on the US adult beverage industry?
In their recent seminar at the London Wine Fair, Sid Patel (CEO of Beverage Trade Network), John Beaudette (President of MHW) and Steve Raye (President of Bevology, Inc.) outlined current market conditions and innovative market strategies for wineries, breweries and distilleries looking to enter the US in “The Insider’s Guide to Penetrating the US Market.”
The seminar outlined a full overview of the current state of the US market place where John, Raye and Sid gave complete analysis on how to successfully launch and support brands across the three tier system by leveraging partnerships and using innovative programs.
Sid Patel, Steve Rays and John Beaudette's presentation at London Wine Fair. Tips for wineries, breweries and distilleries for Penetrating the US Market.
U.S. Wine Market: Webinar on Entering the U.S. marketBevology Inc.
Insightful presentation with practical information for wine and spirit suppliers looking to enter the U.S. market. Presented by Steve Raye, President of Bevology Inc.
The document discusses mixed signals in the housing market recovery based on recent economic data and housing reports. It begins by noting that March saw improvements in home sales and prices locally, but the overall outlook is mixed based on other articles. One article points to stalled consumer sentiment while another shows a surge in housing demand. Economic forecasts were revised down based on weaker-than-expected job growth numbers in March. The local real estate market saw a jump in home sales in March with reduced inventory and seller skepticism despite signs of a strong seller's market. The impact of potential water rate increases on the recovery is uncertain.
Similar to Wal Mart Store Financial ResultsDecember 01/08/09 (20)
This document provides financial and operational results for AT&T's wireless segment. Some key highlights include:
- Wireless operating revenues for 2008 were $49.3 billion, up 15.6% from 2007. Segment income was $10.8 billion for 2008, up 58.5% from 2007.
- As of December 31, 2008, AT&T had 77 million wireless customers, up 10.4% from a year earlier. Postpaid subscribers totaled 60.1 million in Q4 2008.
- Wireless data revenues in Q4 2008 were $3.1 billion, up 51.7% year-over-year, reflecting increased data usage and adoption of smartphones.
AT&T reported strong first quarter 2008 results with consolidated revenue growth of 4.6% year-over-year, led by improved results in wireless and enterprise services. Wireless revenues increased 18.3% due to strong subscriber gains and growth in wireless data services, and AT&T added 1.3 million wireless subscribers. Enterprise revenues grew led by a 22.9% increase in IP-based data services. Adjusted earnings per share grew 13.8% over the first quarter of 2007, highlighting AT&T's 12th consecutive quarter of double-digit earnings growth.
AT&T reported solid second quarter results in 2008, with key highlights including:
- Wireless revenues grew 15.8% driven by subscriber gains and 52% growth in wireless data services. Total wireless subscribers increased by over 1.3 million.
- Wholesale customer revenue declines improved, with revenues down just 0.2% versus a year ago.
- EPS was $0.63, up from $0.47 a year ago, while adjusted EPS was $0.76, up from $0.70 a year ago.
AT&T reported strong third quarter results in 2008, highlighted by growth in wireless subscribers and revenues. They gained 2 million new wireless subscribers total, with a record 1.7 million postpaid additions. This growth was powered by 2.4 million activations of the new iPhone 3G and rapid adoption of wireless data services. AT&T also grew its U-verse TV subscriber base to 781,000 and saw stable trends in business services. However, earnings were reduced by costs associated with the iPhone launch and hurricane-related expenses.
AT&T reported fourth quarter and full year 2008 results, highlighting strong wireless subscriber gains, accelerated growth of U-verse TV subscribers passing 1 million, and continued double-digit growth in IP data services. Wireless revenues grew 13.2% in Q4 2008 led by a 51.2% increase in wireless data revenues. AT&T added 2.1 million wireless subscribers in Q4 2008 and accelerated its U-verse TV ramp with 264,000 new subscribers. For the full year 2008, AT&T reported revenues of $124 billion, net income of $12.9 billion, and earnings per share increased 11.3% over 2007.
This document provides financial and operational results for AT&T across several business segments. Key highlights include:
- Wireless operating revenues increased 6% to $49.3 billion in 2008, with segment income increasing 58% to $10.8 billion. The number of wireless customers grew 5% to over 77 million.
- Wireline operating revenues declined 2% to $69.9 billion while segment income declined 7% to $11.2 billion in 2008 compared to 2007.
- Advertising & Publishing operating revenues declined 6% to $5.5 billion in 2008, with segment income declining 20% to $1.7 billion.
This document is a notice and proxy statement for the 2000 Annual Meeting of Share Owners of General Electric Company. It provides information on items to be voted on at the meeting, including the election of 16 directors, appointment of independent auditors, a proposal to increase authorized shares for a 3-for-1 stock split, and 11 shareholder proposals. Brief biographies of the 16 nominees for director positions are also included.
This document is a notice and proxy statement for General Electric Company's 2001 Annual Meeting. It provides information on the date, time, and location of the meeting, as well as details on voting procedures. Shareholders will vote on electing directors, appointing independent auditors, and seven shareholder proposals relating to issues such as cumulative voting, workplace codes of conduct, and nuclear power reporting. Biographies of the 19 nominees for director positions are also included.
The document is a notice and proxy statement for General Electric's 2002 Annual Meeting. It provides details about the meeting such as the date, time, and location in Waukesha, Wisconsin. It also lists the items to be voted on including the election of directors, appointment of auditors, executive compensation plans, and eight shareholder proposals. Biographies are provided for the 16 nominees up for election to the board of directors.
The document is a notice and proxy statement for General Electric's 2003 annual shareholder meeting. It provides details on the meeting such as date, time, location, and items to be voted on including election of directors and appointment of auditors. It also includes biographies of the 17 nominees for election to the board of directors.
The document is a notice and proxy statement for General Electric's 2004 Annual Meeting. It notifies shareholders that the meeting will be held on April 28, 2004 in Louisville, Kentucky at 10:00am to vote on the election of directors, ratification of the independent auditor selection, adding a revenue measurement to executive performance goals, and 15 shareholder proposals. Shareholders of record as of March 1, 2004 are entitled to vote.
The document is a notice and proxy statement for General Electric's 2005 Annual Meeting. It provides information on the date, time, and location of the meeting in Cincinnati, Ohio. It lists 15 nominees for election to the board of directors and provides brief biographies for each nominee. It also lists several matters that will be voted on at the meeting, including the election of directors, ratification of the independent auditor, and seven shareholder proposals.
The document is a notice and proxy statement for General Electric's 2006 Annual Meeting. It provides details on the meeting such as the date, time, and location in Philadelphia. It lists 15 nominees for election to the board of directors and provides brief biographies for each. It also lists several matters that will be voted on including the election of directors, ratification of the independent auditor, and six shareholder proposals.
This document provides preliminary financial highlights and operating metrics for ConocoPhillips for the first quarter of 2004 compared to the first quarter of 2003. Some key figures include:
- Total revenues of $30.2 billion for the first quarter of 2004, up from $27.1 billion in the same period of 2003.
- Net income of $1.6 billion for the first quarter of 2004, up from $1.2 billion in the first quarter of 2003.
- Oil and gas production of 941 thousand barrels per day for the first quarter of 2004, up slightly from 935 thousand barrels per day in the same period of 2003.
ConocoPhillips reported financial highlights for the second quarter of 2004 including revenues of $31.9 billion and net income of $2.1 billion. Earnings per share were $3.01 for the quarter. The company experienced higher crude oil and natural gas sales prices and volumes compared to the prior year. However, costs and expenses also increased, including purchases of crude oil and products, production and operating expenses, and taxes.
- ConocoPhillips reported revenues of $34.7 billion for Q3 2004, up from $26.5 billion in Q3 2003, and net income of $2 billion, up from $1.3 billion.
- Earnings per share for Q3 2004 were $2.86, up from $1.90 in Q3 2003.
- Oil and gas production volumes were up slightly from Q3 2003, with crude oil production of 733 thousand barrels per day consolidated and 844 thousand barrels per day total.
- ConocoPhillips reported significantly higher revenues and net income for both the fourth quarter and full year 2004 compared to the same periods in 2003, driven by higher oil and gas prices and increased production volumes.
- Revenues for the fourth quarter of 2004 were $40.1 billion, up 54% from $26 billion in the fourth quarter of 2003. Net income for the fourth quarter was $2.4 billion, up 138% from $1 billion.
- For the full year 2004, revenues were $136.9 billion compared to $105.1 billion in 2003. Net income was $8.1 billion compared to $4.7 billion in 2003.
This document provides financial highlights and selected financial data for ConocoPhillips for the first quarter of 2005 compared to the first quarter of 2004. Some key figures include:
- Net income for Q1 2005 was $2.912 billion compared to $1.616 billion in Q1 2004.
- Income from continuing operations was $2.923 billion in Q1 2005 compared to $1.603 billion in Q1 2004.
- Total worldwide crude oil and natural gas production was 942 thousand barrels of oil equivalent per day in Q1 2005.
- Total revenues for Q1 2005 were $38.918 billion compared to $30.217 billion in Q1 2004.
ConocoPhillips reported financial results for the third quarter and first nine months of 2005:
- Revenues for the quarter increased to $49.7 billion, up from $34.7 billion in the same period last year, driven by higher oil and gas prices. Net income was $3.8 billion compared to $2 billion last year.
- For the first nine months of the year, revenues were $131.2 billion compared to $96.8 billion last year. Net income was $9.85 billion compared to $5.7 billion in the same period of 2004.
- Oil and gas production for the quarter averaged 790 thousand barrels of oil equivalent per day for
This document provides financial highlights and selected financial data for ConocoPhillips for the three month and twelve month periods ending December 31, 2005 and 2004. Some key details include:
- Revenues for the three months ending December 31, 2005 were $52.2 billion compared to $40.1 billion for the same period in 2004.
- Net income for the twelve months ending December 31, 2005 was $13.5 billion compared to $8.1 billion for the same period in 2004.
- Earnings per share (diluted) for continuing operations for the twelve months ending December 31, 2005 were $9.63 compared to $5.79 for the same period in 2004.
Monthly Market Risk Update: June 2024 [SlideShare]Commonwealth
Markets rallied in May, with all three major U.S. equity indices up for the month, said Sam Millette, director of fixed income, in his latest Market Risk Update.
For more market updates, subscribe to The Independent Market Observer at https://blog.commonwealth.com/independent-market-observer.
Navigating Your Financial Future: Comprehensive Planning with Mike Baumannmikebaumannfinancial
Learn how financial planner Mike Baumann helps individuals and families articulate their financial aspirations and develop tailored plans. This presentation delves into budgeting, investment strategies, retirement planning, tax optimization, and the importance of ongoing plan adjustments.
An accounting information system (AIS) refers to tools and systems designed for the collection and display of accounting information so accountants and executives can make informed decisions.
Poonawalla Fincorp’s Strategy to Achieve Industry-Leading NPA Metricsshruti1menon2
Poonawalla Fincorp Limited, under the leadership of Managing Director Abhay Bhutada, has achieved industry-leading Gross Non-Performing Assets (GNPA) below 1% and Net Non-Performing Assets (NNPA) below 0.5% as of May 31, 2024. This success is attributed to a strategic vision focusing on prudent credit policies, robust risk management, and digital transformation. Bhutada's leadership has driven the company to exceed its targets ahead of schedule, emphasizing rigorous credit assessment, advanced risk management, and enhanced collection efficiency. By prioritizing customer-centric solutions, leveraging digital innovation, and maintaining strong financial performance, Poonawalla Fincorp sets new benchmarks in the industry. With a continued focus on asset quality, digital enhancement, and exploring growth opportunities, the company is well-positioned for sustained success in the future.
Calculation of compliance cost: Veterinary and sanitary control of aquatic bi...Alexander Belyaev
Calculation of compliance cost in the fishing industry of Russia after extended SCM model (Veterinary and sanitary control of aquatic biological resources (ABR) - Preparation of documents, passing expertise)
How to Invest in Cryptocurrency for Beginners: A Complete GuideDaniel
Cryptocurrency is digital money that operates independently of a central authority, utilizing cryptography for security. Unlike traditional currencies issued by governments (fiat currencies), cryptocurrencies are decentralized and typically operate on a technology called blockchain. Each cryptocurrency transaction is recorded on a public ledger, ensuring transparency and security.
Cryptocurrencies can be used for various purposes, including online purchases, investment opportunities, and as a means of transferring value globally without the need for intermediaries like banks.
How to Invest in Cryptocurrency for Beginners: A Complete Guide
Wal Mart Store Financial ResultsDecember 01/08/09
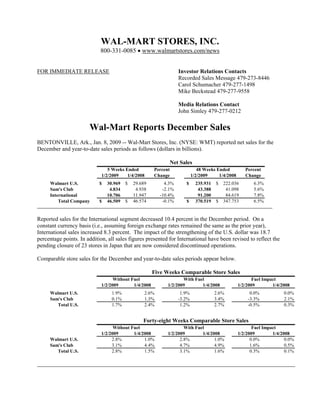
1. WAL-MART STORES, INC.
800-331-0085 • www.walmartstores.com/news
FOR IMMEDIATE RELEASE Investor Relations Contacts
Recorded Sales Message 479-273-8446
Carol Schumacher 479-277-1498
Mike Beckstead 479-277-9558
Media Relations Contact
John Simley 479-277-0212
Wal-Mart Reports December Sales
BENTONVILLE, Ark., Jan. 8, 2009 -- Wal-Mart Stores, Inc. (NYSE: WMT) reported net sales for the
December and year-to-date sales periods as follows (dollars in billions).
Net Sales
5 Weeks Ended Percent 48 Weeks Ended Percent
1/2/2009 1/4/2008 Change 1/2/2009 1/4/2008 Change
$ 29.689 4.3% $ 222.036 6.3%
Walmart U.S. $ 30.969 $ 235.931
4.938 -2.1% 41.098 5.6%
Sam's Club 4.834 43.388
11.947 -10.4% 84.619 7.8%
International 10.706 91.200
$ 46.574 -0.1% $ 347.753 6.5%
Total Company $ 46.509 $ 370.519
Reported sales for the International segment decreased 10.4 percent in the December period. On a
constant currency basis (i.e., assuming foreign exchange rates remained the same as the prior year),
International sales increased 8.3 percent. The impact of the strengthening of the U.S. dollar was 18.7
percentage points. In addition, all sales figures presented for International have been revised to reflect the
pending closure of 23 stores in Japan that are now considered discontinued operations.
Comparable store sales for the December and year-to-date sales periods appear below.
Five Weeks Comparable Store Sales
Without Fuel With Fuel Fuel Impact
1/2/2009 1/4/2008 1/2/2009 1/4/2008 1/2/2009 1/4/2008
1.9% 2.6% 1.9% 2.6% 0.0% 0.0%
Walmart U.S.
0.1% 1.3% -3.2% 3.4% -3.3% 2.1%
Sam's Club
1.7% 2.4% 1.2% 2.7% -0.5% 0.3%
Total U.S.
Forty-eight Weeks Comparable Store Sales
Without Fuel With Fuel Fuel Impact
1/2/2009 1/4/2008 1/2/2009 1/4/2008 1/2/2009 1/4/2008
2.8% 1.0% 2.8% 1.0% 0.0% 0.0%
Walmart U.S.
3.1% 4.4% 4.7% 4.9% 1.6% 0.5%
Sam's Club
2.8% 1.5% 3.1% 1.6% 0.3% 0.1%
Total U.S.
2. 2
Walmart U.S.
“Due to the difficult economy and severe winter weather in some regions, the holiday season was more
challenging for retailers than expected,” said Eduardo Castro-Wright, vice chairman, Wal-Mart Stores,
Inc. “We are pleased that we had positive traffic for the third month in a row and that Walmart performed
relatively well given the environment.”
With mid-single digit comparable store sales results, grocery and health and wellness were the primary
sales drivers for Walmart U.S. in the December period. Electronics sales were solid, while apparel and
jewelry were soft. Weather conditions slowed sales in several areas of the country the week before
Christmas, forcing the closure of 40 stores for periods ranging from two hours to nine days.
“We believe we continue to gain market share on the strength of positive traffic in response to Walmart’s
price leadership, as well as overall customer experience improvements,” Castro-Wright added.
Sales at walmart.com were significantly ahead of the same period last year, led by sales of entertainment
and home products and the site-to-store program.
Sam’s Club
Overall, sales for the holiday season at Sam’s Club were below expectations. Sales results were softer in
the first three weeks, with improved performance during the last two weeks of the December period.
Winter storms negatively impacted traffic and sales in some markets. Traffic increased for both Business
and Advantage members. However, average ticket declined for both Business and Advantage members.
Sales strengths continued in fresh food, dry grocery and consumables. Continued softness in general
merchandise had a greater negative impact on sales during this period when general merchandise usually
comprises a larger share of sales. Jewelry and home-related products were among the softer categories.
“Relative to our plan, sales came very late in the reporting period,” said Doug McMillon, Sam’s Club
president and chief executive officer. “Our members were clearly cautious with their discretionary
spending. Our small business members in particular continue to face more pressure from today’s economy
and also are more selective in their purchases.”
Continued significant declines in fuel prices resulted in reduced fuel sales in comparison to last year.
Wal-Mart International
“Our customers around the world continue to feel pressure from the current global economy, leading to
sales for Wal-Mart International that were below expectations,” said Mike Duke, vice chairman, Wal-Mart
Stores, Inc. “As we see consumers focusing on the necessities in this environment, we are reinforcing the
value we provide to them through our every day low price philosophy.”
Sales from each country are covered on a constant currency basis, excluding any impact from changes in
exchange rates.
In the U.K., ASDA experienced one of the company’s strongest Christmas sales seasons, which concluded
a quarter of strengthening comparable store sales, without fuel. Sales were strongest in core grocery and
George apparel. Traffic was up significantly in the week before Christmas, as sales came later than ever
before. ASDA had record sales for a single day on Dec. 23.
3. 3
Yesterday, Wal-Mart de México announced a comparable store sales increase of 0.6 percent for the
December period, reflecting the country’s continued economic slowdown. Walmex is aggressively
reinforcing its price position, driving increased customer traffic at self-service formats, particularly
Bodega Aurrera. Superama stores showed the strongest comparable store sales.
At Wal-Mart Canada, comparable store sales were in the low single digits driven by an increase in average
ticket and strong sales following Christmas. Food and consumables, as well as electronics, seasonal and
cold weather categories performed well. Apparel sales were weaker than expected.
In December, Wal-Mart Brazil opened 11 new stores, more than in any month since Wal-Mart entered
Brazil in 1995. Todo Dia, supermarkets in the south and hypermarkets in the southeast all achieved solid
real comparable store sales in the low single digits. The cash and carry format, Maxxi, continued its strong
performance, with customer count increasing in the low double digits.
In Japan, comparable store sales were positive, driven by the shift to every day low pricing in food and
consumables and by solid customer response to direct import items. Sales in general merchandise and
apparel were soft due to the general downturn in the economy, with the exception of baby, which is
growing due to the shift to every day low pricing.
Higher average ticket drove comparable store sales increases in the mid single digits at both Wal-Mart
China and Trust-Mart.
Guidance
“The current economy remains challenging for all businesses, and retailers have already seen customers
pull back on discretionary spending. Consumers are very focused on value and necessities,” said Tom
Schoewe, executive vice president and chief financial officer. “We expect comparable store sales for the
January four-week period to be between flat and two percent.”
The January period runs from Saturday, Jan. 3 through Friday, Jan. 30, 2009.
“Our previous fourth quarter guidance for earnings per share from continuing operations was a range of
$1.03 to $1.07, which we provided Nov. 13. This range reflected our expectation that changes in currency
exchange rates would negatively affect this year’s fourth quarter results by approximately six cents per
share,” Schoewe said. “The company announced on Dec. 23 that earnings per share from continuing
operations also would be negatively impacted by approximately six cents, stemming from the after-tax
charge for the settlement of 63 class action wage and hour lawsuits.
“Our fourth quarter sales for Sam’s Club and Wal-Mart International are trending below our expectations
and our expenses are higher than anticipated. Therefore, we now expect fourth quarter earnings per share
from continuing operations to be between $0.91 and $0.94,” Schoewe added. “Considering the impact of
currency and litigation charges, we continue to expect our underlying operating performance for the fourth
quarter of fiscal 2009 to be at or above the prior year’s quarter.”
The company will report January sales Feb. 5 and fourth quarter earnings Feb. 17.
Wal-Mart Stores, Inc. operates Walmart discount stores, supercenters, Neighborhood Markets and Sam’s
Club locations in the United States. The Company operates in Argentina, Brazil, Canada, China, Costa
Rica, El Salvador, Guatemala, Honduras, Japan, Mexico, Nicaragua, Puerto Rico and the United Kingdom
and, through a joint venture, in India. The Company's common stock is listed on the New York Stock
Exchange under the symbol WMT. More information about Wal-Mart can be found by visiting
www.walmartstores.com. Online merchandise sales are available at www.walmart.com and
www.samsclub.com.
4. 4
###
This release contains statements that Wal-Mart believes are “forward-looking statements” within the
meaning of the Private Securities Litigation Reform Act of 1995, as amended, and that are intended to
enjoy the protection of the safe harbor for forward-looking statements provided by that act. These
forward-looking statements relate to our management’s expectations for our comparable store sales in the
United States for the January four-week reporting period to end January 30, 2009 and management’s
expectations for our earnings per share from continuing operations and the Company’s underlying
operating performance for the quarter to end January 31, 2009. These statements are identified by use of
the word “expect” in the statements. These forward-looking statements are subject to risks, uncertainties
and other factors, domestically and internationally, including general economic conditions, the availability
of consumer credit, consumer spending patterns and debt levels, unemployment levels, fuel prices,
inflation levels, weather conditions, competitive pressures and other risks. The Company discusses certain
of these matters and other risk factors more fully in its filings with the SEC, including its most recent
annual report on Form 10-K filed with the SEC. This release should be read in conjunction with that
annual report on Form 10-K and certain other Company filings with the SEC through the date of this
release. The Company urges you to consider all of these risks, uncertainties and other factors carefully in
evaluating the forward-looking statements made in this release and not to place undue reliance on such
statements. As a result of these and other matters, including changes in facts, assumptions not being
realized or other circumstances, our actual results may differ materially from those discussed in such
forward-looking statements. The forward-looking statements included in this release are made only as of
the date of this release, and we undertake no obligation to update any of such statements to reflect
subsequent events or circumstances.