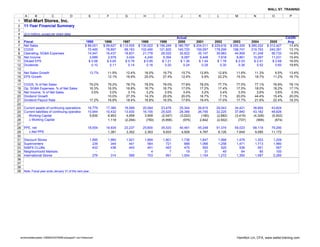
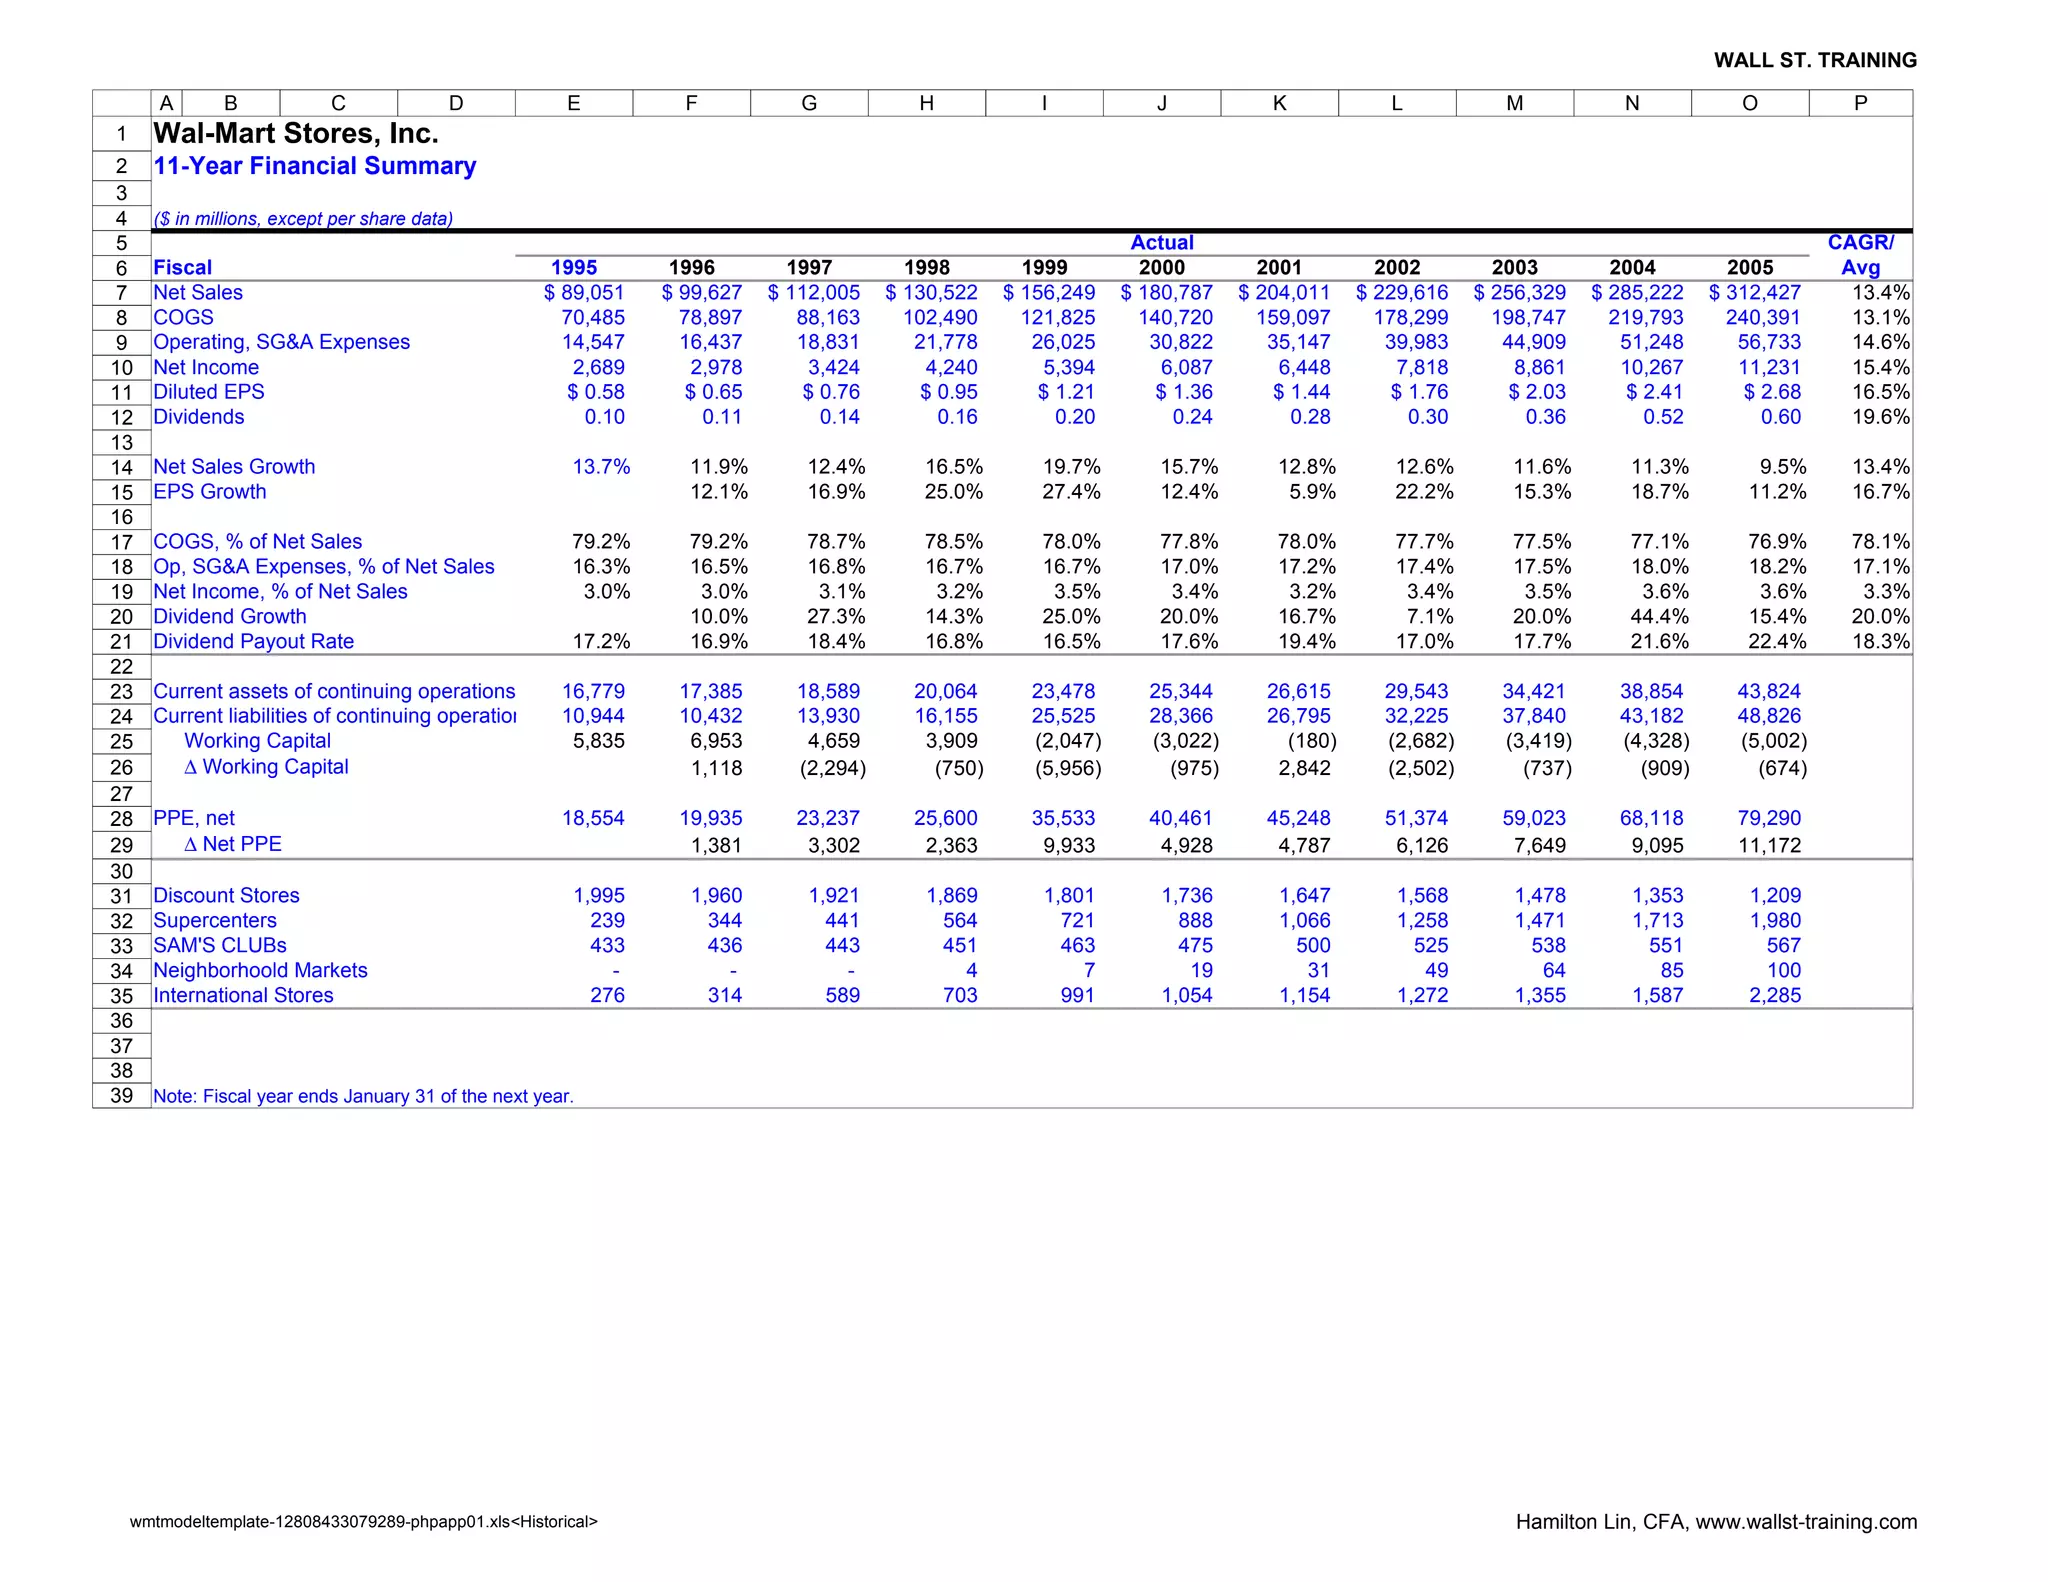
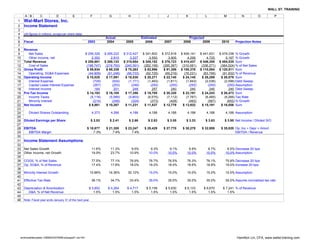
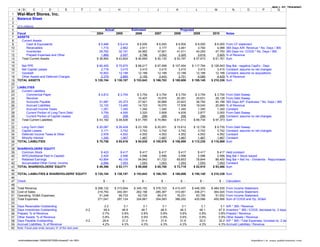
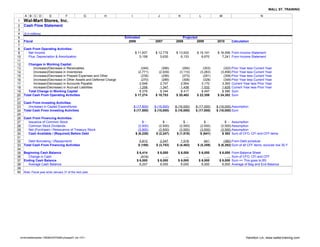
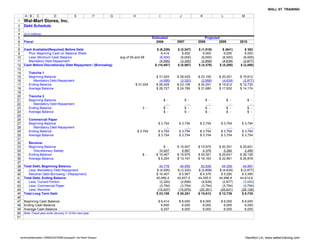
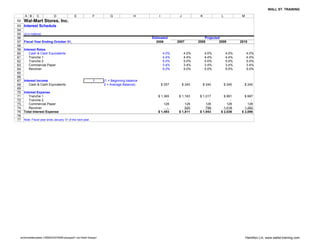
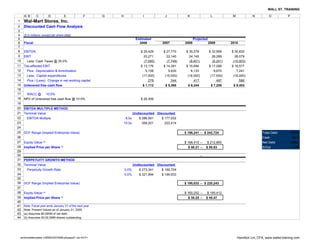
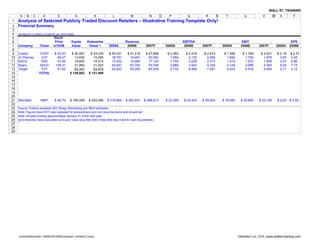
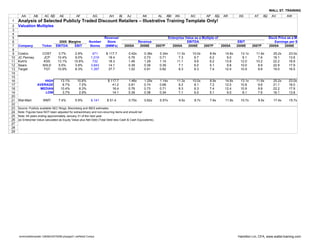
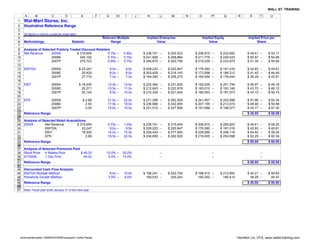
The document provides an 11-year financial summary of Wal-Mart Stores, Inc. from 1995 to 2005, showing key metrics such as net sales, operating expenses, net income, and earnings per share grew at a compound annual growth rate of around 15%. It also includes projections for financial statements such as the income statement and balance sheet from 2006 to 2010, with assumptions around revenue, expense, and capital expenditure growth rates.
This document contains an analysis of Activision Blizzard using a discounted cash flow valuation model. It projects revenue, costs, earnings, and cash flows for Activision Blizzard through 2013 and estimates a terminal value and enterprise value of $18.1 billion. This results in a projected share price of $13.87, higher than the current price of $10.87. The analysis assumes long-term revenue growth rates of 10% for product sales and subscriptions. A terminal growth rate of 5% and discount rate of 8.18% are used to calculate the terminal and net present values.
The document is Bed Bath & Beyond's 2005 annual report, notice of annual meeting, and proxy statement. It summarizes the company's strong financial performance in fiscal 2005, with record net earnings of $1.92 per share, 12.9% sales growth, and 4.6% comparable store sales growth. It also discusses returning $600 million to shareholders through a share repurchase program, and expanding the store base to 809 total stores across the Bed Bath & Beyond, Christmas Tree Shops, and Harmon brands. The report aims to present shareholders with the required annual information in a straightforward and cost-efficient manner.
- ALLTEL CORPORATION reported consolidated financial results for the third quarter and first nine months of 2005.
- Revenues increased 20% for the third quarter and 13% for the first nine months compared to the same periods in 2004, driven primarily by growth in wireless revenues.
- Operating income increased 11% for the third quarter and 10% for the first nine months, with wireless and communications support services seeing the largest gains. However, wireline operating income declined.
- Net income increased 12% for the third quarter and 39% for the first nine months from the prior year periods.
Fundamental Analysis & Analyst Recommendations - SLI Index MembersBCV
This document provides an analysis of the Swiss Leader Index (SLI) including key financial metrics from 1992-2012. It includes income statement, balance sheet, and cash flow data with metrics like earnings per share, price to earnings ratios, book value per share, and cash flow per share. The analysis also provides market data on the SLI including index values, trading volumes, market capitalization over time.
Piaggio Group reported a 3.3% increase in net sales to €351.7 million for the first quarter of 2011 compared to the same period last year. EBITDA grew 6.1% to €33.7 million, representing a 9.6% margin. Net income increased 4.1% to €3 million, maintaining an 0.8% margin on sales. Volumes were up 3.7% overall to 149,000 units sold, with strong growth in the Commercial Vehicles India segment.
This document summarizes real estate market data for 14 different areas in the Houston, Texas region for the year-to-date periods of 2009 and 2010. It provides statistics such as average and median home prices, price per square foot, percentage of homes sold at or above list price, and inventory levels. For each area and statistic, it shows both the numerical difference and percentage difference between the 2009 and 2010 year-to-date values. The areas covered range from inner city neighborhoods to more suburban locations.
Strategic Valuation of Pizza Market leadersaxvacho
A comprehensive strategic valuation presentation of Domino's verse Papa John's Pizza companies. Methods include DCF, Relative valuation, regression analysis.
Fundamental Equity Analysis - World Gold MinersBCV
This document provides an analysis of the NYSE Arca Gold BUGS Index, including key financial metrics for the index and its constituent stocks over several years. It summarizes income statement, balance sheet, and market data trends to evaluate the performance and valuation of gold mining companies represented in the index. The analysis is intended to inform fundamental analysis and recommendations related to investing in the top 50 gold miners.
This document is the 1999 annual report for Tricon Global Restaurants, Inc. (Tricon), which owns KFC, Pizza Hut, and Taco Bell. Some key highlights from 1999 include 4% combined same-store sales growth in the US, over $1.5 billion in cash flow generated, and a 24% return on assets employed. Looking ahead, Tricon expects continued same-store sales growth, systemwide sales growth of 6%, and ongoing operating earnings per share growth of 23-27% in 2000.
Tech M&A Outlook - presented by Mgi research bloomberg l.p. march 2012 conf...MGI_Research
This document discusses tech M&A trends and outlook. It finds that large buyers like IBM, Oracle, and Google are looking to acquire companies to boost topline growth, especially in cloud computing, big data, and mobile. Potential sellers include smaller SaaS and cloud tech companies. The document also notes sectors and companies that may see deals, including healthcare IT and fallen tech giants trying to reinvent themselves. It concludes with contact information for the research firm.
This document provides financial data and analysis for Leggett & Platt from 1996-2006. It summarizes that Leggett & Platt saw record sales and earnings in 2006, with sales increasing primarily through acquisitions. Earnings also benefited from several unusual items. The company focuses on using cash flows to fund capital expenditures, acquisitions, and dividend payments, maintaining debt at targeted levels. Key factors that impact the company's business are market demand, raw material costs, energy costs, and competition across its five business segments which produce a wide range of components and finished products.
This document summarizes single-family residential real estate market data for 16 areas in the Houston, Texas region for March 2010. It provides year-to-date statistics for 2010 and 2009 including average and median home prices, price per square foot, percentage of homes sold at or above list price, sales of new and pending listings, and months of inventory. For each area, it calculates the difference and percentage difference between 2010 and 2009 for each statistic. The areas range from specific neighborhoods to broader geographic regions around Houston.
1) KB Home had a very successful fiscal year in 2002, with revenues exceeding $5 billion for the first time in the company's history. Net orders and unit deliveries were up while earnings per share increased 30% over the previous year.
2) KB Home has transformed its business model over the past decade to focus on building homes only after securing buyers. This has brought greater stability and predictability compared to speculative building of the past.
3) Steady growth in new US households is expected to continue driving demand for new homes for decades. Large home builders like KB Home are well positioned due to economies of scale, purchasing power, and financial strength.
This document is the 2003 Annual Report, Notice of Annual Meeting, and Proxy Statement for Bed Bath & Beyond Inc. It includes the following:
1) A letter to shareholders from the co-chairmen and CEO thanking shareholders and associates for the company's success in fiscal year 2003 and outlining plans for continued growth.
2) Selected financial data showing the company's strong growth over the past 12 years as a public company, including a 32.2% increase in net earnings in fiscal 2003.
3) Notice of the upcoming annual meeting and instructions for electronic voting and accessing annual reports online to save the company money on printing and mailing costs.
4) A management discussion and analysis section outlining
This document summarizes single-family residential real estate market data for 16 different areas in the Houston region for the year-to-date of 2009 and 2010. For each area, it provides statistics on sales, average and median home prices, price per square foot, percentage of homes sold at or above list price, cooperative sales, new listings, active listings, pending sales, and months of inventory. It compares the 2009 and 2010 year-to-date figures and calculates the percentage difference between the two years for each statistic. The areas range from specific neighborhoods to broader geographic regions around Houston.
1) Whirlpool Corporation saw declines in sales, units shipped, and operating profit in Q4 2008 compared to Q4 2007, with net sales down 19% and operating profit down nearly 97%.
2) For the full year 2008, Whirlpool's sales and earnings were also down compared to 2007, with units shipped down 5.1% and earnings from continuing operations down 35.3%.
3) Whirlpool's North America segment experienced the largest declines, with Q4 net sales down nearly 18% and operating profit down over 111% compared to the previous year.
- Condominium apartment sales in the GTA were down 8% year-over-year in Q2 2017 with 8,223 sales, while the average selling price increased 28.1% to $532,032.
- The condo market remained resilient compared to low-rise segments, with condos accounting for a greater share of transactions. Market conditions were tight, resulting in ongoing strong price growth.
- Surveys suggest condos will continue gaining popularity for home buyers, as many households, especially first-time buyers in Toronto, turn to more affordable ownership options like condos.
This document summarizes real estate market data for 14 different areas in the Houston, Texas region for the year-to-date 2009 and 2010. It provides statistics on home sales, prices, inventory levels, and other metrics. Across most areas, home sales prices were up slightly from 2009 to 2010, while inventory levels also increased slightly on average. The percentage differences in key metrics like sales, prices, and inventory between 2009 and 2010 are also shown to provide comparisons across the two years.
A summary of the real estate market conditions in the Greater Houston Metropolitan broken down by areas including Sugar Land, The Woodlands, Galveston, Clear Lake, Memorial, Kingwood etc.
Market areas correspond to the geographical boundaries found on the area map.
- Leggett & Platt is an American manufacturing company that saw net sales grow at an average annual rate of 8.4% between 1996 and 2006, reaching $5.5 billion in 2006.
- Gross profit margins increased over the decade from 18.1% to 21.2%, while operating margins grew from 8.1% to 9.1% and net earnings margins increased from 4.7% to 5.7%.
- Return on equity also improved over the period, rising from 10.1% in 2003 to 13.1% in 2006, while earnings per share grew at a compound annual rate of 7.2%.
Expeditors International of Washington, 3rd07qerfinance39
Expeditors International reported a 18% increase in operating income for Q3 2007 compared to Q3 2006. Total revenues increased 15% and operating income increased 18% for the first nine months of 2007 over the same period in 2006. The company was encouraged by these record quarterly results which it believes demonstrate the company's focus on providing quality customer service.
The document appears to be an annual report from 2008-2009 that includes various financial ratios and key parameters for a company from 2005 to 2009. It includes ratios related to costs, profitability, balance sheet items, and per share data. It also includes tables showing growth in total income, earnings per share, profit after tax, and debt-equity ratio from 2005 to 2009.
This document is Bed Bath & Beyond's 2006 annual report and proxy statement. It provides financial highlights from fiscal year 2006, which ended on March 3, 2007. Some key points include:
- Net earnings for FY2006 were $2.09 per diluted share, an increase of 8.9% from the previous year.
- Net sales increased 13.9% to approximately $6.6 billion.
- Comparable store sales increased 4.9% in FY2006.
- The company opened 74 new Bed Bath & Beyond stores and ended the year with 888 stores total.
This document is Bed Bath & Beyond's 2005 Annual Report, which includes their Notice of Annual Meeting and Proxy Statement. It discusses Bed Bath & Beyond's financial highlights for fiscal year 2005, including a 16.4% increase in net earnings per share compared to 2004. It encourages shareholders to vote electronically to save the company money. It also provides instructions for electronic delivery of annual reports and proxy statements to further reduce costs.
The document summarizes financial highlights from WEG's 4Q12 conference call. It shows that for full year 2012, WEG achieved net operating revenue of R$6.17 billion, a 19% increase over 2011. Gross operating profit grew 21% to R$1.88 billion while net income increased 12% to R$656 million. EBITDA grew 19% to R$1.05 billion. For 4Q12 specifically, net operating revenue increased 13% to R$1.66 billion while net income grew 17% to R$183 million and EBITDA increased 17% to R$301 million. The main impacts increasing EBITDA for 2012 were favorable foreign exchange rates on revenues and lower costs
1) This document is the 2007 Annual Report, Notice of Annual Meeting, and Proxy Statement for Bed Bath & Beyond.
2) In fiscal 2007, Bed Bath & Beyond saw net sales increase 6.5% to $7.049 billion and net earnings of $2.10 per diluted share, compared to $2.09 per share the previous year.
3) The company continued its expansion, opening 66 new Bed Bath & Beyond stores and its first international store in Canada. It also operated 41 Christmas Tree Shops stores and 9 buybuy BABY stores.
1) This document is the 2007 Annual Report, Notice of Annual Meeting, and Proxy Statement for Bed Bath & Beyond.
2) In fiscal 2007, Bed Bath & Beyond saw net sales increase 6.5% to $7.049 billion and net earnings of $2.10 per diluted share, compared to $2.09 per share the previous year.
3) The company continued its expansion, opening 66 new Bed Bath & Beyond stores and its first international store in Canada. It also invested in new distribution centers and systems to support continued growth.
- The document provides financial data for Maruti Suzuki from March 2008 to the estimated March 2020, including revenues, expenses, profits, assets, liabilities, and other financial metrics.
- It shows steady annual revenue growth for Maruti Suzuki over this period, from around Rs. 18 billion in 2008 to an estimated Rs. 1,242.99 billion in 2020, with expenses also increasing but remaining a high percentage of total revenues.
- Profits have also increased substantially over time, with the net profit estimated at Rs. 161.58 billion for fiscal year ending March 2020, up significantly from Rs. 1,218.70 billion in 2008.
This document provides projected income statements for Heartbeat LLC over the first four years of operations. In year one, the company projects no revenue and net losses each quarter as it builds up its business. By year two, revenue increases substantially each quarter as more contracts are signed, though net losses continue. In year three, the company projects positive net income each quarter as revenue growth outpaces expenses. By year four, revenue and net income are projected to continue growing steadily each quarter as the business scales up.
- ALLTEL CORPORATION reported consolidated financial results for the three and six months ended June 30, 2006 and 2005.
- For the three months ended, total revenues and sales increased 18% to $2.673 billion, while operating income increased 13% to $591.85 million. Earnings per share decreased from $1.27 to $1.10.
- For the six months ended, total revenues and sales increased 19% to $5.213 billion, while operating income increased 13% to $1.121 billion. Earnings per share decreased from $2.31 to $1.86.
- The wireless segment saw the largest revenue and income growth rates for both the three and six
- Revenues and sales increased for ALLTEL's wireless and communications support services segments but decreased slightly for its wireline segment in both the three-month and six-month periods.
- Total operating income increased 13% and segment income increased 20% for the three-month period compared to the previous year. For the six-month period, total operating income increased 13% and segment income increased 19%.
- Earnings per share on a basic and diluted basis decreased year-over-year for both periods under GAAP due to higher corporate expenses and integration costs.
ALLTEL Corporation changed its business segment reporting effective January 1, 2006 to exclude amortization expense related to intangible assets from acquisitions from its wireless segment income and include it in corporate expenses. This change reflected management's decision to evaluate the wireless segment's performance without this amortization expense. All prior periods were reclassified to conform to this new presentation.
In August 2005, ALLTEL completed its merger with Western Wireless and agreed to divest certain Western Wireless markets. The acquired international operations of Western Wireless and markets to be divested were classified as discontinued operations.
The supplemental financial data contains non-GAAP measures and GAAP measures. A reconciliation of non-GAAP to GAAP measures is
The Chairman notes that ABC Holdings performed well in 2010, reflecting the improved economic environment across its markets following the global financial crisis recovery. All of the Group's banking operations reported profits for the first time. Retail banking is now offered and expected to contribute positively to income going forward. Overall, economic growth in Sub-Saharan Africa was revised upwards to 5% in 2010 and is projected to accelerate to 5.5% in 2011, though risks remain from commodity prices and political instability. The performance reflects the Group's decision to curtail lending during the recession, which reduced credit impairments.
ALLTEL Corporation changed its business segment reporting effective January 1, 2006 to exclude amortization expense related to intangible assets from acquisitions from its wireless segment income. This amortization expense is now included in corporate expenses. Alltel's management uses this revised measurement consistently for internal reporting, resource allocation, and determining management compensation. All prior period segment information has been reclassified to conform to this new presentation. Additionally, as a condition of regulatory approval for its merger with Western Wireless, ALLTEL agreed to divest certain Western Wireless markets, which have been classified as discontinued operations. The document provides consolidated quarterly financial statements for ALLTEL for 2006, 2005 and 2004 under both the new non-GAAP reporting and traditional
The document provides financial projections for a captive insurance proposal from Stenfield for 3 years. In year 1, gross written premium is projected to be over £1.7 million with a small profit of £3,459. In year 2, gross written premium is projected to increase to over £3.2 million with a larger profit of £542,183. Year 3 projections show further increases in gross written premium and profitability. Acquisition costs including commissions, fees, and reserves are the major expenses projected each year.
Final earnings presentation_conf_call_slides_1_q2013United_Stationers
- United Stationers reported adjusted sales of $1.25 billion for Q1 2013, down 0.1% from Q1 2012. Adjusted earnings per share increased 24% to $0.56 compared to $0.45 in Q1 2012.
- Gross margin was 15.1% of sales, up from 14.2% in Q1 2012. Adjusted operating expenses were 11.9% of sales compared to 11.3% in Q1 2012. Adjusted operating income was 3.2% of sales.
- By product category, the largest sales declines were in technology and facilities products. Sales through office products dealers and contract stationers increased while direct sales declined.
- The company reported strong financial and operational results for 2Q11, with launches up 37% and contracted sales up 29% compared to 2Q10.
- Net revenue increased 12% year-over-year, while adjusted EBITDA declined 18% due to lower margins.
- Recent developments included the appointment of a new CEO and CFO, as well as a R$170 million securitization of receivables.
- Alphaville was highlighted as a major growth driver through new brand extensions and focus on large urban developments.
- Ashok Leyland's total operating revenues increased 45% year-over-year to Rs. 107,035 crore in FY21 from Rs. 73,817 crore in FY20. Total expenses also increased 44% to Rs. 103,824 crore in FY21 from Rs. 72,341 crore in FY20.
- EBITDA more than doubled to Rs. 4,253 crore in FY21 from Rs. 2,377 crore in FY20, with the EBITDA margin expanding to 4% from 3%.
- Net profit for the year increased 24% to Rs. 6,422 crore in FY21 from Rs. 5
Vivo reported its financial results for the fourth quarter of 2009. Total revenue increased 3.4% year-over-year to R$16.4 billion, driven by a 5.9% increase in net service revenue to R$15 billion. EBITDA grew 7.2% to R$5.2 billion and net income more than doubled to R$857.5 million. The number of total accesses increased 14.3% year-over-year to 51.7 million. Data usage also grew significantly, with mobile internet users up 58% and data and value-added services revenue increasing 41.5% compared to the previous year.
1. WALL ST. TRAINING
A B C D E F G H I J K L M N O P
1 Wal-Mart Stores, Inc.
2 11-Year Financial Summary
3
4 ($ in millions, except per share data)
5 Actual CAGR/
6 Fiscal 1995 1996 1997 1998 1999 2000 2001 2002 2003 2004 2005 Avg
7 Net Sales $ 89,051 $ 99,627 $ 112,005 $ 130,522 $ 156,249 $ 180,787 $ 204,011 $ 229,616 $ 256,329 $ 285,222 $ 312,427 13.4%
8 COGS 70,485 78,897 88,163 102,490 121,825 140,720 159,097 178,299 198,747 219,793 240,391 13.1%
9 Operating, SG&A Expenses 14,547 16,437 18,831 21,778 26,025 30,822 35,147 39,983 44,909 51,248 56,733 14.6%
10 Net Income 2,689 2,978 3,424 4,240 5,394 6,087 6,448 7,818 8,861 10,267 11,231 15.4%
11 Diluted EPS $ 0.58 $ 0.65 $ 0.76 $ 0.95 $ 1.21 $ 1.36 $ 1.44 $ 1.76 $ 2.03 $ 2.41 $ 2.68 16.5%
12 Dividends 0.10 0.11 0.14 0.16 0.20 0.24 0.28 0.30 0.36 0.52 0.60 19.6%
13
14 Net Sales Growth 13.7% 11.9% 12.4% 16.5% 19.7% 15.7% 12.8% 12.6% 11.6% 11.3% 9.5% 13.4%
15 EPS Growth 12.1% 16.9% 25.0% 27.4% 12.4% 5.9% 22.2% 15.3% 18.7% 11.2% 16.7%
16
17 COGS, % of Net Sales 79.2% 79.2% 78.7% 78.5% 78.0% 77.8% 78.0% 77.7% 77.5% 77.1% 76.9% 78.1%
18 Op, SG&A Expenses, % of Net Sales 16.3% 16.5% 16.8% 16.7% 16.7% 17.0% 17.2% 17.4% 17.5% 18.0% 18.2% 17.1%
19 Net Income, % of Net Sales 3.0% 3.0% 3.1% 3.2% 3.5% 3.4% 3.2% 3.4% 3.5% 3.6% 3.6% 3.3%
20 Dividend Growth 10.0% 27.3% 14.3% 25.0% 20.0% 16.7% 7.1% 20.0% 44.4% 15.4% 20.0%
21 Dividend Payout Rate 17.2% 16.9% 18.4% 16.8% 16.5% 17.6% 19.4% 17.0% 17.7% 21.6% 22.4% 18.3%
22
23 Current assets of continuing operations 16,779 17,385 18,589 20,064 23,478 25,344 26,615 29,543 34,421 38,854 43,824
24 Current liabilities of continuing operations 10,944 10,432 13,930 16,155 25,525 28,366 26,795 32,225 37,840 43,182 48,826
25 Working Capital 5,835 6,953 4,659 3,909 (2,047) (3,022) (180) (2,682) (3,419) (4,328) (5,002)
26 ∆ Working Capital 1,118 (2,294) (750) (5,956) (975) 2,842 (2,502) (737) (909) (674)
27
28 PPE, net 18,554 19,935 23,237 25,600 35,533 40,461 45,248 51,374 59,023 68,118 79,290
29 ∆ Net PPE 1,381 3,302 2,363 9,933 4,928 4,787 6,126 7,649 9,095 11,172
30
31 Discount Stores 1,995 1,960 1,921 1,869 1,801 1,736 1,647 1,568 1,478 1,353 1,209
32 Supercenters 239 344 441 564 721 888 1,066 1,258 1,471 1,713 1,980
33 SAM'S CLUBs 433 436 443 451 463 475 500 525 538 551 567
34 Neighborhoold Markets - - - 4 7 19 31 49 64 85 100
35 International Stores 276 314 589 703 991 1,054 1,154 1,272 1,355 1,587 2,285
36
37
38
39 Note: Fiscal year ends January 31 of the next year.
wmtmodeltemplate-12808433079289-phpapp01.xls<Historical> Hamilton Lin, CFA, www.wallst-training.com
2. WALL ST. TRAINING
A B C D E F G H I J K L M N O P
1 Wal-Mart Stores, Inc.
2 Income Statement
3
4 (All figures in millions, except per share data)
5 Actual Estimated Projected
6 Fiscal 2003 2004 2005 2006 2007 2008 2009 2010 Projection Notes
7
8 Revenue
9 Net Sales 229,616 $ 256,329 $ 285,222 $ 312,427 $ 341,602 $ 372,818 $ 406,141 $ 441,631 $ 479,338 % Growth
10 Other Income, net 1,961 2,352 2,910 3,227 3,550 3,905 4,295 4,725 5,197 % Growth
11 Total Revenue $ 258,681 $ 288,132 $ 315,654 $ 345,152 $ 376,723 $ 410,437 $ 446,355 $ 484,535 Sum
12 Cost of Sales (198,747) (219,793) (240,391) (262,156) (285,367) (310,061) (336,271) (364,024) % of Net Sales
13 Gross Profit $ 59,934 $ 68,339 $ 75,263 $ 82,996 $ 91,356 $ 100,376 $ 110,084 $ 120,511 Sum
14 Operating, SG&A Expenses (44,909) (51,248) (56,733) (62,725) (69,216) (76,231) (83,795) (91,932) % of Revenue
15 Operating Income $ 15,025 $ 17,091 $ 18,530 $ 20,271 $ 22,140 $ 24,145 $ 26,289 $ 28,579 Sum
16 Interest Expense (729) (934) (1,171) (1,493) (1,811) (1,943) (2,036) (2,096) Debt Sweep
17 Capital Lease Interest Expense (267) (253) (249) (250) (250) (250) (250) (250) Assumption
18 Interest Income 164 201 248 257 240 240 240 240 Debt Sweep
19 Pre-Tax Income $ 14,193 $ 16,105 $ 17,358 $ 18,785 $ 20,320 $ 22,191 $ 24,243 $ 26,473 Sum
20 Income Taxes (5,118) (5,589) (5,803) (6,575) (7,112) (7,767) (8,485) (9,266) Tax Rate
21 Minority Interest (193) (214) (249) (324) (373) (428) (493) (567) (652) % Growth
22 Net Income $ 8,861 $ 10,267 $ 11,231 $ 11,837 $ 12,779 $ 13,932 $ 15,191 $ 16,556 Sum
23
24 Diluted Shares Outstanding 4,373 4,266 4,188 4,188 4,188 4,188 4,188 4,188 Assumption
25
26 Diluted Earnings per Share $ 2.03 $ 2.41 $ 2.68 $ 2.83 $ 3.05 $ 3.33 $ 3.63 $ 3.95 Net Income / Diluted S/O
27
28 EBITDA $ 18,877 $ 21,355 $ 23,247 $ 25,429 $ 27,770 $ 30,278 $ 32,959 $ 35,820 Op. Inc + Depr + Amort
29 EBITDA Margin 7.3% 7.4% 7.4% EBITDA / Revenue
30
31 Income Statement Assumptions
32
33 Net Sales Growth (0.2)% 11.6% 11.3% 9.5% 9.3% 9.1% 8.9% 8.7% 8.5% Decrease 20 bps
34 Other Income, net Growth 19.9% 23.7% 10.9% 10.0% 10.0% 10.0% 10.0% 10.0% Assumption
35
36 COGS, % of Net Sales (0.2)% 77.5% 77.1% 76.9% 76.7% 76.5% 76.3% 76.1% 75.9% Decrease 20 bps
37 Op, SG&A, % of Revenue 0.2% 17.4% 17.8% 18.0% 18.2% 18.4% 18.6% 18.8% 19.0% Increase 20 bps
38
39 Minority Interest Growth 10.88% 16.36% 30.12% 15.0% 15.0% 15.0% 15.0% 15.0% Assumption
40
41 Effective Tax Rate 36.1% 34.7% 33.4% 35.0% 35.0% 35.0% 35.0% 35.0% Assume normalized tax rate
42
43 Depreciation & Amortization $ 3,852 $ 4,264 $ 4,717 $ 5,158 $ 5,630 $ 6,133 $ 6,670 $ 7,241 % of Revenue
44 D&A, % of Net Revenue 1.5% 1.5% 1.5% 1.5% 1.5% 1.5% 1.5% 1.5%
45
46 Note: Fiscal year ends January 31 of the next year.
wmtmodeltemplate-12808433079289-phpapp01.xls<IS> Hamilton Lin, CFA, www.wallst-training.com
3. WALL ST. TRAINING
A B C D E F G H I J K L M N O P Q
1 Wal-Mart Stores, Inc.
2 Balance Sheet
3
4 ($ in millions)
5 Actual Estimated Projected
6 Fiscal 2004 2005 2006 2007 2008 2009 2010 Notes
7 ASSETS
8 Current Assets
9 Cash & Equivalents $ 5,488 $ 6,414 $ 6,000 $ 6,000 $ 6,000 $ 6,000 $ 6,000 From CF statement
10 Receivables 1,715 2,662 2,911 3,177 3,461 3,764 4,086 365 Days A/R: Revenue * No. Days / 365
11 Inventories 29,762 32,191 34,962 37,901 41,011 44,293 47,750 365 Days Inv: COGS * No. Days / 365
12 Prepaid Expenses and Other 1,889 2,557 2,796 3,052 3,325 3,616 3,925 % of Revenue
13 Total Current Assets $ 38,854 $ 43,824 $ 46,669 $ 50,130 $ 53,797 $ 57,673 $ 61,761 Sum
14
15 Net PPE $ 65,400 $ 75,875 $ 88,217 $ 97,588 $ 107,454 $ 117,784 $ 128,543 Beg Bal - negative CapEx - Depr
16 Net Capital Leases 2,718 3,415 3,415 3,415 3,415 3,415 3,415 Constant; assume no net changes
17 Goodwill 10,803 12,188 12,188 12,188 12,188 12,188 12,188 Constant; assume no acquisitions
18 Other Assets and Deferred Charges 2,379 2,885 3,155 3,443 3,751 4,080 4,429 % of Revenue
19 TOTAL ASSETS $ 120,154 $ 138,187 $ 153,643 $ 166,763 $ 180,606 $ 195,140 $ 210,336 Sum
20
21 LIABILITIES
22 Current Liabilities
23 Commercial Paper $ 3,812 $ 3,754 $ 3,754 $ 3,754 $ 3,754 $ 3,754 $ 3,754 From Debt Sweep
24 Revolver - - 10,407 15,975 20,351 25,631 28,126 From Debt Sweep
25 Accounts Payable 21,987 25,373 27,921 30,668 33,623 36,792 40,186 365 Days A/P: Expenses * No. Days / 365
26 Accrued Liabilities 12,120 13,465 14,723 16,070 17,508 19,040 20,669 % of Revenue
27 Accrued Income Taxes 1,281 1,340 1,340 1,340 1,340 1,340 1,340 Constant
28 Current Portion of Long-Term Debt 3,759 4,595 3,320 2,858 4,639 2,877 3,000 From Debt Sweep
29 Current Portion of Capital Leases 223 299 299 299 299 299 299 Constant; assume no net changes
30 Total Current Liabilities $ 43,182 $ 48,826 $ 61,765 $ 70,964 $ 81,513 $ 89,734 $ 97,373 Sum
31
32 Long-Term Debt $ 20,087 $ 26,429 $ 23,109 $ 20,251 $ 15,612 $ 12,735 $ 9,735 From Debt Sweep
33 Capital Leases 3,171 3,742 3,742 3,742 3,742 3,742 3,742 Constant; assume no net changes
34 Deferred Income Taxes & Other 2,978 4,552 4,552 4,552 4,552 4,552 4,552 Constant
35 Minority Interest 1,340 1,467 1,467 1,467 1,467 1,467 1,467 Constant
36 TOTAL LIABILITIES $ 70,758 $ 85,016 $ 94,635 $ 100,976 $ 106,886 $ 112,230 $ 116,869 Sum
37
38 SHAREHOLDERS' EQUITY
39 Common Stock $ 423 $ 417 $ 417 $ 417 $ 417 $ 417 $ 417 Held constant
40 APIC(Additional Paid In Capital) 2,425 2,596 2,596 2,596 2,596 2,596 2,596 Beg Bal + Stock Issued
41 Retained Earnings 43,854 49,105 54,942 61,722 69,653 78,844 89,400 Beg Bal + Net Inc - Dividends - Repurchases
42 Accumulated Other Comp. Income 2,694 1,053 1,053 1,053 1,053 1,053 1,053 Constant
43 TOTAL SHAREHOLDERS' EQUITY $ 49,396 $ 53,171 $ 59,008 $ 65,788 $ 73,719 $ 82,910 $ 93,466 Sum
44
45 TOTAL LIABILITIES & SHAREHOLDERS' EQUITY $ 120,154 $ 138,187 $ 153,643 $ 166,763 $ 180,606 $ 195,140 $ 210,336 Sum
46
47 Check $ - $ - $ - $ - $ - $ - $ - Calculation
48
49 Total Revenue $ 288,132 $ 315,654 $ 345,152 $ 376,723 $ 410,437 $ 446,355 $ 484,535 From Income Statement
50 Cost of Sales 219,793 240,391 262,156 285,367 310,061 336,271 364,024 From Income Statement
51 Operating, SG&A Expenses 51,248 56,733 62,725 69,216 76,231 83,795 91,932 From Income Statement
52 Total Expenses 271,041 297,124 324,881 354,583 386,292 420,066 455,956 Sum of COGS and Op, SG&A
53
54 Days Receivable Outstanding 2.2 3.1 3.1 3.1 3.1 3.1 3.1 A/R * 365 / Revenue
55 Days Inventories Outstanding -0.2 49.4 48.9 48.7 48.5 48.3 48.1 47.9 Inventory * 365 / COGS, decrease by .2 days
56 Prepaid, % of Revenue 0.7% 0.8% 0.8% 0.8% 0.8% 0.8% 0.8% Prepaid / Revenue
57 Other Assets, % of Revenue 0.8% 0.9% 0.9% 0.9% 0.9% 0.9% 0.9% Other Assets / Revenue
58 Days Payable Outstanding 0.2 29.6 31.2 31.4 31.6 31.8 32.0 32.2 A/P * 365 / Total Expenses, increase by .2 days
59 Accrued Liabilities, % of Revenue 4.2% 4.3% 4.3% 4.3% 4.3% 4.3% 4.3% Accrued Liabilities / Revenue
60 Note: Fiscal year ends January 31 of the next year.
wmtmodeltemplate-12808433079289-phpapp01.xls <BS> Hamilton Lin, www.wallst-training.com
4. WALL ST. TRAINING
A B C D E F G H I J K L M N
1 Wal-Mart Stores, Inc.
2 Cash Flow Statement
3
4 ($ in millions)
5 Estimated Projected
6 Fiscal 2006 2007 2008 2009 2010 Calculation
7
8 Cash From Operating Activities:
9 Net Income $ 11,837 $ 12,779 $ 13,932 $ 15,191 $ 16,556 From Income Statement
10 Plus: Depreciation & Amortization 5,158 5,630 6,133 6,670 7,241 From Income Statement
11
12 Changes in Working Capital:
13 (Increase)/Decrease in Receivables (249) (266) (284) (303) (322) Prior Year less Current Year
14 (Increase)/Decrease in Inventories (2,771) (2,939) (3,110) (3,283) (3,456) Prior Year less Current Year
15 (Increase)/Decrease in Prepaid Expenses and Other (239) (256) (273) (291) (309) Prior Year less Current Year
16 (Increase)/Decrease in Other Assets and Deferred Charges (270) (289) (308) (328) (349) Prior Year less Current Year
17 Increase/(Decrease) in Accounts Payable 2,548 2,747 2,954 3,170 3,393 Current Year less Prior Year
18 Increase/(Decrease) in Accrued Liabilities 1,258 1,347 1,438 1,532 1,629 Current Year less Prior Year
19 Total Change in Working Capital $ 278 $ 344 $ 417 $ 497 $ 586 Sum
20 Total Cash From Operating Activities $ 17,274 $ 18,753 $ 20,482 $ 22,359 $ 24,382 Sum
21
22 Cash From Investing Activities:
23 (Increase) in Capital Expenditures $ (17,500) $ (15,000) $ (16,000) $ (17,000) $ (18,000) Assumption
24 Total Cash From Investing Activities $ (17,500) $ (15,000) $ (16,000) $ (17,000) $ (18,000) Sum
25
26 Cash From Financing Activities:
27 Issuance of Common Stock $ - $ - $ - $ - $ - Assumption
28 Common Stock Dividends (2,500) (2,500) (2,500) (2,500) (2,500) Assumption
29 Net (Purchase) / Reissuance of Treasury Stock (3,500) (3,500) (3,500) (3,500) (3,500) Assumption
30 Cash Available / (Required) Before Debt $ (6,226) $ (2,247) $ (1,518) $ (641) $ 382 Sum of CFO, CFI and CFF items
31
32 Debt Borrowing / (Repayment) 5,812 2,247 1,518 641 (382) From Debt schedule
33 Total Cash From Financing Activities $ (188) $ (3,753) $ (4,482) $ (5,359) $ (6,382) Sum of all CFF items, exclude row 30 !!
34
35 Beginning Cash Balance $ 6,414 $ 6,000 $ 6,000 $ 6,000 $ 6,000 From Balance Sheet
36 Change in Cash (414) - - - - Sum of CFO, CFI and CFF
37 Ending Cash Balance $ 6,000 $ 6,000 $ 6,000 $ 6,000 $ 6,000 Sum => This goes to BS
38 Average Cash Balance 6,207 6,000 6,000 6,000 6,000 Average of Beg and End Balance
39
40 Note: Fiscal year ends January 31 of the next year.
wmtmodeltemplate-12808433079289-phpapp01.xls <CF> Hamilton Lin, www.wallst-training.com
6. WALL ST. TRAINING
A B C D E F G H I J K L M
52 Wal-Mart Stores, Inc.
53 Interest Schedule
54
55 ($ in millions)
56 Estimated Projected
57 Fiscal Year Ending October 31, 2006 2007 2008 2009 2010
58
59 Interest Rates
60 Cash & Cash Equivalents 4.0% 4.0% 4.0% 4.0% 4.0%
61 Tranche 1 4.4% 4.4% 4.4% 4.4% 4.4%
62 Tranche 2 5.0% 5.0% 5.0% 5.0% 5.0%
63 Commercial Paper 3.4% 3.4% 3.4% 3.4% 3.4%
64 Revolver 5.0% 5.0% 5.0% 5.0% 5.0%
65
66
67 Interest Income 1 (1 = Beginning balance
68 Cash & Cash Equivalents 2 = Average Balance) $ 257 $ 240 $ 240 $ 240 $ 240
69
70 Interest Expense
71 Tranche 1 $ 1,365 $ 1,163 $ 1,017 $ 891 $ 687
72 Tranche 2 - - - - -
73 Commercial Paper 128 128 128 128 128
74 Revolver - 520 799 1,018 1,282
75 Total Interest Expense $ 1,493 $ 1,811 $ 1,943 $ 2,036 $ 2,096
76
77 Note: Fiscal year ends January 31 of the next year.
wmtmodeltemplate-12808433079289-phpapp01.xls<Debt Sweep> Hamilton Lin, www.wallst-training.com
7. WALL ST. TRAINING
N
1
2
3
4
5
6 Calculation
7
8 From CF statement
9 Balance Sheet
10 Assumption
11 Sum of mandatory pmts below
12 Sum
13
14
15 Equal to prior year's end balance
16 Given, Debt Footnote
17 Sum
18 Average of Beg and End Balance
19
20
21 Equal to prior year's end balance
22 Assumption
23 Sum
24 Average of Beg and End Balance
25
26
27 Equal to prior year's end balance
28 Balancing equation
29 Sum
30 Average of Beg and End Balance
31
32
33 Equal to prior year's end balance
34 Balancing equation
35 Sum
36 Average of Beg and End Balance
37
38 Sum of prior year's end balances
39 Sum of mandatory pmts, to CF
40 Reference revolver sweep, to CF
41 Sum
42
43
44
45
46
47 From CF statement
48 From CF statement
49 Calculation
50
51
wmtmodeltemplate-12808433079289-phpapp01.xls<Debt Sweep> Hamilton Lin, www.wallst-training.com
8. WALL ST. TRAINING
N
52
53
54
55
56
57 Calculation
58
59
60 Assumption
61 Wtg'ed avg estimate, 10K p 39
62 Assumption
63 Given, Debt Footnote
64 Assumption
65
66
67
68 If switch = 1, take interest rate *
69 beginning balance, else rate *
70 average balance
71
72
73
74
75
76
77
wmtmodeltemplate-12808433079289-phpapp01.xls<Debt Sweep> Hamilton Lin, www.wallst-training.com
9. WALL ST. TRAINING
A B C D E F G H I J K L M N O P
1 Wal-Mart Stores, Inc.
2 Discounted Cash Flow Analysis
3
4 ($ in millions, except per share data)
5 Estimated Projected
6 Fiscal 2006 2007 2008 2009 2010
7
8 EBITDA $ 25,429 $ 27,770 $ 30,278 $ 32,959 $ 35,820
9 EBIT 20,271 22,140 24,145 26,289 28,579
10 Less: Cash Taxes @ 35.0% 35.0% (7,095) (7,749) (8,451) (9,201) (10,003)
11 Tax-effected EBIT $ 13,176 $ 14,391 $ 15,694 $ 17,088 $ 18,577
12 Plus: Depreciation & Amortization 5,158 5,630 6,133 6,670 7,241
13 Less: Capital expenditures (17,500) (15,000) (16,000) (17,000) (18,000)
14 Plus / (Less): Change in net working capital 278 344 417 497 586
15 Unlevered free cash flow $ 1,112 $ 5,365 $ 6,244 $ 7,255 $ 8,403
16
17 WACC @ 10.0%
18 NPV of Unlevered free cash flow @ 10.0% $ 20,309
19
20 EBITDA MULTIPLE METHOD
21 Terminal Value Undiscounted Discounted
22 EBITDA Multiple 8.0x $ 286,561 $ 177,932
23 10.0x 358,201 222,414
24
25 DCF Range (Implied Enterprise Value) $ 198,241 – $ 242,724 Total Debt 36245
26 Cash -6414
27 Equity Value (a) $ 168,410 – $ 212,893 Net Debt 29831
28 Implied Price per Share (b) $ 40.21 – $ 50.83 S/Out 4188
29
30 –
31 PERPETUITY GROWTH METHOD
32 Terminal Value Undiscounted Discounted
33 Perpetuity Growth Rate 3.0% $ 273,341 $ 169,724
34 4.0% $ 321,994 $ 199,933
35
36 DCF Range (Implied Enterprise Value) $ 190,033 – $ 220,243
37
38 Equity Value (a) $ 160,202 – $ 190,412
39 Implied Price per Share (b) $ 38.25 – $ 45.47
40
41 Note: Fiscal year ends January 31 of the next year.
42 Note: Present Values as of January 31, 2005.
43 (a) Assumes $0,000M of net debt.
44 (b) Assumes 00,00.0MM shares outstanding.
wmtmodeltemplate-12808433079289-phpapp01.xls<DCF> Hamilton Lin, CFA, www.wallst-training.com
10. WALL ST. TRAINING
A B C D E G K L M N O P Q R S T U V W X Y
1 Analysis of Selected Publicly Traded Discount Retailers – Illustrative Training Template Only!
2 Financial Summary
3
4 (All figures in millions, except for per share data)
5 Stock
6 Price Equity Enterprise Revenue EBITDA EBIT EPS
7 Company Ticker 4/10/06 Value Value (a) 2005A 2006E 2007P 2005A 2006E 2007P 2005A 2006E 2007P 2005A 2006E
8
9 Costco COST $ 54.43 $ 26,087 $ 23,235 $ 55,431 $ 61,218 $ 67,658 $ 2,062 $ 2,319 $ 2,614 $ 1,566 $ 1,769 $ 2,001 $ 2.16 $ 2.37
10 JC Penney JCP 58.47 13,830 14,256 18,781 19,481 20,093 1,954 2,135 2,296 1,582 1,750 1,878 3.63 4.25
11 Kohl's KSS 53.95 18,805 19,515 13,402 15,096 17,120 1,755 2,026 2,373 1,416 1,633 1,909 2.43 2.86
12 Sears SHLD 138.31 21,993 21,023 54,261 53,700 53,748 2,969 3,502 4,106 2,148 2,096 2,363 6.03 7.72
13 Target TGT 51.62 45,347 53,470 52,620 59,050 65,539 5,732 6,466 7,241 4,323 4,916 5,464 2.71 3.12
14 TOTAL $ 126,062 $ 131,499
15
16
17
18
19
20
21 Wal-Mart WMT $ 45.70 $ 190,459 $ 220,290 $ 315,654 $ 352,541 $ 388,813 $ 23,299 $ 25,420 $ 29,002 $ 18,582 $ 20,650 $ 23,126 $ 2.63 $ 2.92
22
23 Source: Publicly available SEC filings, Bloomberg and IBES estimates.
24 Note: Figures have NOT been adjusted for extraordinary and non-recurring items and should be!
25 Note: All years ending approximately January 31 of the next year.
26 (a) Enterprise Value calculated as Equity Value plus Net Debt (Total Debt less Cash & Cash Equivalents).
27
28
29
wmtmodeltemplate-12808433079289-phpapp01.xlsRetail Comps Hamilton Lin, CFA, www.wallst-training.com
12. WALL ST. TRAINING
AA AB AC AD AE AF AG AH AI AJ AK AL AM AN AO AP AQ AR AS AT AU AV AW
1 Analysis of Selected Publicly Traded Discount Retailers – Illustrative Training Template Only!
2 Valuation Multiples
3
4
5 Revenue/ Enterprise Value as a Multiple of Stock Price as a Multiple of
6 2005 Margins Number Store Revenue EBITDA EBIT Earnings per Share
7 Company Ticker EBITDA EBIT Stores ($MM's) 2005A 2006E 2007P 2005A 2006E 2007P 2005A 2006E 2007P 2005A 2006E
8
9 Costco COST 3.7% 2.9% 471 $ 117.7 0.42x 0.38x 0.34x 11.3x 10.0x 8.9x 14.8x 13.1x 11.6x 25.2x 23.0x
10 JC Penney JCP 10.4% 9.0% 1,019 18.4 0.76 0.73 0.71 7.3 6.7 6.2 9.0 8.1 7.6 16.1 13.8
11 Kohl's KSS 13.1% 10.8% 732 18.3 1.46 1.29 1.14 11.1 9.6 8.2 13.8 12.0 10.2 22.2 18.9
12 Sears SHLD 5.5% 3.9% 3,843 14.1 0.39 0.39 0.39 7.1 6.0 5.1 9.8 10.0 8.9 22.9 17.9
13 Target TGT 10.9% 8.3% 1,397 37.7 1.02 0.91 0.82 9.3 8.3 7.4 12.4 10.9 9.8 19.0 16.5
14
15
16 HIGH 13.1% 10.8% $ 117.7 1.46x 1.29x 1.14x 11.3x 10.0x 8.9x 14.8x 13.1x 11.6x 25.2x 23.0x
17 AVERAGE 8.7% 7.0% 41.2 0.81 0.74 0.68 9.2 8.1 7.2 12.0 10.8 9.6 21.1 18.0
18 MEDIAN 10.4% 8.3% 18.4 0.76 0.73 0.71 9.3 8.3 7.4 12.4 10.9 9.8 22.2 17.9
19 LOW 3.7% 2.9% 14.1 0.39 0.38 0.34 7.1 6.0 5.1 9.0 8.1 7.6 16.1 13.8
20
21 Wal-Mart WMT 7.4% 5.9% 6,141 $ 51.4 0.70x 0.62x 0.57x 9.5x 8.7x 7.6x 11.9x 10.7x 9.5x 17.4x 15.7x
22
23 Source: Publicly available SEC filings, Bloomberg and IBES estimates.
24 Note: Figures have NOT been adjusted for extraordinary and non-recurring items and should be!
25 Note: All years ending approximately January 31 of the next year.
26 (a) Enterprise Value calculated as Equity Value plus Net Debt (Total Debt less Cash & Cash Equivalents).
27
28
29
wmtmodeltemplate-12808433079289-phpapp01.xlsRetail Comps Hamilton Lin, CFA, www.wallst-training.com
13. WALL ST. TRAINING
AX
1
2
3
4
Price as a Multiple of
5
rnings per Share
6
7 2007P
8
9 19.2x
10 12.2
11 15.7
12 14.9
13 14.5
14
15
16 19.2x
17 15.3
18 14.9
19 12.2
20
21 13.7x
22
23
24
25
26
27
28
29
wmtmodeltemplate-12808433079289-phpapp01.xlsRetail Comps Hamilton Lin, CFA, www.wallst-training.com
14. WALL ST. TRAINING
F7: Should be latest Basic
Shares Outstanding from front of latest 10K or 10Q or proxy (whichever is later) + effect of diluted shares due to treasury adjusted options
H7: From latest balance sheet, EXCLUDING capital leases and INCLUDING correct minority interest figure
I7: From latest balance sheet, don't forget to include short term investments and exclude restricted cash
L9: Want actuals for 12 months ending 1/31/06, so take:
7/12 of 8/05 actual +
5/12 of 8/06 estimate (should really be straight from 10Q filings, but for illustrative training purposes and simplicity in this exercise, take estimate)
M9: Want estimates for 12 months ending 1/31/07, so take:
7/12 of 8/06 estimate +
5/12 of 8/07 estimate
N9: Want estimates for 12 months ending 1/31/08, so take:
7/12 of 8/07 estimate +
5/12 of 8/08 estimate
P9: Want actuals for 12 months ending 1/31/06, so take:
7/12 of 8/05 actual +
5/12 of 8/06 estimate (should really be straight from 10Q filings, but for illustrative training purposes and simplicity in this exercise, take estimate)
Q9: Want estimates for 12 months ending 1/31/07, so take:
7/12 of 8/06 estimate +
5/12 of 8/07 estimate
R9: Want estimates for 12 months ending 1/31/08, so take:
7/12 of 8/07 estimate +
5/12 of 8/08 estimate
T9: Want actuals for 12 months ending 1/31/06, so take:
7/12 of 8/05 actual +
5/12 of 8/06 estimate (should really be straight from 10Q filings, but for illustrative training purposes and simplicity in this exercise, take estimate)
U9: Want estimates for 12 months ending 1/31/07, so take:
7/12 of 8/06 estimate +
5/12 of 8/07 estimate
V9: Want estimates for 12 months ending 1/31/08, so take:
7/12 of 8/07 estimate +
5/12 of 8/08 estimate
X9: Want actuals for 12 months ending 1/31/06, so take:
7/12 of 8/05 actual +
5/12 of 8/06 estimate (should really be straight from 10Q filings, but for illustrative training purposes and simplicity in this exercise, take estimate)
Y9: Want estimates for 12 months ending 1/31/07, so take:
7/12 of 8/06 estimate +
5/12 of 8/07 estimate
Z9: Want estimates for 12 months ending 1/31/08, so take:
7/12 of 8/07 estimate +
5/12 of 8/08 estimate
L12: Given since Pro Forma figure including full year of Kmart and Sears results
wmtmodeltemplate-12808433079289-phpapp01.xlsNotes Hamilton Lin, CFA, www.wallst-training.com
16. WALL ST. TRAINING
A B C D E F G H I J
1 Wal-Mart Stores, Inc.
2 Illustrative Reference Range
3
4
52-week Trading Range $42.4
5 $
6 Analysis of Selected Acquisitions
7 Discounted Cash Flow Analysis $40.00
$
8
9
10
11
12
13
14
15
16
17
18 METHODOLOGY
19
20
21
22
23
24
25
26
27
28
29
30
31
$30.00 $40.0
32
33 Illustrative WMT
34
35
36
37 min max
38 52-week Trading Range $42.49 8.08 $50.57
39 Analysis of Selected Publicly Traded Discount Retailers $45.00 10.00 $55.00
40 Analysis of Selected Acquisitions $50.00 10.00 $60.00
41 Analysis of Selected Premiums Paid $50.00 5.00 $55.00
42 Discounted Cash Flow Analysis $40.00 10.00 $50.00
43 Reference Range $45.00 $55.00
44
45 Current Stock Price $ 45.70 0
46 $ 45.70 1
wmtmodeltemplate-12808433079289-phpapp01.xlsFootball Hamilton Lin, CFA, www.wallst-training.com
17. Treasury Method Calculation
Number of Options 10.000
Exercise Price $ 45.00
Current Stock Price $ 100.00
Proceeds to Company $ 450.0
Proceeds to Holder $ 1,000.0
Difference $ 550.0
Share Dilution 5.500
Treasury Method 5.500 =max(0, # options * (1 - Exercise Price / Current Price))
The max function sets the equation to zero in the event that the exercise
price is greater than the current stock price, in which event, the option
is out-of-the-money and does not cause extra shares to be issued.
Try the math yourself.
Apply the formula for EACH tranche of options
Treasury Adjusted Diluted Shares Outstanding =
Basic Shares Outstanding + MAX ( 0, # options * (1 - Exercise Price / Current Price))
WALL ST. TRAINING ®
(212) 537-6631 Hamilton Lin, CFA
info@hlcp.net President
hamilton@hlcp.net
Wall St. Training is a registered servicemark of HL Capital Partners, Ltd. www.wallst-training.com