Download to read offline


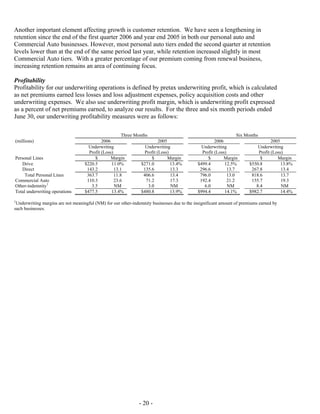


The Progressive Corporation reported financial results for the second quarter of 2006, with net premiums written growing 2% over the same period in 2005. While profits remained strong, with an underwriting margin of 14.1%, growth was lower than expected. Progressive saw the greatest growth challenges in their Drive brand within the independent agency channel. They are also seeing a shift to more customers researching and initiating quotes online rather than by phone. Commercial auto grew policies by 9% in the quarter. Progressive aims to balance further profitability and growth by enhancing their brands and marketing to attract more customers in all channels.


