SlideShare a Scribd company logo
1 of 6
WAL-MART STORES, INC.
www.walmartstores.com/news
FOR IMMEDIATE RELEASE Investor Relations Contacts
Media Relations Contact
Carol Schumacher 479-277-1498
Mike Beckstead 479-277-9558
John Simley 800-331-0085
Pre-recorded Conference Call
203-369-1090
Wal-Mart Reports Third Quarter Fiscal 2009 Earnings
BENTONVILLE, Ark., Nov. 13, 2008 -- Wal-Mart Stores, Inc. (NYSE: WMT) today reported its sales and
earnings for the quarter ended Oct. 31, 2008. Net sales for the third quarter of fiscal year 2009 were $97.6
billion, an increase of 7.5 percent from $90.8 billion in the third quarter last year.
Income from continuing operations for the third quarter was $3.033 billion, an increase of 6.6 percent from
$2.846 billion in the third quarter last year. Diluted earnings per share from continuing operations for the third
quarter of fiscal year 2009 increased to $0.77 from the previous year’s third quarter result of $0.70 per share.
The prior year included a net benefit of $0.01 per share due to the recognition of $46.5 million in after-tax gains
from the sale of certain real estate properties.
During the third quarter of fiscal year 2009, the Company recorded a $107 million after-tax charge related to
store closures and property divestitures at Seiyu in Japan and a $212 million after-tax gain on the disposal of
Gazeley Limited which was sold in July 2008. These operations have been accounted for as discontinued
operations for all periods presented.
“We are very pleased with our results this quarter,” said Lee Scott, Wal-Mart Stores, Inc. president and chief
executive officer. “Despite economic difficulties around the world, we achieved solid sales and earnings growth
and we are optimistic about the upcoming holidays. At a time when our customer is feeling the pressure of a
tough economy, Wal-Mart’s price leadership is more important than ever.
“Improved operating performance and capital efficiency contributed to stronger earnings and free cash flow,”
Scott added. “The credit for our performance goes to the more than 2 million associates serving more than 175
million customers in 14 countries every week.”
Net Sales
Net sales were as follows (dollars in billions):
Percent Percent
2008 2007 Change 2008 2007 Change
Net Sales:
Walmart U.S. 61.155$ 57.651$ 6.1% 184.281$ 172.101$ 7.1%
International 24.857 22.349 11.2% 73.949 63.472 16.5%
Sam's Club 11.622 10.826 7.4% 35.018 32.526 7.7%
Total Company 97.634$ 90.826$ 7.5% 293.248$ 268.099$ 9.4%
Three Months Ended
October 31, October 31,
Nine Months Ended
2
“Our sales results reflect the improved customer experience and sharper merchandising presentation at Walmart
U.S., as well as higher traffic at Sam’s Club among both Business and Advantage members,” Scott said.
“International remains Wal-Mart’s fastest-growing business, proving that our mission of saving people money so
they can live better resonates with customers everywhere we do business.”
Free cash flow increased to approximately $2.0 billion for the first nine months of fiscal year 2009, compared to
a deficit of $1.3 billion for the same period last year. Wal-Mart defines free cash flow, a non-GAAP measure, as
cash provided by operating activities, less capital expenditures. A reconciliation of free cash flow for the first
nine months of this fiscal year to the most directly comparable GAAP measure for the same period is available
on Form 8-K furnished today with the Securities and Exchange Commission and at
www.walmartstores.com/investors.
Segment Operating Income
Segment operating income for each operating segment, which is defined as income from continuing operations
before net interest expense, income taxes, unallocated corporate overhead and minority interest, was as follows
(dollars in billions):
2008 2007
Percent
Change 2008 2007
Percent
Change
Segment Operating Income:
Walmart U.S. 4.286$ 3.995$ 7.3% 13.363$ 12.230$ 9.3%
International 1.182 1.069 10.6% 3.450 2.986 15.5%
Sam's Club 0.365 0.359 1.7% 1.183 1.174 0.8%
Three Months Ended
October 31,
Nine Months Ended
October 31,
Comparable Store Sales
The Company reports comparable store sales in this earnings release based on the calendar months in the
quarters that ended Oct. 31, 2008 and 2007. Comparable store sales for the United States were as follows:
2008 2007 2008 2007 2008 2007
Walmart U.S. 2.7% 1.0% 2.7% 1.0% 0.0% 0.0%
Sam's Club 4.5% 3.9% 6.7% 3.8% 2.2% -0.1%
Total U.S. 3.0% 1.5% 3.3% 1.5% 0.3% 0.0%
Without Fuel
Three Months Ended
October 31,
With Fuel
October 31,
Three Months Ended
October 31,
Fuel Impact
Three Months Ended
2008 2007 2008 2007 2008 2007
Walmart U.S. 3.4% 0.7% 3.4% 0.7% 0.0% 0.0%
Sam's Club 4.0% 4.8% 6.8% 4.8% 2.8% 0.0%
Total U.S. 3.5% 1.4% 3.9% 1.4% 0.4% 0.0%
October 31,
Nine Months Ended
October 31,
Fuel Impact
Nine Months Ended
Without Fuel
Nine Months Ended
October 31,
With Fuel
3
Guidance
For the fourth quarter of fiscal year 2009, the Company estimates the comparable store sales increase in the
United States to be between one and three percent, according to Tom Schoewe, Wal-Mart Stores, Inc. executive
vice president and chief financial officer.
“We estimate diluted earnings per share from continuing operations for the fourth quarter will be between $1.03
and $1.07,” Schoewe said. “The rapid changes in currency exchange rates during the last few weeks are
projected to negatively affect this year’s fourth-quarter results by approximately six cents per share. In U.S.
dollar terms, strong operating performance in International may be overshadowed by these currency fluctuations.
“For the full year, ending January 31, we have tightened and modestly reduced our guidance and now forecast
diluted earnings per share from continuing operations to be within a range of $3.42 to $3.46,” he said.
After this earnings release has been furnished to the SEC, a pre-recorded call offering additional comments on
the quarter will be available to all investors. Callers may listen to this call by dialing 203-369-1090. The
information included in this release and the pre-recorded phone call are available in the investor information area
on the Company’s Web site at www.walmartstores.com/investors.
Wal-Mart Stores, Inc. operates Walmart discount stores, supercenters, Neighborhood Markets and Sam’s Club
locations in the United States. The Company operates in Argentina, Brazil, Canada, China, Costa Rica, El
Salvador, Guatemala, Honduras, Japan, Mexico, Nicaragua, Puerto Rico and the United Kingdom and, through a
joint venture, in India. The Company's common stock is listed on the New York Stock Exchange under the
symbol WMT. More information about Wal-Mart can be found by visiting www.walmartstores.com. Online
merchandise sales are available at www.walmart.com and www.samsclub.com.
# # #
This release contains statements as to our management’s expectations regarding the comparable store sales
increase in the United States in the fourth quarter of fiscal year 2009, the Company’s expectations for its diluted
earnings per share from continuing operations for the fourth quarter of fiscal year 2009 and for all of fiscal year
2009, and our management’s expectation that currency exchange rates and related issues will be detrimental to
comparisons between results for the fourth quarter of fiscal year 2009 and those for the fourth quarter of fiscal
year 2008 that Wal-Mart believes are “forward-looking statements” within the meaning of the Private Securities
Litigation Reform Act of 1995, as amended. These statements are intended to enjoy the protection of the safe
harbor for forward-looking statements provided by that Act. These statements can be identified by the use of the
word “anticipate,” “estimate,” “may be,” forecast” or “projected” in the statements. These forward-looking
statements are subject to risks, uncertainties and other factors, domestically and internationally, including
general economic conditions, the cost of goods, competitive pressures, geopolitical events and conditions,
consumer credit availability, inflation, consumer spending patterns and debt levels, currency exchange
fluctuations, trade restrictions, changes in tariff and freight rates, changes in the costs of gasoline, diesel fuel,
other energy, transportation, utilities, labor and health care, accident costs, casualty and other insurance costs,
interest rate fluctuations, financial and capital market conditions, weather conditions, damage to the Company’s
facilities from natural disasters, regulatory matters and other risks. The Company discusses certain of these
factors more fully in its additional filings with the SEC, including its last annual report on Form 10-K filed with
the SEC, and this release should be read in conjunction with that annual report on Form 10-K, together with all
of the Company’s other filings, including current reports on Form 8-K, made with the SEC through the date of
this release. The Company urges you to consider all of these risks, uncertainties and other factors carefully in
evaluating the forward-looking statements contained in this release. As a result of these matters, changes in
facts, assumptions not being realized or other circumstances, the Company’s actual results may differ materially
from the expected results discussed in the forward-looking statements contained in this release. The forward-
looking statements made in this release are made only as of the date of this release, and the Company undertakes
no obligation to update them to reflect subsequent events or circumstances.
4
SUBJECT TO RECLASSIFICATION
2008 2007 2008 2007
Revenues:
Net sales 97,634$ 90,826$ 293,248$ 268,099$
Membership and other income 1,008 1,039 3,243 3,034
98,642 91,865 296,491 271,133
Costs and expenses:
Cost of sales 74,114 69,251 223,557 205,073
Operating, selling, general and administrative expenses 19,236 17,653 56,513 50,984
Operating income 5,292 4,961 16,421 15,076
Interest:
Debt 464 474 1,402 1,326
Capital leases 73 63 222 174
Interest income (81) (77) (216) (246)
Interest, net 456 460 1,408 1,254
Income from continuing operations before income taxes and minority interest 4,836 4,501 15,013 13,822
Provision for income taxes 1,690 1,556 5,186 4,764
Income from continuing operations before minority interest 3,146 2,945 9,827 9,058
Minority interest (113) (99) (365) (305)
Income from continuing operations 3,033 2,846 9,462 8,753
Income (loss) from discontinued operations, net of tax 105 11 146 (118)
Net income 3,138$ 2,857$ 9,608$ 8,635$
Net income per common share:
Basic income per common share from continuing operations 0.77$ 0.70$ 2.40$ 2.14$
Basic income (loss) per common share from discontinued operations 0.03 0.01 0.04 (0.03)
Basic net income per common share 0.80$ 0.71$ 2.44$ 2.11$
Diluted income per common share from continuing operations 0.77$ 0.70$ 2.39$ 2.14$
Diluted income (loss) per common share from discontinued operations 0.03 - 0.04 (0.03)
Diluted net income per common share 0.80$ 0.70$ 2.43$ 2.11$
Weighted-average number of common shares:
Basic 3,931 4,051 3,944 4,092
Diluted 3,944 4,056 3,956 4,097
Dividends declared per common share -$ -$ 0.95$ 0.88$
Wal-Mart Stores, Inc.
Condensed Consolidated Statements of Income
(Unaudited)
(Amounts in millions except per share data)
Three Months Ended Nine Months Ended
October 31, October 31,
5
SUBJECT TO RECLASSIFICATION October 31, October 31, January 31,
2008 2007 2008
ASSETS
Current assets:
Cash and cash equivalents 5,920$ 5,518$ 5,492$
Receivables 3,250 3,062 3,642
Inventories 40,416 39,535 35,159
Prepaid expenses and other 3,245 2,880 2,760
Current assets of discontinued operations 25 511 532
Total current assets 52,856 51,506 47,585
Property and equipment, at cost:
Property and equipment, at cost 125,173 120,396 122,256
Less accumulated depreciation (31,467) (27,537) (28,531)
Property and equipment, net 93,706 92,859 93,725
Property under capital lease:
Property under capital lease 5,420 5,690 5,736
Less accumulated amortization (2,581) (2,563) (2,594)
Property under capital leases, net 2,839 3,127 3,142
Goodwill 15,416 14,898 16,071
Other assets and deferred charges 2,789 3,031 2,748
Non-current assets of discontinued operations 237 238 243
Total assets 167,843$ 165,659$ 163,514$
LIABILITIES AND SHAREHOLDERS’ EQUITY
Current liabilities:
Commercial paper 7,932$ 9,126$ 5,040$
Accounts payable 30,782 31,376 30,344
Dividends payable 993 896 -
Accrued liabilities 15,343 14,773 15,725
Accrued income taxes 355 - 1,000
Long-term debt due within one year 4,753 4,412 5,913
Obligations under capital leases due within one year 314 309 316
Current liabilities of discontinued operations 128 50 116
Total current liabilities 60,600 60,942 58,454
Long-term debt 30,803 30,070 29,799
Long-term obligations under capital leases 3,268 3,520 3,603
Deferred income taxes and other 5,575 5,590 5,087
Minority interest 2,034 2,432 1,939
Non-current liabilities of discontinued operations 24 23 24
Commitments and contingencies
Shareholders' equity:
Common stock and capital in excess of par value 4,219 3,421 3,425
Retained earnings 59,809 55,522 57,319
Accumulated other comprehensive income 1,511 4,139 3,864
Total shareholders’ equity 65,539 63,082 64,608
Total liabilities and shareholders’ equity 167,843$ 165,659$ 163,514$
Wal-Mart Stores, Inc.
Condensed Consolidated Balance Sheets
(Unaudited)
(Amounts in millions)
6
SUBJECT TO RECLASSIFICATION
2008 2007
Cash flows from operating activities:
Net income 9,608$ 8,635$
(Income) loss from discontinued operations, net of tax (146) 118
Income from continuing operations 9,462 8,753
Adjustments to reconcile income from continuing operations to net cash provided by
operating activities:
Depreciation and amortization 5,054 4,656
Other 749 321
Changes in certain assets and liabilities, net of effects of acquisitions:
Decrease in accounts receivable 394 31
Increase in inventories (5,655) (5,037)
Increase in accounts payable 914 1,450
Decrease in accrued liabilities (745) (551)
Net cash provided by operating activities 10,173 9,623
Cash flows from investing activities:
Payments for property and equipment (8,174) (10,896)
Proceeds from disposal of property and equipment 779 478
Proceeds from (payments for) disposal of certain international operations, net 838 (257)
Investment in international operations, net of cash acquired (74) (461)
Other investing activities (166) (87)
Net cash used in investing activities (6,797) (11,223)
Cash flows from financing activities:
Increase in commercial paper 2,949 6,481
Proceeds from issuance of long-term debt 5,568 7,967
Payment of long-term debt (5,064) (6,671)
Dividends paid (2,814) (2,707)
Purchase of company stock (3,521) (5,279)
Other financing activities 88 (669)
Net cash used in financing activities (2,794) (878)
Effect of exchange rates on cash (231) 258
Net increase (decrease) in cash and cash equivalents 351 (2,220)
Cash and cash equivalents at beginning of year (1)
5,569 7,767
Cash and cash equivalents at end of period (2)
5,920$ 5,547$
and $51 million at January 31, 2007 respectively.
(2) Includes cash and cash equivalents of discontinued operations of $29 million at October 31, 2007.
(1) Includes cash and cash equivalents of discontinued operations of $77 million at January 31, 2008,
Nine Months Ended
October 31,
Wal-Mart Stores, Inc.
Condensed Consolidated Statements of Cash Flows
(Unaudited)
(Amounts in millions)

More Related Content

What's hot

Q3 2016 earnings presentation
Q3 2016 earnings presentationQ3 2016 earnings presentation
Q3 2016 earnings presentationMasco_Investors
 
YUM 08 Guidance
YUM 08 GuidanceYUM 08 Guidance
YUM 08 Guidancefinance26
 
Walmart Q4 FY20 Earnings
Walmart Q4 FY20 EarningsWalmart Q4 FY20 Earnings
Walmart Q4 FY20 EarningsWalmart
 
Intermolecular Second Quarter 2018 Conference Call
Intermolecular Second Quarter 2018 Conference CallIntermolecular Second Quarter 2018 Conference Call
Intermolecular Second Quarter 2018 Conference CallBill Roeschlein
 
Walmart Q1 FY21 Earnings
Walmart Q1 FY21 EarningsWalmart Q1 FY21 Earnings
Walmart Q1 FY21 EarningsWalmart
 
Greenlight capital 3 t 2012
Greenlight capital 3 t 2012Greenlight capital 3 t 2012
Greenlight capital 3 t 2012Frank Ragol
 
Mye q2 2016 earnings conference call presentation final
Mye q2 2016 earnings conference call presentation finalMye q2 2016 earnings conference call presentation final
Mye q2 2016 earnings conference call presentation finalMyers_Investors
 
Stock Pitch For Mailing Shipping Services PowerPoint Presentation PPT Slide T...
Stock Pitch For Mailing Shipping Services PowerPoint Presentation PPT Slide T...Stock Pitch For Mailing Shipping Services PowerPoint Presentation PPT Slide T...
Stock Pitch For Mailing Shipping Services PowerPoint Presentation PPT Slide T...SlideTeam
 
Visa inc. Q3 2016 Financial Results
Visa inc. Q3 2016 Financial ResultsVisa inc. Q3 2016 Financial Results
Visa inc. Q3 2016 Financial Resultsvisainc
 
Visa Shareholder presentation 2014
Visa Shareholder presentation 2014Visa Shareholder presentation 2014
Visa Shareholder presentation 2014visainc
 
Earnings deck q4 fy15
Earnings deck q4 fy15Earnings deck q4 fy15
Earnings deck q4 fy15visainc
 
Q1 2009 Earning Report of Smith International, Inc.
Q1 2009 Earning Report of Smith International, Inc.Q1 2009 Earning Report of Smith International, Inc.
Q1 2009 Earning Report of Smith International, Inc.earningreport earningreport
 
2018 tnc investor_presentation_final_march-2018
2018 tnc investor_presentation_final_march-20182018 tnc investor_presentation_final_march-2018
2018 tnc investor_presentation_final_march-2018TennantCorporation
 
2018 tnc investor_presentation_final_march2018
2018 tnc investor_presentation_final_march20182018 tnc investor_presentation_final_march2018
2018 tnc investor_presentation_final_march2018TennantCorporation
 
Before the Open July 19 2017
Before the Open July 19 2017Before the Open July 19 2017
Before the Open July 19 2017John Pendrith
 
The Blue Sky Report® - A Kerrigan Quarterly – First Quarter 2020 Preview
The Blue Sky Report® - A Kerrigan Quarterly – First Quarter 2020 PreviewThe Blue Sky Report® - A Kerrigan Quarterly – First Quarter 2020 Preview
The Blue Sky Report® - A Kerrigan Quarterly – First Quarter 2020 PreviewErin Kerrigan
 

What's hot (19)

Q3 2016 earnings presentation
Q3 2016 earnings presentationQ3 2016 earnings presentation
Q3 2016 earnings presentation
 
YUM 08 Guidance
YUM 08 GuidanceYUM 08 Guidance
YUM 08 Guidance
 
Walmart Q4 FY20 Earnings
Walmart Q4 FY20 EarningsWalmart Q4 FY20 Earnings
Walmart Q4 FY20 Earnings
 
Intermolecular Second Quarter 2018 Conference Call
Intermolecular Second Quarter 2018 Conference CallIntermolecular Second Quarter 2018 Conference Call
Intermolecular Second Quarter 2018 Conference Call
 
Walmart Q1 FY21 Earnings
Walmart Q1 FY21 EarningsWalmart Q1 FY21 Earnings
Walmart Q1 FY21 Earnings
 
Greenlight capital 3 t 2012
Greenlight capital 3 t 2012Greenlight capital 3 t 2012
Greenlight capital 3 t 2012
 
Slides q4 2015_final
Slides q4 2015_finalSlides q4 2015_final
Slides q4 2015_final
 
Mye q2 2016 earnings conference call presentation final
Mye q2 2016 earnings conference call presentation finalMye q2 2016 earnings conference call presentation final
Mye q2 2016 earnings conference call presentation final
 
Stock Pitch For Mailing Shipping Services PowerPoint Presentation PPT Slide T...
Stock Pitch For Mailing Shipping Services PowerPoint Presentation PPT Slide T...Stock Pitch For Mailing Shipping Services PowerPoint Presentation PPT Slide T...
Stock Pitch For Mailing Shipping Services PowerPoint Presentation PPT Slide T...
 
Visa inc. Q3 2016 Financial Results
Visa inc. Q3 2016 Financial ResultsVisa inc. Q3 2016 Financial Results
Visa inc. Q3 2016 Financial Results
 
Visa Shareholder presentation 2014
Visa Shareholder presentation 2014Visa Shareholder presentation 2014
Visa Shareholder presentation 2014
 
Earnings deck q4 fy15
Earnings deck q4 fy15Earnings deck q4 fy15
Earnings deck q4 fy15
 
Q1 2009 Earning Report of Smith International, Inc.
Q1 2009 Earning Report of Smith International, Inc.Q1 2009 Earning Report of Smith International, Inc.
Q1 2009 Earning Report of Smith International, Inc.
 
2018 tnc investor_presentation_final_march-2018
2018 tnc investor_presentation_final_march-20182018 tnc investor_presentation_final_march-2018
2018 tnc investor_presentation_final_march-2018
 
2018 tnc investor_presentation_final_march2018
2018 tnc investor_presentation_final_march20182018 tnc investor_presentation_final_march2018
2018 tnc investor_presentation_final_march2018
 
Before the Open July 19 2017
Before the Open July 19 2017Before the Open July 19 2017
Before the Open July 19 2017
 
Q1 bb presentation_2016
Q1 bb presentation_2016Q1 bb presentation_2016
Q1 bb presentation_2016
 
The Blue Sky Report® - A Kerrigan Quarterly – First Quarter 2020 Preview
The Blue Sky Report® - A Kerrigan Quarterly – First Quarter 2020 PreviewThe Blue Sky Report® - A Kerrigan Quarterly – First Quarter 2020 Preview
The Blue Sky Report® - A Kerrigan Quarterly – First Quarter 2020 Preview
 
Q1 2009 Earning Report of Continental Ag
Q1 2009 Earning Report of Continental AgQ1 2009 Earning Report of Continental Ag
Q1 2009 Earning Report of Continental Ag
 

Viewers also liked

компьютерный колледж
компьютерный колледжкомпьютерный колледж
компьютерный колледж11aklass
 
Taipei Walker 高雄墾丁
Taipei Walker 高雄墾丁Taipei Walker 高雄墾丁
Taipei Walker 高雄墾丁Jansen Lu
 
HSBC 2006 Interim Results Presentation to Investors and Analysts
HSBC 	2006 Interim Results Presentation to Investors and AnalystsHSBC 	2006 Interim Results Presentation to Investors and Analysts
HSBC 2006 Interim Results Presentation to Investors and AnalystsQuarterlyEarningsReports2
 
компьютерный
компьютерныйкомпьютерный
компьютерныйBethoven
 
Presentation1
Presentation1Presentation1
Presentation1daniem
 
компьютерный колледж
компьютерный колледжкомпьютерный колледж
компьютерный колледж11aklass
 
Sample Presentations Megan Dumont
Sample Presentations Megan Dumont Sample Presentations Megan Dumont
Sample Presentations Megan Dumont megandumont
 
2006 Annual Results Presentation to Investors and Analysts
	2006 Annual Results Presentation to Investors and Analysts	2006 Annual Results Presentation to Investors and Analysts
2006 Annual Results Presentation to Investors and AnalystsQuarterlyEarningsReports2
 
Metafora AD Network: sintesi di fine 2008
Metafora AD Network: sintesi di fine 2008Metafora AD Network: sintesi di fine 2008
Metafora AD Network: sintesi di fine 2008metaforaadnetwork
 
HSBC 2007 Annual Results Presentation to Investors and Analysts
HSBC 	2007 Annual Results Presentation to Investors and AnalystsHSBC 	2007 Annual Results Presentation to Investors and Analysts
HSBC 2007 Annual Results Presentation to Investors and AnalystsQuarterlyEarningsReports2
 

Viewers also liked (20)

HSBC M&A: curse or cure
HSBC M&A: curse or cure HSBC M&A: curse or cure
HSBC M&A: curse or cure
 
Bisutería
BisuteríaBisutería
Bisutería
 
компьютерный колледж
компьютерный колледжкомпьютерный колледж
компьютерный колледж
 
HSBC in the UK / Annual Results
	HSBC in the UK / Annual Results 	HSBC in the UK / Annual Results
HSBC in the UK / Annual Results
 
Taipei Walker 高雄墾丁
Taipei Walker 高雄墾丁Taipei Walker 高雄墾丁
Taipei Walker 高雄墾丁
 
HSBC 2006 Interim Results Presentation to Investors and Analysts
HSBC 	2006 Interim Results Presentation to Investors and AnalystsHSBC 	2006 Interim Results Presentation to Investors and Analysts
HSBC 2006 Interim Results Presentation to Investors and Analysts
 
HSBC Rebalancing towards developing markets
HSBC Rebalancing towards developing marketsHSBC Rebalancing towards developing markets
HSBC Rebalancing towards developing markets
 
компьютерный
компьютерныйкомпьютерный
компьютерный
 
Imd 203 - Ch07
Imd 203 - Ch07Imd 203 - Ch07
Imd 203 - Ch07
 
HSBC Holdings plc Pre-close Trading Update
 	HSBC Holdings plc Pre-close Trading Update 	HSBC Holdings plc Pre-close Trading Update
HSBC Holdings plc Pre-close Trading Update
 
Presentation1
Presentation1Presentation1
Presentation1
 
компьютерный колледж
компьютерный колледжкомпьютерный колледж
компьютерный колледж
 
Try1
Try1Try1
Try1
 
IMD 203 - Ch01
IMD 203 - Ch01IMD 203 - Ch01
IMD 203 - Ch01
 
Sample Presentations Megan Dumont
Sample Presentations Megan Dumont Sample Presentations Megan Dumont
Sample Presentations Megan Dumont
 
An introduction to HSBC Insurance
An introduction to HSBC InsuranceAn introduction to HSBC Insurance
An introduction to HSBC Insurance
 
2006 Annual Results Presentation to Investors and Analysts
	2006 Annual Results Presentation to Investors and Analysts	2006 Annual Results Presentation to Investors and Analysts
2006 Annual Results Presentation to Investors and Analysts
 
Metafora AD Network: sintesi di fine 2008
Metafora AD Network: sintesi di fine 2008Metafora AD Network: sintesi di fine 2008
Metafora AD Network: sintesi di fine 2008
 
HSBC 2007 Annual Results Presentation to Investors and Analysts
HSBC 	2007 Annual Results Presentation to Investors and AnalystsHSBC 	2007 Annual Results Presentation to Investors and Analysts
HSBC 2007 Annual Results Presentation to Investors and Analysts
 
Imd 203 Questions
Imd 203 QuestionsImd 203 Questions
Imd 203 Questions
 

Similar to Walmart Quarterly Earnings Q3 2009(2)

wal mart store Quarterly Earnings Releases2008
wal mart store Quarterly Earnings Releases2008wal mart store Quarterly Earnings Releases2008
wal mart store Quarterly Earnings Releases2008finance1
 
williams 1Q 2008
williams 1Q 2008williams 1Q 2008
williams 1Q 2008finance21
 
sherwin-williams 1Q2008
sherwin-williams 1Q2008sherwin-williams 1Q2008
sherwin-williams 1Q2008finance29
 
The Home Depot Announces First Quarter Results
The Home Depot Announces First Quarter ResultsThe Home Depot Announces First Quarter Results
The Home Depot Announces First Quarter Resultsfinance2
 
Wal Mart Store Financial ResultsFebruary 03/07/08
Wal Mart Store Financial ResultsFebruary 	03/07/08Wal Mart Store Financial ResultsFebruary 	03/07/08
Wal Mart Store Financial ResultsFebruary 03/07/08finance1
 
wal mart store Quarterly Earnings Releases2008
wal mart store Quarterly Earnings Releases2008wal mart store Quarterly Earnings Releases2008
wal mart store Quarterly Earnings Releases2008finance1
 
caterpillar Cat Inc. Q1 2008
caterpillar Cat Inc. Q1 2008caterpillar Cat Inc. Q1 2008
caterpillar Cat Inc. Q1 2008finance5
 
caterpillar Quarterly Releases2008 1st
caterpillar Quarterly Releases2008 1stcaterpillar Quarterly Releases2008 1st
caterpillar Quarterly Releases2008 1stfinance5
 
2008 - First Quarter Results 2008 In U.S. Gaap
2008 - First Quarter Results 2008 In U.S. Gaap2008 - First Quarter Results 2008 In U.S. Gaap
2008 - First Quarter Results 2008 In U.S. GaapEmbraer RI
 
RealogyQ308CALLTRANSCRIPT_11_07_08FINAL
RealogyQ308CALLTRANSCRIPT_11_07_08FINALRealogyQ308CALLTRANSCRIPT_11_07_08FINAL
RealogyQ308CALLTRANSCRIPT_11_07_08FINALfinance35
 
RealogyQ308CALLTRANSCRIPT_11_07_08FINAL
RealogyQ308CALLTRANSCRIPT_11_07_08FINALRealogyQ308CALLTRANSCRIPT_11_07_08FINAL
RealogyQ308CALLTRANSCRIPT_11_07_08FINALfinance35
 
RealogyQ22008ConferenceCallTranscript_081408
RealogyQ22008ConferenceCallTranscript_081408RealogyQ22008ConferenceCallTranscript_081408
RealogyQ22008ConferenceCallTranscript_081408finance35
 
RealogyQ22008ConferenceCallTranscript_081408
RealogyQ22008ConferenceCallTranscript_081408RealogyQ22008ConferenceCallTranscript_081408
RealogyQ22008ConferenceCallTranscript_081408finance35
 
caterpillar Quarterly Releases2007 4th
caterpillar Quarterly Releases2007 4thcaterpillar Quarterly Releases2007 4th
caterpillar Quarterly Releases2007 4thfinance5
 

Similar to Walmart Quarterly Earnings Q3 2009(2) (20)

wal mart store Quarterly Earnings Releases2008
wal mart store Quarterly Earnings Releases2008wal mart store Quarterly Earnings Releases2008
wal mart store Quarterly Earnings Releases2008
 
williams 1Q 2008
williams 1Q 2008williams 1Q 2008
williams 1Q 2008
 
sherwin-williams 1Q2008
sherwin-williams 1Q2008sherwin-williams 1Q2008
sherwin-williams 1Q2008
 
The Home Depot Announces First Quarter Results
The Home Depot Announces First Quarter ResultsThe Home Depot Announces First Quarter Results
The Home Depot Announces First Quarter Results
 
Q2 2009 Earning Report of Genuine Parts Co.
Q2 2009 Earning Report of Genuine Parts Co.Q2 2009 Earning Report of Genuine Parts Co.
Q2 2009 Earning Report of Genuine Parts Co.
 
Wal Mart Store Financial ResultsFebruary 03/07/08
Wal Mart Store Financial ResultsFebruary 	03/07/08Wal Mart Store Financial ResultsFebruary 	03/07/08
Wal Mart Store Financial ResultsFebruary 03/07/08
 
wal mart store Quarterly Earnings Releases2008
wal mart store Quarterly Earnings Releases2008wal mart store Quarterly Earnings Releases2008
wal mart store Quarterly Earnings Releases2008
 
caterpillar Cat Inc. Q1 2008
caterpillar Cat Inc. Q1 2008caterpillar Cat Inc. Q1 2008
caterpillar Cat Inc. Q1 2008
 
caterpillar Quarterly Releases2008 1st
caterpillar Quarterly Releases2008 1stcaterpillar Quarterly Releases2008 1st
caterpillar Quarterly Releases2008 1st
 
Q1 2009 Earning Report of Supportsoft Inc.
Q1 2009 Earning Report of Supportsoft Inc.Q1 2009 Earning Report of Supportsoft Inc.
Q1 2009 Earning Report of Supportsoft Inc.
 
Q1 2009 Earning Report of Tempur Pedic
Q1 2009 Earning Report of Tempur PedicQ1 2009 Earning Report of Tempur Pedic
Q1 2009 Earning Report of Tempur Pedic
 
2008 - First Quarter Results 2008 In U.S. Gaap
2008 - First Quarter Results 2008 In U.S. Gaap2008 - First Quarter Results 2008 In U.S. Gaap
2008 - First Quarter Results 2008 In U.S. Gaap
 
Q1 2009 Earning Report of Associated Banc-Corp
Q1 2009 Earning Report of Associated Banc-CorpQ1 2009 Earning Report of Associated Banc-Corp
Q1 2009 Earning Report of Associated Banc-Corp
 
Extr 4 q fy pr 2011
Extr 4 q fy pr 2011Extr 4 q fy pr 2011
Extr 4 q fy pr 2011
 
Extreme networks cct
Extreme networks cctExtreme networks cct
Extreme networks cct
 
RealogyQ308CALLTRANSCRIPT_11_07_08FINAL
RealogyQ308CALLTRANSCRIPT_11_07_08FINALRealogyQ308CALLTRANSCRIPT_11_07_08FINAL
RealogyQ308CALLTRANSCRIPT_11_07_08FINAL
 
RealogyQ308CALLTRANSCRIPT_11_07_08FINAL
RealogyQ308CALLTRANSCRIPT_11_07_08FINALRealogyQ308CALLTRANSCRIPT_11_07_08FINAL
RealogyQ308CALLTRANSCRIPT_11_07_08FINAL
 
RealogyQ22008ConferenceCallTranscript_081408
RealogyQ22008ConferenceCallTranscript_081408RealogyQ22008ConferenceCallTranscript_081408
RealogyQ22008ConferenceCallTranscript_081408
 
RealogyQ22008ConferenceCallTranscript_081408
RealogyQ22008ConferenceCallTranscript_081408RealogyQ22008ConferenceCallTranscript_081408
RealogyQ22008ConferenceCallTranscript_081408
 
caterpillar Quarterly Releases2007 4th
caterpillar Quarterly Releases2007 4thcaterpillar Quarterly Releases2007 4th
caterpillar Quarterly Releases2007 4th
 

More from earningsreport

Eastman 4Q and Full Year 2008 Earnings
Eastman 4Q and Full Year 2008 Earnings Eastman 4Q and Full Year 2008 Earnings
Eastman 4Q and Full Year 2008 Earnings earningsreport
 
Gentex investor presentation
Gentex investor presentationGentex investor presentation
Gentex investor presentationearningsreport
 
L.B. Foster Reports Fourth Quarter Operating Results
L.B. Foster Reports Fourth Quarter Operating ResultsL.B. Foster Reports Fourth Quarter Operating Results
L.B. Foster Reports Fourth Quarter Operating Resultsearningsreport
 
Data Domain, Inc. Reports Fourth Quarter Financial Results
Data Domain, Inc. Reports Fourth Quarter Financial ResultsData Domain, Inc. Reports Fourth Quarter Financial Results
Data Domain, Inc. Reports Fourth Quarter Financial Resultsearningsreport
 
First Banks Announces 4Q 2008 Results
First Banks Announces 4Q  2008 ResultsFirst Banks Announces 4Q  2008 Results
First Banks Announces 4Q 2008 Resultsearningsreport
 
Questar 3Q-2008 EARNINGS
Questar 3Q-2008 EARNINGSQuestar 3Q-2008 EARNINGS
Questar 3Q-2008 EARNINGSearningsreport
 
Mitsubishi electric 3Q financial results of Fiscal 2009
Mitsubishi electric 3Q financial results of Fiscal 2009Mitsubishi electric 3Q financial results of Fiscal 2009
Mitsubishi electric 3Q financial results of Fiscal 2009earningsreport
 
Maxim 2Q FISCAL 2009 RESULTS
Maxim 2Q FISCAL 2009 RESULTSMaxim 2Q FISCAL 2009 RESULTS
Maxim 2Q FISCAL 2009 RESULTSearningsreport
 
Conexant Q1 2009 financial results
Conexant Q1 2009 financial resultsConexant Q1 2009 financial results
Conexant Q1 2009 financial resultsearningsreport
 
Flagstar Bancorp Q42008 earnings report
Flagstar Bancorp Q42008 earnings reportFlagstar Bancorp Q42008 earnings report
Flagstar Bancorp Q42008 earnings reportearningsreport
 
Capital Product Partners Fourth Quarter 2008 Earnings
Capital Product Partners Fourth Quarter 2008 EarningsCapital Product Partners Fourth Quarter 2008 Earnings
Capital Product Partners Fourth Quarter 2008 Earningsearningsreport
 
Gannett 4Q 2008 earnings release
Gannett 4Q 2008 earnings releaseGannett 4Q 2008 earnings release
Gannett 4Q 2008 earnings releaseearningsreport
 
Exxon mobil 4Q 2008 earnings release
Exxon mobil 4Q 2008 earnings releaseExxon mobil 4Q 2008 earnings release
Exxon mobil 4Q 2008 earnings releaseearningsreport
 
Chevron Q4 2008 earnings release
Chevron Q4 2008 earnings releaseChevron Q4 2008 earnings release
Chevron Q4 2008 earnings releaseearningsreport
 
Horizon Lines Fourth Quarter 2008 Earnings Release
Horizon Lines Fourth Quarter 2008 Earnings ReleaseHorizon Lines Fourth Quarter 2008 Earnings Release
Horizon Lines Fourth Quarter 2008 Earnings Releaseearningsreport
 
Sony Q3 2008 financial results
Sony Q3 2008 financial resultsSony Q3 2008 financial results
Sony Q3 2008 financial resultsearningsreport
 
Peugeot Q3 2008 financial results
Peugeot Q3 2008 financial resultsPeugeot Q3 2008 financial results
Peugeot Q3 2008 financial resultsearningsreport
 
Peugeot Financial Results for the 1st half of 2008
Peugeot  Financial Results for the 1st half of 2008Peugeot  Financial Results for the 1st half of 2008
Peugeot Financial Results for the 1st half of 2008earningsreport
 
Tesco Q3 fianancial results
Tesco Q3 fianancial resultsTesco Q3 fianancial results
Tesco Q3 fianancial resultsearningsreport
 
tesco Annual Report and Financial Statements 2008
tesco Annual Report and Financial Statements 2008tesco Annual Report and Financial Statements 2008
tesco Annual Report and Financial Statements 2008earningsreport
 

More from earningsreport (20)

Eastman 4Q and Full Year 2008 Earnings
Eastman 4Q and Full Year 2008 Earnings Eastman 4Q and Full Year 2008 Earnings
Eastman 4Q and Full Year 2008 Earnings
 
Gentex investor presentation
Gentex investor presentationGentex investor presentation
Gentex investor presentation
 
L.B. Foster Reports Fourth Quarter Operating Results
L.B. Foster Reports Fourth Quarter Operating ResultsL.B. Foster Reports Fourth Quarter Operating Results
L.B. Foster Reports Fourth Quarter Operating Results
 
Data Domain, Inc. Reports Fourth Quarter Financial Results
Data Domain, Inc. Reports Fourth Quarter Financial ResultsData Domain, Inc. Reports Fourth Quarter Financial Results
Data Domain, Inc. Reports Fourth Quarter Financial Results
 
First Banks Announces 4Q 2008 Results
First Banks Announces 4Q  2008 ResultsFirst Banks Announces 4Q  2008 Results
First Banks Announces 4Q 2008 Results
 
Questar 3Q-2008 EARNINGS
Questar 3Q-2008 EARNINGSQuestar 3Q-2008 EARNINGS
Questar 3Q-2008 EARNINGS
 
Mitsubishi electric 3Q financial results of Fiscal 2009
Mitsubishi electric 3Q financial results of Fiscal 2009Mitsubishi electric 3Q financial results of Fiscal 2009
Mitsubishi electric 3Q financial results of Fiscal 2009
 
Maxim 2Q FISCAL 2009 RESULTS
Maxim 2Q FISCAL 2009 RESULTSMaxim 2Q FISCAL 2009 RESULTS
Maxim 2Q FISCAL 2009 RESULTS
 
Conexant Q1 2009 financial results
Conexant Q1 2009 financial resultsConexant Q1 2009 financial results
Conexant Q1 2009 financial results
 
Flagstar Bancorp Q42008 earnings report
Flagstar Bancorp Q42008 earnings reportFlagstar Bancorp Q42008 earnings report
Flagstar Bancorp Q42008 earnings report
 
Capital Product Partners Fourth Quarter 2008 Earnings
Capital Product Partners Fourth Quarter 2008 EarningsCapital Product Partners Fourth Quarter 2008 Earnings
Capital Product Partners Fourth Quarter 2008 Earnings
 
Gannett 4Q 2008 earnings release
Gannett 4Q 2008 earnings releaseGannett 4Q 2008 earnings release
Gannett 4Q 2008 earnings release
 
Exxon mobil 4Q 2008 earnings release
Exxon mobil 4Q 2008 earnings releaseExxon mobil 4Q 2008 earnings release
Exxon mobil 4Q 2008 earnings release
 
Chevron Q4 2008 earnings release
Chevron Q4 2008 earnings releaseChevron Q4 2008 earnings release
Chevron Q4 2008 earnings release
 
Horizon Lines Fourth Quarter 2008 Earnings Release
Horizon Lines Fourth Quarter 2008 Earnings ReleaseHorizon Lines Fourth Quarter 2008 Earnings Release
Horizon Lines Fourth Quarter 2008 Earnings Release
 
Sony Q3 2008 financial results
Sony Q3 2008 financial resultsSony Q3 2008 financial results
Sony Q3 2008 financial results
 
Peugeot Q3 2008 financial results
Peugeot Q3 2008 financial resultsPeugeot Q3 2008 financial results
Peugeot Q3 2008 financial results
 
Peugeot Financial Results for the 1st half of 2008
Peugeot  Financial Results for the 1st half of 2008Peugeot  Financial Results for the 1st half of 2008
Peugeot Financial Results for the 1st half of 2008
 
Tesco Q3 fianancial results
Tesco Q3 fianancial resultsTesco Q3 fianancial results
Tesco Q3 fianancial results
 
tesco Annual Report and Financial Statements 2008
tesco Annual Report and Financial Statements 2008tesco Annual Report and Financial Statements 2008
tesco Annual Report and Financial Statements 2008
 

Recently uploaded

(DIYA) Bhumkar Chowk Call Girls Just Call 7001035870 [ Cash on Delivery ] Pun...
(DIYA) Bhumkar Chowk Call Girls Just Call 7001035870 [ Cash on Delivery ] Pun...(DIYA) Bhumkar Chowk Call Girls Just Call 7001035870 [ Cash on Delivery ] Pun...
(DIYA) Bhumkar Chowk Call Girls Just Call 7001035870 [ Cash on Delivery ] Pun...ranjana rawat
 
VIP Call Girls LB Nagar ( Hyderabad ) Phone 8250192130 | ₹5k To 25k With Room...
VIP Call Girls LB Nagar ( Hyderabad ) Phone 8250192130 | ₹5k To 25k With Room...VIP Call Girls LB Nagar ( Hyderabad ) Phone 8250192130 | ₹5k To 25k With Room...
VIP Call Girls LB Nagar ( Hyderabad ) Phone 8250192130 | ₹5k To 25k With Room...Suhani Kapoor
 
call girls in Nand Nagri (DELHI) 🔝 >༒9953330565🔝 genuine Escort Service 🔝✔️✔️
call girls in  Nand Nagri (DELHI) 🔝 >༒9953330565🔝 genuine Escort Service 🔝✔️✔️call girls in  Nand Nagri (DELHI) 🔝 >༒9953330565🔝 genuine Escort Service 🔝✔️✔️
call girls in Nand Nagri (DELHI) 🔝 >༒9953330565🔝 genuine Escort Service 🔝✔️✔️9953056974 Low Rate Call Girls In Saket, Delhi NCR
 
Log your LOA pain with Pension Lab's brilliant campaign
Log your LOA pain with Pension Lab's brilliant campaignLog your LOA pain with Pension Lab's brilliant campaign
Log your LOA pain with Pension Lab's brilliant campaignHenry Tapper
 
Financial institutions facilitate financing, economic transactions, issue fun...
Financial institutions facilitate financing, economic transactions, issue fun...Financial institutions facilitate financing, economic transactions, issue fun...
Financial institutions facilitate financing, economic transactions, issue fun...Avanish Goel
 
VIP Kolkata Call Girl Serampore 👉 8250192130 Available With Room
VIP Kolkata Call Girl Serampore 👉 8250192130  Available With RoomVIP Kolkata Call Girl Serampore 👉 8250192130  Available With Room
VIP Kolkata Call Girl Serampore 👉 8250192130 Available With Roomdivyansh0kumar0
 
Stock Market Brief Deck for 4/24/24 .pdf
Stock Market Brief Deck for 4/24/24 .pdfStock Market Brief Deck for 4/24/24 .pdf
Stock Market Brief Deck for 4/24/24 .pdfMichael Silva
 
20240417-Calibre-April-2024-Investor-Presentation.pdf
20240417-Calibre-April-2024-Investor-Presentation.pdf20240417-Calibre-April-2024-Investor-Presentation.pdf
20240417-Calibre-April-2024-Investor-Presentation.pdfAdnet Communications
 
How Automation is Driving Efficiency Through the Last Mile of Reporting
How Automation is Driving Efficiency Through the Last Mile of ReportingHow Automation is Driving Efficiency Through the Last Mile of Reporting
How Automation is Driving Efficiency Through the Last Mile of ReportingAggregage
 
High Class Call Girls Nashik Maya 7001305949 Independent Escort Service Nashik
High Class Call Girls Nashik Maya 7001305949 Independent Escort Service NashikHigh Class Call Girls Nashik Maya 7001305949 Independent Escort Service Nashik
High Class Call Girls Nashik Maya 7001305949 Independent Escort Service NashikCall Girls in Nagpur High Profile
 
Call Girls In Yusuf Sarai Women Seeking Men 9654467111
Call Girls In Yusuf Sarai Women Seeking Men 9654467111Call Girls In Yusuf Sarai Women Seeking Men 9654467111
Call Girls In Yusuf Sarai Women Seeking Men 9654467111Sapana Sha
 
OAT_RI_Ep19 WeighingTheRisks_Apr24_TheYellowMetal.pptx
OAT_RI_Ep19 WeighingTheRisks_Apr24_TheYellowMetal.pptxOAT_RI_Ep19 WeighingTheRisks_Apr24_TheYellowMetal.pptx
OAT_RI_Ep19 WeighingTheRisks_Apr24_TheYellowMetal.pptxhiddenlevers
 
SBP-Market-Operations and market managment
SBP-Market-Operations and market managmentSBP-Market-Operations and market managment
SBP-Market-Operations and market managmentfactical
 
Unveiling the Top Chartered Accountants in India and Their Staggering Net Worth
Unveiling the Top Chartered Accountants in India and Their Staggering Net WorthUnveiling the Top Chartered Accountants in India and Their Staggering Net Worth
Unveiling the Top Chartered Accountants in India and Their Staggering Net WorthShaheen Kumar
 
(办理原版一样)QUT毕业证昆士兰科技大学毕业证学位证留信学历认证成绩单补办
(办理原版一样)QUT毕业证昆士兰科技大学毕业证学位证留信学历认证成绩单补办(办理原版一样)QUT毕业证昆士兰科技大学毕业证学位证留信学历认证成绩单补办
(办理原版一样)QUT毕业证昆士兰科技大学毕业证学位证留信学历认证成绩单补办fqiuho152
 
House of Commons ; CDC schemes overview document
House of Commons ; CDC schemes overview documentHouse of Commons ; CDC schemes overview document
House of Commons ; CDC schemes overview documentHenry Tapper
 
Attachment Of Assets......................
Attachment Of Assets......................Attachment Of Assets......................
Attachment Of Assets......................AmanBajaj36
 
Authentic No 1 Amil Baba In Pakistan Authentic No 1 Amil Baba In Karachi No 1...
Authentic No 1 Amil Baba In Pakistan Authentic No 1 Amil Baba In Karachi No 1...Authentic No 1 Amil Baba In Pakistan Authentic No 1 Amil Baba In Karachi No 1...
Authentic No 1 Amil Baba In Pakistan Authentic No 1 Amil Baba In Karachi No 1...First NO1 World Amil baba in Faisalabad
 

Recently uploaded (20)

(DIYA) Bhumkar Chowk Call Girls Just Call 7001035870 [ Cash on Delivery ] Pun...
(DIYA) Bhumkar Chowk Call Girls Just Call 7001035870 [ Cash on Delivery ] Pun...(DIYA) Bhumkar Chowk Call Girls Just Call 7001035870 [ Cash on Delivery ] Pun...
(DIYA) Bhumkar Chowk Call Girls Just Call 7001035870 [ Cash on Delivery ] Pun...
 
VIP Call Girls LB Nagar ( Hyderabad ) Phone 8250192130 | ₹5k To 25k With Room...
VIP Call Girls LB Nagar ( Hyderabad ) Phone 8250192130 | ₹5k To 25k With Room...VIP Call Girls LB Nagar ( Hyderabad ) Phone 8250192130 | ₹5k To 25k With Room...
VIP Call Girls LB Nagar ( Hyderabad ) Phone 8250192130 | ₹5k To 25k With Room...
 
call girls in Nand Nagri (DELHI) 🔝 >༒9953330565🔝 genuine Escort Service 🔝✔️✔️
call girls in  Nand Nagri (DELHI) 🔝 >༒9953330565🔝 genuine Escort Service 🔝✔️✔️call girls in  Nand Nagri (DELHI) 🔝 >༒9953330565🔝 genuine Escort Service 🔝✔️✔️
call girls in Nand Nagri (DELHI) 🔝 >༒9953330565🔝 genuine Escort Service 🔝✔️✔️
 
Log your LOA pain with Pension Lab's brilliant campaign
Log your LOA pain with Pension Lab's brilliant campaignLog your LOA pain with Pension Lab's brilliant campaign
Log your LOA pain with Pension Lab's brilliant campaign
 
Financial institutions facilitate financing, economic transactions, issue fun...
Financial institutions facilitate financing, economic transactions, issue fun...Financial institutions facilitate financing, economic transactions, issue fun...
Financial institutions facilitate financing, economic transactions, issue fun...
 
VIP Kolkata Call Girl Serampore 👉 8250192130 Available With Room
VIP Kolkata Call Girl Serampore 👉 8250192130  Available With RoomVIP Kolkata Call Girl Serampore 👉 8250192130  Available With Room
VIP Kolkata Call Girl Serampore 👉 8250192130 Available With Room
 
Stock Market Brief Deck for 4/24/24 .pdf
Stock Market Brief Deck for 4/24/24 .pdfStock Market Brief Deck for 4/24/24 .pdf
Stock Market Brief Deck for 4/24/24 .pdf
 
20240417-Calibre-April-2024-Investor-Presentation.pdf
20240417-Calibre-April-2024-Investor-Presentation.pdf20240417-Calibre-April-2024-Investor-Presentation.pdf
20240417-Calibre-April-2024-Investor-Presentation.pdf
 
How Automation is Driving Efficiency Through the Last Mile of Reporting
How Automation is Driving Efficiency Through the Last Mile of ReportingHow Automation is Driving Efficiency Through the Last Mile of Reporting
How Automation is Driving Efficiency Through the Last Mile of Reporting
 
High Class Call Girls Nashik Maya 7001305949 Independent Escort Service Nashik
High Class Call Girls Nashik Maya 7001305949 Independent Escort Service NashikHigh Class Call Girls Nashik Maya 7001305949 Independent Escort Service Nashik
High Class Call Girls Nashik Maya 7001305949 Independent Escort Service Nashik
 
Call Girls In Yusuf Sarai Women Seeking Men 9654467111
Call Girls In Yusuf Sarai Women Seeking Men 9654467111Call Girls In Yusuf Sarai Women Seeking Men 9654467111
Call Girls In Yusuf Sarai Women Seeking Men 9654467111
 
OAT_RI_Ep19 WeighingTheRisks_Apr24_TheYellowMetal.pptx
OAT_RI_Ep19 WeighingTheRisks_Apr24_TheYellowMetal.pptxOAT_RI_Ep19 WeighingTheRisks_Apr24_TheYellowMetal.pptx
OAT_RI_Ep19 WeighingTheRisks_Apr24_TheYellowMetal.pptx
 
SBP-Market-Operations and market managment
SBP-Market-Operations and market managmentSBP-Market-Operations and market managment
SBP-Market-Operations and market managment
 
Unveiling the Top Chartered Accountants in India and Their Staggering Net Worth
Unveiling the Top Chartered Accountants in India and Their Staggering Net WorthUnveiling the Top Chartered Accountants in India and Their Staggering Net Worth
Unveiling the Top Chartered Accountants in India and Their Staggering Net Worth
 
(办理原版一样)QUT毕业证昆士兰科技大学毕业证学位证留信学历认证成绩单补办
(办理原版一样)QUT毕业证昆士兰科技大学毕业证学位证留信学历认证成绩单补办(办理原版一样)QUT毕业证昆士兰科技大学毕业证学位证留信学历认证成绩单补办
(办理原版一样)QUT毕业证昆士兰科技大学毕业证学位证留信学历认证成绩单补办
 
House of Commons ; CDC schemes overview document
House of Commons ; CDC schemes overview documentHouse of Commons ; CDC schemes overview document
House of Commons ; CDC schemes overview document
 
Attachment Of Assets......................
Attachment Of Assets......................Attachment Of Assets......................
Attachment Of Assets......................
 
Commercial Bank Economic Capsule - April 2024
Commercial Bank Economic Capsule - April 2024Commercial Bank Economic Capsule - April 2024
Commercial Bank Economic Capsule - April 2024
 
Authentic No 1 Amil Baba In Pakistan Authentic No 1 Amil Baba In Karachi No 1...
Authentic No 1 Amil Baba In Pakistan Authentic No 1 Amil Baba In Karachi No 1...Authentic No 1 Amil Baba In Pakistan Authentic No 1 Amil Baba In Karachi No 1...
Authentic No 1 Amil Baba In Pakistan Authentic No 1 Amil Baba In Karachi No 1...
 
🔝+919953056974 🔝young Delhi Escort service Pusa Road
🔝+919953056974 🔝young Delhi Escort service Pusa Road🔝+919953056974 🔝young Delhi Escort service Pusa Road
🔝+919953056974 🔝young Delhi Escort service Pusa Road
 

Walmart Quarterly Earnings Q3 2009(2)

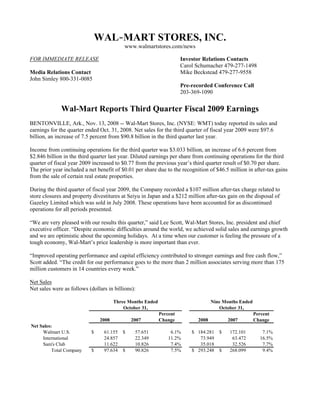
  • 1. WAL-MART STORES, INC. www.walmartstores.com/news FOR IMMEDIATE RELEASE Investor Relations Contacts Media Relations Contact Carol Schumacher 479-277-1498 Mike Beckstead 479-277-9558 John Simley 800-331-0085 Pre-recorded Conference Call 203-369-1090 Wal-Mart Reports Third Quarter Fiscal 2009 Earnings BENTONVILLE, Ark., Nov. 13, 2008 -- Wal-Mart Stores, Inc. (NYSE: WMT) today reported its sales and earnings for the quarter ended Oct. 31, 2008. Net sales for the third quarter of fiscal year 2009 were $97.6 billion, an increase of 7.5 percent from $90.8 billion in the third quarter last year. Income from continuing operations for the third quarter was $3.033 billion, an increase of 6.6 percent from $2.846 billion in the third quarter last year. Diluted earnings per share from continuing operations for the third quarter of fiscal year 2009 increased to $0.77 from the previous year’s third quarter result of $0.70 per share. The prior year included a net benefit of $0.01 per share due to the recognition of $46.5 million in after-tax gains from the sale of certain real estate properties. During the third quarter of fiscal year 2009, the Company recorded a $107 million after-tax charge related to store closures and property divestitures at Seiyu in Japan and a $212 million after-tax gain on the disposal of Gazeley Limited which was sold in July 2008. These operations have been accounted for as discontinued operations for all periods presented. “We are very pleased with our results this quarter,” said Lee Scott, Wal-Mart Stores, Inc. president and chief executive officer. “Despite economic difficulties around the world, we achieved solid sales and earnings growth and we are optimistic about the upcoming holidays. At a time when our customer is feeling the pressure of a tough economy, Wal-Mart’s price leadership is more important than ever. “Improved operating performance and capital efficiency contributed to stronger earnings and free cash flow,” Scott added. “The credit for our performance goes to the more than 2 million associates serving more than 175 million customers in 14 countries every week.” Net Sales Net sales were as follows (dollars in billions): Percent Percent 2008 2007 Change 2008 2007 Change Net Sales: Walmart U.S. 61.155$ 57.651$ 6.1% 184.281$ 172.101$ 7.1% International 24.857 22.349 11.2% 73.949 63.472 16.5% Sam's Club 11.622 10.826 7.4% 35.018 32.526 7.7% Total Company 97.634$ 90.826$ 7.5% 293.248$ 268.099$ 9.4% Three Months Ended October 31, October 31, Nine Months Ended
  • 2. 2 “Our sales results reflect the improved customer experience and sharper merchandising presentation at Walmart U.S., as well as higher traffic at Sam’s Club among both Business and Advantage members,” Scott said. “International remains Wal-Mart’s fastest-growing business, proving that our mission of saving people money so they can live better resonates with customers everywhere we do business.” Free cash flow increased to approximately $2.0 billion for the first nine months of fiscal year 2009, compared to a deficit of $1.3 billion for the same period last year. Wal-Mart defines free cash flow, a non-GAAP measure, as cash provided by operating activities, less capital expenditures. A reconciliation of free cash flow for the first nine months of this fiscal year to the most directly comparable GAAP measure for the same period is available on Form 8-K furnished today with the Securities and Exchange Commission and at www.walmartstores.com/investors. Segment Operating Income Segment operating income for each operating segment, which is defined as income from continuing operations before net interest expense, income taxes, unallocated corporate overhead and minority interest, was as follows (dollars in billions): 2008 2007 Percent Change 2008 2007 Percent Change Segment Operating Income: Walmart U.S. 4.286$ 3.995$ 7.3% 13.363$ 12.230$ 9.3% International 1.182 1.069 10.6% 3.450 2.986 15.5% Sam's Club 0.365 0.359 1.7% 1.183 1.174 0.8% Three Months Ended October 31, Nine Months Ended October 31, Comparable Store Sales The Company reports comparable store sales in this earnings release based on the calendar months in the quarters that ended Oct. 31, 2008 and 2007. Comparable store sales for the United States were as follows: 2008 2007 2008 2007 2008 2007 Walmart U.S. 2.7% 1.0% 2.7% 1.0% 0.0% 0.0% Sam's Club 4.5% 3.9% 6.7% 3.8% 2.2% -0.1% Total U.S. 3.0% 1.5% 3.3% 1.5% 0.3% 0.0% Without Fuel Three Months Ended October 31, With Fuel October 31, Three Months Ended October 31, Fuel Impact Three Months Ended 2008 2007 2008 2007 2008 2007 Walmart U.S. 3.4% 0.7% 3.4% 0.7% 0.0% 0.0% Sam's Club 4.0% 4.8% 6.8% 4.8% 2.8% 0.0% Total U.S. 3.5% 1.4% 3.9% 1.4% 0.4% 0.0% October 31, Nine Months Ended October 31, Fuel Impact Nine Months Ended Without Fuel Nine Months Ended October 31, With Fuel
  • 3. 3 Guidance For the fourth quarter of fiscal year 2009, the Company estimates the comparable store sales increase in the United States to be between one and three percent, according to Tom Schoewe, Wal-Mart Stores, Inc. executive vice president and chief financial officer. “We estimate diluted earnings per share from continuing operations for the fourth quarter will be between $1.03 and $1.07,” Schoewe said. “The rapid changes in currency exchange rates during the last few weeks are projected to negatively affect this year’s fourth-quarter results by approximately six cents per share. In U.S. dollar terms, strong operating performance in International may be overshadowed by these currency fluctuations. “For the full year, ending January 31, we have tightened and modestly reduced our guidance and now forecast diluted earnings per share from continuing operations to be within a range of $3.42 to $3.46,” he said. After this earnings release has been furnished to the SEC, a pre-recorded call offering additional comments on the quarter will be available to all investors. Callers may listen to this call by dialing 203-369-1090. The information included in this release and the pre-recorded phone call are available in the investor information area on the Company’s Web site at www.walmartstores.com/investors. Wal-Mart Stores, Inc. operates Walmart discount stores, supercenters, Neighborhood Markets and Sam’s Club locations in the United States. The Company operates in Argentina, Brazil, Canada, China, Costa Rica, El Salvador, Guatemala, Honduras, Japan, Mexico, Nicaragua, Puerto Rico and the United Kingdom and, through a joint venture, in India. The Company's common stock is listed on the New York Stock Exchange under the symbol WMT. More information about Wal-Mart can be found by visiting www.walmartstores.com. Online merchandise sales are available at www.walmart.com and www.samsclub.com. # # # This release contains statements as to our management’s expectations regarding the comparable store sales increase in the United States in the fourth quarter of fiscal year 2009, the Company’s expectations for its diluted earnings per share from continuing operations for the fourth quarter of fiscal year 2009 and for all of fiscal year 2009, and our management’s expectation that currency exchange rates and related issues will be detrimental to comparisons between results for the fourth quarter of fiscal year 2009 and those for the fourth quarter of fiscal year 2008 that Wal-Mart believes are “forward-looking statements” within the meaning of the Private Securities Litigation Reform Act of 1995, as amended. These statements are intended to enjoy the protection of the safe harbor for forward-looking statements provided by that Act. These statements can be identified by the use of the word “anticipate,” “estimate,” “may be,” forecast” or “projected” in the statements. These forward-looking statements are subject to risks, uncertainties and other factors, domestically and internationally, including general economic conditions, the cost of goods, competitive pressures, geopolitical events and conditions, consumer credit availability, inflation, consumer spending patterns and debt levels, currency exchange fluctuations, trade restrictions, changes in tariff and freight rates, changes in the costs of gasoline, diesel fuel, other energy, transportation, utilities, labor and health care, accident costs, casualty and other insurance costs, interest rate fluctuations, financial and capital market conditions, weather conditions, damage to the Company’s facilities from natural disasters, regulatory matters and other risks. The Company discusses certain of these factors more fully in its additional filings with the SEC, including its last annual report on Form 10-K filed with the SEC, and this release should be read in conjunction with that annual report on Form 10-K, together with all of the Company’s other filings, including current reports on Form 8-K, made with the SEC through the date of this release. The Company urges you to consider all of these risks, uncertainties and other factors carefully in evaluating the forward-looking statements contained in this release. As a result of these matters, changes in facts, assumptions not being realized or other circumstances, the Company’s actual results may differ materially from the expected results discussed in the forward-looking statements contained in this release. The forward- looking statements made in this release are made only as of the date of this release, and the Company undertakes no obligation to update them to reflect subsequent events or circumstances.
  • 4. 4 SUBJECT TO RECLASSIFICATION 2008 2007 2008 2007 Revenues: Net sales 97,634$ 90,826$ 293,248$ 268,099$ Membership and other income 1,008 1,039 3,243 3,034 98,642 91,865 296,491 271,133 Costs and expenses: Cost of sales 74,114 69,251 223,557 205,073 Operating, selling, general and administrative expenses 19,236 17,653 56,513 50,984 Operating income 5,292 4,961 16,421 15,076 Interest: Debt 464 474 1,402 1,326 Capital leases 73 63 222 174 Interest income (81) (77) (216) (246) Interest, net 456 460 1,408 1,254 Income from continuing operations before income taxes and minority interest 4,836 4,501 15,013 13,822 Provision for income taxes 1,690 1,556 5,186 4,764 Income from continuing operations before minority interest 3,146 2,945 9,827 9,058 Minority interest (113) (99) (365) (305) Income from continuing operations 3,033 2,846 9,462 8,753 Income (loss) from discontinued operations, net of tax 105 11 146 (118) Net income 3,138$ 2,857$ 9,608$ 8,635$ Net income per common share: Basic income per common share from continuing operations 0.77$ 0.70$ 2.40$ 2.14$ Basic income (loss) per common share from discontinued operations 0.03 0.01 0.04 (0.03) Basic net income per common share 0.80$ 0.71$ 2.44$ 2.11$ Diluted income per common share from continuing operations 0.77$ 0.70$ 2.39$ 2.14$ Diluted income (loss) per common share from discontinued operations 0.03 - 0.04 (0.03) Diluted net income per common share 0.80$ 0.70$ 2.43$ 2.11$ Weighted-average number of common shares: Basic 3,931 4,051 3,944 4,092 Diluted 3,944 4,056 3,956 4,097 Dividends declared per common share -$ -$ 0.95$ 0.88$ Wal-Mart Stores, Inc. Condensed Consolidated Statements of Income (Unaudited) (Amounts in millions except per share data) Three Months Ended Nine Months Ended October 31, October 31,
  • 5. 5 SUBJECT TO RECLASSIFICATION October 31, October 31, January 31, 2008 2007 2008 ASSETS Current assets: Cash and cash equivalents 5,920$ 5,518$ 5,492$ Receivables 3,250 3,062 3,642 Inventories 40,416 39,535 35,159 Prepaid expenses and other 3,245 2,880 2,760 Current assets of discontinued operations 25 511 532 Total current assets 52,856 51,506 47,585 Property and equipment, at cost: Property and equipment, at cost 125,173 120,396 122,256 Less accumulated depreciation (31,467) (27,537) (28,531) Property and equipment, net 93,706 92,859 93,725 Property under capital lease: Property under capital lease 5,420 5,690 5,736 Less accumulated amortization (2,581) (2,563) (2,594) Property under capital leases, net 2,839 3,127 3,142 Goodwill 15,416 14,898 16,071 Other assets and deferred charges 2,789 3,031 2,748 Non-current assets of discontinued operations 237 238 243 Total assets 167,843$ 165,659$ 163,514$ LIABILITIES AND SHAREHOLDERS’ EQUITY Current liabilities: Commercial paper 7,932$ 9,126$ 5,040$ Accounts payable 30,782 31,376 30,344 Dividends payable 993 896 - Accrued liabilities 15,343 14,773 15,725 Accrued income taxes 355 - 1,000 Long-term debt due within one year 4,753 4,412 5,913 Obligations under capital leases due within one year 314 309 316 Current liabilities of discontinued operations 128 50 116 Total current liabilities 60,600 60,942 58,454 Long-term debt 30,803 30,070 29,799 Long-term obligations under capital leases 3,268 3,520 3,603 Deferred income taxes and other 5,575 5,590 5,087 Minority interest 2,034 2,432 1,939 Non-current liabilities of discontinued operations 24 23 24 Commitments and contingencies Shareholders' equity: Common stock and capital in excess of par value 4,219 3,421 3,425 Retained earnings 59,809 55,522 57,319 Accumulated other comprehensive income 1,511 4,139 3,864 Total shareholders’ equity 65,539 63,082 64,608 Total liabilities and shareholders’ equity 167,843$ 165,659$ 163,514$ Wal-Mart Stores, Inc. Condensed Consolidated Balance Sheets (Unaudited) (Amounts in millions)
  • 6. 6 SUBJECT TO RECLASSIFICATION 2008 2007 Cash flows from operating activities: Net income 9,608$ 8,635$ (Income) loss from discontinued operations, net of tax (146) 118 Income from continuing operations 9,462 8,753 Adjustments to reconcile income from continuing operations to net cash provided by operating activities: Depreciation and amortization 5,054 4,656 Other 749 321 Changes in certain assets and liabilities, net of effects of acquisitions: Decrease in accounts receivable 394 31 Increase in inventories (5,655) (5,037) Increase in accounts payable 914 1,450 Decrease in accrued liabilities (745) (551) Net cash provided by operating activities 10,173 9,623 Cash flows from investing activities: Payments for property and equipment (8,174) (10,896) Proceeds from disposal of property and equipment 779 478 Proceeds from (payments for) disposal of certain international operations, net 838 (257) Investment in international operations, net of cash acquired (74) (461) Other investing activities (166) (87) Net cash used in investing activities (6,797) (11,223) Cash flows from financing activities: Increase in commercial paper 2,949 6,481 Proceeds from issuance of long-term debt 5,568 7,967 Payment of long-term debt (5,064) (6,671) Dividends paid (2,814) (2,707) Purchase of company stock (3,521) (5,279) Other financing activities 88 (669) Net cash used in financing activities (2,794) (878) Effect of exchange rates on cash (231) 258 Net increase (decrease) in cash and cash equivalents 351 (2,220) Cash and cash equivalents at beginning of year (1) 5,569 7,767 Cash and cash equivalents at end of period (2) 5,920$ 5,547$ and $51 million at January 31, 2007 respectively. (2) Includes cash and cash equivalents of discontinued operations of $29 million at October 31, 2007. (1) Includes cash and cash equivalents of discontinued operations of $77 million at January 31, 2008, Nine Months Ended October 31, Wal-Mart Stores, Inc. Condensed Consolidated Statements of Cash Flows (Unaudited) (Amounts in millions)