Before the Open May 11 2017
•
1 like•73 views

- US and Asian stock futures fell, while European stocks dropped, as concerns over global growth weighed on investor sentiment. - Aecon Group reported a 143% rise in quarterly earnings due to lower costs and margin improvements. - Canadian Tire reported higher-than-expected quarterly revenue and profit helped by strong demand for apparel and home products.

Recommended
More Related Content
What's hot
What's hot (20)
Similar to Before the Open May 11 2017
Similar to Before the Open May 11 2017 (19)
More from John Pendrith
More from John Pendrith (16)
Recently uploaded
Recently uploaded (20)
Before the Open May 11 2017
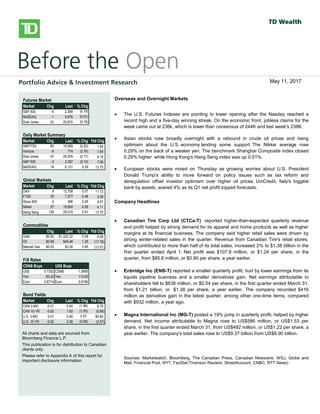
- 1. bbbsb Overseas/Overnight Markets U.S. stock index futures fell, taking a cue from European and Asian markets, as worries over global growth prospects and the outcome of Greece’s private-sector bond swap later this week weigh on sentiment. There is no U.S. economic data on the docket today. European stocks dropped, with banks and resource stocks among the `largest detractors. A report released this morning showed a 0.3% Q/Q contraction in the euro-area economy in Q4, confirming an initial estimate published on February 15. Large declines in investment, exports and consumer spending were to blame for the overall GDP contraction. Also weighing on investors was a memo from the Institute of International Finance that warned that a disorderly default would cause the euro zone more than 1 trillion euros ($1.36 trillion) in damage, Reuters reported. The report also stated that a default would likely force Italy and Spain to seek aid to prevent being engulfed in the region’s debt crisis. Private investors that have declared their participation in Greece’s debt restructuring hold about 20% of the bonds involved in a swap, the creditors’ stering committee said yesterday. The goal of the swap, which runs through March 8, is to reduce the amount of privately-held Greek debt by 53.5% and help secure Greece’s second rescue package. Asian stocks fell sharply, with miners among the top declines, following global markets lower on growth concerns. The Hang Seng shed 2.2%, while the Shanghai Composite fell 1.4%. Japan’s Nikkei gave up a more modest 0.6%. North American Market Highlights & Headlines Aecon Group Inc. (ARE-T) reported a 143% increase in quarterly earnings on Monday as margins improved on lower costs. Aecon reported EPS of $0.49, up from $0.20 a year ago. Revenue in the quarter was $790 million, down from $841 million, and well shy of the $859 million consensus estimate. Aecon's backlog stood at $2.39 billion at December 31, 2011. Futures Market Market Chg Last % Chg S&P 500 -4 2,389 (0.18) NASDAQ -1 5,676 (0.01) Dow Jones -33 20,874 (0.16) Daily Market Summary Market Chg Last % Chg Ytd Chg S&P/TSX -83 15,569 (0.53) 1.84 Venture -6 774 (0.76) 1.54 Dow Jones -37 20,976 (0.17) 6.14 S&P 500 -2 2,397 (0.10) 7.06 NASDAQ 18 6,121 0.29 13.70 Global Markets Market Chg Last % Chg Ytd Chg DAX 9 12,758 0.07 11.12 FTSE 35 7,377 0.48 3.28 Stoxx 600 0 396 0.05 9.57 Nikkei 57 19,900 0.29 4.11 Hang Seng 126 25,015 0.51 13.70 Commodities Chg Last % Chg Ytd Chg Gold $0.92 $1,222.32 0.08 6.08 Oil $0.58 $46.46 1.25 (17.76) Natural Gas $0.03 $3.26 0.95 (12.51) F/X Rates CDN$ Buys US$ Buys US$ 0.7302 CDN$ 1.3695 Yen 83.20 Yen 113.93 Euro 0.6714 Euro 0.9194 Bond Yields Market Chg Last % Chg Ytd Chg CAN 3-MO -0.01 0.50 (1.96) 8.70 CAN 10-YR -0.02 1.60 (1.05) (6.86) U.S. 3-MO 0.01 0.90 0.57 80.80 U.S. 10-YR -0.02 2.38 (0.68) (2.57) All charts and data are sourced from Bloomberg Finance L.P. This publication is for distribution to Canadian clients only. Please refer to Appendix A of this report for important disclosure information. Overseas and Overnight Markets The U.S. Futures Indexes are pointing to lower opening after the Nasdaq reached a record high and a five-day winning streak. On the economic front, jobless claims for the week came out at 236k, which is lower than consensus of 244K and last week's 238K. Asian stocks rose broadly overnight with a rebound in crude oil prices and rising optimism about the U.S. economy lending some support. The Nikkei average rose 0.29% on the back of a weaker yen. The benchmark Shanghai Composite index closed 0.29% higher while Hong Kong's Hang Seng index was up 0.51%. European stocks were mixed on Thursday as growing worries about U.S. President Donald Trump's ability to move forward on policy issues such as tax reform and deregulation offset investor optimism over higher oil prices. UniCredit, Italy's biggest bank by assets, soared 4% as its Q1 net profit topped forecasts. Company Headlines Canadian Tire Corp Ltd (CTCa-T) reported higher-than-expected quarterly revenue and profit helped by strong demand for its apparel and home products as well as higher margins at its financial business. The company said higher retail sales were driven by strong winter-related sales in the quarter. Revenue from Canadian Tire's retail stores, which contributed to more than half of its total sales, increased 2% to $1.38 billion in the first quarter ended April 1. Net profit was $107.9 million, or $1.24 per share, in the quarter, from $85.6 million, or $0.90 per share, a year earlier. Enbridge Inc (ENB-T) reported a smaller quarterly profit, hurt by lower earnings from its liquids pipeline business and a smaller derivatives gain. Net earnings attributable to shareholders fell to $638 million, or $0.54 per share, in the first quarter ended March 31, from $1.21 billion, or $1.38 per share, a year earlier. The company recorded $416 million as derivative gain in the latest quarter, among other one-time items, compared with $932 million, a year ago. Magna International Inc (MG-T) posted a 19% jump in quarterly profit, helped by higher demand. Net income attributable to Magna rose to US$586 million, or US$1.53 per share, in the first quarter ended March 31, from US$492 million, or US$1.22 per share, a year earlier. The company's total sales rose to US$9.37 billion from US$8.90 billion. Sources: Marketwatch, Bloomberg, The Canadian Press, Canadian Newswire, WSJ, Globe and Mail, Financial Post, NYT, FactSet,Thomson Reuters, StreetAccount, CNBC, RTT News) May 11, 2017
- 2. Before the Open May 11, 2017 Page 2 Canadian Equities Upgrades - March 6 Weekly Canada Economic Calendar - May 08 to May 12, 2017 Date/Time Event Period Consensus Actual Prior 05/08/2017 08:15 Housing Starts Apr 215.0k 214.1k 252.3k 05/08/2017 10:00 Bloomberg Nanos Confidence 5-May -- 59 59.4 05/09/2017 08:30 Building Permits MoM Mar 2.80% -5.80% -2.80% 05/11/2017 08:30 New Housing Price Index MoM Mar 0.20% 0.20% 0.40% 05/11/2017 08:30 New Housing Price Index YoY Mar -- 3.30% 3.30% 05/12/2017 08:30 Teranet/National Bank HPI MoM Apr -- -- 0.90% 05/12/2017 08:30 Teranet/National Bank HPI YoY Apr -- -- 13.50% 05/12/2017 08:30 Teranet/National Bank HP Index Apr -- -- 204.05 S&P/TSX Daily Performance 13000 13500 14000 14500 15000 15500 16000 May-16 Jul-16 Sep-16 Nov-16 Jan-17 Mar-17 May-17 Leaders - Prior Session Company Ticker % Change Element Fleet Management Corp EFN-T 8.81 IAMGOLD Corp IMG-T 8.40 Sleep Country Canada Holdings IncZZZ-T 7.34 Spartan Energy Corp SPE-T 7.11 NuVista Energy Ltd NVA-T 6.50 Laggards - Prior Session Company Ticker % Change TMX Group Ltd X-T -6.71 Canopy Growth Corp WEED-T -4.49 Exchange Income Corp EIF-T -4.43 Westshore Terminals Investment CorpWTE-T -3.86 Sun Life Financial Inc SLF-T -3.38 Canadian Equity Upgrades Exchange Income Raised to Buy at TD Iamgold Upgraded to Buy at Cormark Canadian Equity Downgrades Aimia Cut to Reduce at GMP Centric Helath Cut to Sector Perform at National Bank Today's Earnings – Canada TELUS Corp $0.72, Enbridge Inc $0.64, TransGlobe Energy Corp -$0.02, Magna International Inc $1.34, Power Financial Corp $0.75, McCoy Global Inc -$0.07, Cominar Real Estate Investment Trust $0.36, Clearwater Seafoods Inc $0.01, Enbridge Income Fund Holdings Inc $0.57, Cipher Pharmaceuticals Inc $0.05, Medical Facilities Corp $0.05, Student Transportation Inc $0.07, MEG Energy Corp -$0.25, Premier Gold Mines Ltd $0.07, Timmins Gold Corp $0.01, Tricon Capital Group Inc $0.13, Knight Therapeutics Inc $0.03, Bombardier Inc -$0.02, Valener Inc $0.90, Canadian Tire Corp Ltd $0.95, Innova Gaming Group Inc $0.01, Brookfield Asset Management Inc $0.18, Industrial Alliance Insurance & Financial Services Inc $1.09, Emera Inc $0.73, Leon's Furniture Ltd $0.09, Quebecor Inc $0.59, Home Capital Group Inc $0.99, Boardwalk Real Estate Investment Trust $0.58, Stantec Inc $0.44, CI Financial Corp $0.52, Westport Fuel Systems Inc -$0.15, Diversified Royalty Corp $0.03, Algonquin Power & Utilities Corp $0.26, DH Corp $0.42, Electrovaya Inc -$0.03, Canadian Energy Services & Technology Corp $0.02, Fortress Paper Ltd -$0.08, Alterra Power Corp -$0.07, NorthWest Healthcare Properties Real Estate Investment Trust $0.23, Sphere 3D Corp -$0.09, Automotive Properties Real Estate Investment Trust $0.25, Spin Master Corp $0.17, ECN Capital Corp $0.06, Bonterra Energy Corp $0.08, Merus Labs International Inc -$0.01, Canacol Energy Ltd $0.04, Africa Oil Corp -$0.01, Surge Energy Inc $0.01, Aurinia Pharmaceuticals Inc -$0.12, Medicure Inc $0.18, Tamarack Valley Energy Ltd $0.01, Pine Cliff Energy Ltd -$0.02, Bird Construction Inc $0.06
- 3. Before the Open May 11, 2017 Page 3 Weekly U.S. Economic Calendar - May 08 to May 12, 2017 Date/Time Event Period Consensus Actual Prior 05/09/2017 06:00 NFIB Small Business Optimism Apr 104 104.5 104.7 05/09/2017 10:00 JOLTS Job Openings Mar 5738 5682 5743 05/09/2017 10:00 Wholesale Inventories MoM Mar F -0.10% -0.10% -0.10% 05/09/2017 10:00 Wholesale Trade Sales MoM Mar -- 0.70% 0.60% 05/10/2017 07:00 MBA Mortgage Applications 5-May -- -0.10% -0.10% 05/10/2017 08:30 Import Price Index MoM Apr 0.20% 0.10% -0.20% 05/10/2017 08:30 Import Price Index ex Petroleum MoM Apr 0.20% 0.10% 0.20% 05/10/2017 08:30 Import Price Index YoY Apr 3.60% 4.30% 4.20% 05/10/2017 08:30 Export Price Index MoM Apr 0.20% 0.10% 0.20% 05/10/2017 08:30 Export Price Index YoY Apr -- 3.40% 3.60% 05/11/2017 08:30 PPI Ex Food and Energy YoY Apr 1.60% 1.90% 1.60% 05/11/2017 08:30 PPI Ex Food, Energy, Trade YoY Apr -- 2.10% 1.70% 05/11/2017 08:30 Initial Jobless Claims 6-May 245k 236k 238k 05/11/2017 08:30 Continuing Claims 29-Apr 1978k 1918k 1964k 05/12/2017 08:30 CPI MoM Apr 0.20% -- -0.30% 05/12/2017 08:30 CPI Ex Food and Energy MoM Apr 0.20% -- -0.10% 05/12/2017 08:30 CPI YoY Apr 2.30% -- 2.40% 05/12/2017 08:30 CPI Ex Food and Energy YoY Apr 2.00% -- 2.00% 05/12/2017 08:30 CPI Core Index SA Apr -- -- 250.993 05/12/2017 08:30 CPI Index NSA Apr 244.599 -- 243.801 05/12/2017 08:30 Real Avg Weekly Earnings YoY Apr -- -- -0.10% 05/12/2017 08:30 Real Avg Hourly Earning YoY Apr -- -- 0.60% 05/12/2017 08:30 Retail Sales Advance MoM Apr 0.60% -- -0.20% 05/12/2017 08:30 Retail Sales Ex Auto MoM Apr 0.50% -- 0.00% 05/12/2017 08:30 Retail Sales Ex Auto and Gas Apr 0.40% -- 0.10% 05/12/2017 08:30 Retail Sales Control Group Apr 0.40% -- 0.50% S&P 500 Daily Performance 1950 2050 2150 2250 2350 2450 May-16 Jul-16 Sep-16 Nov-16 Jan-17 Mar-17 May-17 Leaders - Prior Session Company Ticker % Change NVIDIA Corp NVDA-US 17.83 Electronic Arts Inc EA-US 12.65 Coty Inc COTY-US 11.89 Advanced Micro Devices Inc AMD-US 5.99 Cabot Oil & Gas Corp COG-US 4.45 Laggards - Prior Session Company Ticker % Change TEGNA Inc TGNA-US -6.75 Priceline Group Inc/The PCLN-US -4.52 Allergan PLC AGN-US -3.69 Viacom Inc VIAB-US -3.53 Alexion Pharmaceuticals Inc ALXN-US -3.01 U.S. Equity Upgrades Synovus Raised to Buy at BofAML U.S. Equity Downgrades Conoco Cut to Neutral at BofAML GrainCorp Downgraded to Neutral at Macquaire Today's Earnings – U.S. Macy's Inc $0.35, Laureate Education Inc -$0.95, Kohl's Corp $0.29, Nordstrom Inc $0.28, Avexis Inc -$0.95, Ichor Holdings Ltd $0.57
- 4. Before the Open May 11, 2017 Page 4 Appendix A - Important Information General Research Disclaimer The statements and statistics contained herein are based on material believed to be reliable, but are not guaranteed to be accurate or complete. This report is for informational purposes only and is not an offer or solicitation with respect to the purchase or sale of any investment fund, security or other product. Particular investment, trading, or tax strategies should be evaluated relative to each individual’s objectives. Graphs and charts are used for illustrative purposes only and do not reflect future values or future performance. This document does not provide individual financial, legal, investment or tax advice. Please consult your own legal, investment and tax advisor. All opinions and other information in this document are subject to change without notice. The Toronto-Dominion Bank and its affiliates and related entities are not liable for any errors or omissions in the information or for any loss or damage suffered. TD Waterhouse Canada Inc. and/or its affiliated persons or companies may hold a position in the securities mentioned, including options, futures and other derivative instruments thereon, and may, as principal or agent, buy or sell such securities. Affiliated persons or companies may also make a market in and participate in an underwriting of such securities. Full disclosures for all companies covered by TD Securities Inc. can be viewed at https://www.tdsresearch.com/equities/welcome.important.disclosure.action Research Ratings Action List BUY: The stock’s total return is expected to exceed a minimum of 15%, on a risk-adjusted basis, over the next 12 months and it is a top pick in the Analyst’s sector. BUY: The stock’s total return is expected to exceed a minimum of 15%, on a risk-adjusted basis, over the next 12 months. SPECULATIVE BUY: The stock’s total return is expected to exceed 30% over the next 12 months; however, there is material event risk associated with the investment that could result in significant loss. HOLD: The stock’s total return is expected to be between 0% and 15%, on a risk-adjusted basis, over the next 12 months. TENDER: Investors are advised to tender their shares to a specific offer for the company’s securities. REDUCE: The stock’s total return is expected to be negative over the next 12 months. Technical Research Disclaimer The opinions expressed herein reflect a technical perspective and may differ from fundamental research on these issuers. Fundamental research can be obtained through your TD Wealth advisor or on the Markets and Research site within WebBroker. The technical research opinions contained in this report are based on historical technical data and expectations of the most likely direction of a market or security. No guarantee of that outcome is ever implied. Research Report Dissemination Policy TD Waterhouse Canada Inc. makes its research products available in electronic format. These research products are posted to our proprietary websites for all eligible clients to access by password and we distribute the information to our sales personnel who then may distribute it to their retail clients under the appropriate circumstances either by email, fax or regular mail. No recipient may pass on to any other person, or reproduce by any means, the information contained in this report without our prior written consent. Analyst Certification The Portfolio Advice and Investment Research analyst(s) responsible for this report hereby certify that (i) the recommendations and technical opinions expressed in the research report accurately reflect the personal views of the analyst(s) about any and all of the securities or issuers discussed herein, and (ii) no part of the research analyst’s compensation was, is, or will be, directly or indirectly, related to the provision of specific recommendations or views expressed by the research analyst in the research report. Conflicts of Interest The Portfolio Advice & Investment Research analyst(s) responsible for this report may own securities of the issuer(s) discussed in this report. As with most other employees, the analyst(s) who prepared this report are compensated based upon (among other factors) the overall profitability of TD Waterhouse Canada Inc. and its affiliates, which includes the overall profitability of investment banking services, however TD Waterhouse Canada Inc. does not compensate its analysts based on specific investment banking transactions.
- 5. Before the Open May 11, 2017 Page 5 Corporate Disclosure TD Wealth represents the products and services offered by TD Waterhouse Canada Inc. (Member – Canadian Investor Protection Fund), TD Waterhouse Private Investment Counsel Inc., TD Wealth Private Banking (offered by The Toronto-Dominion Bank) and TD Wealth Private Trust (offered by The Canada Trust Company). The Portfolio Advice and Investment Research team is part of TD Waterhouse Canada Inc., a subsidiary of The Toronto-Dominion Bank. Trade-mark Disclosures Bloomberg and Bloomberg.com are trademarks and service marks of Bloomberg Finance L.P., a Delaware limited partnership, or its subsidiaries. All rights reserved. “TD Securities” is the trade name which TD Securities Inc. and TD Securities (USA) LLC. jointly use to market their institutional equity services. TD Securities is a trade-mark of The Toronto-Dominion Bank representing TD Securities Inc., TD Securities (USA) LLC, TD Securities Limited and certain corporate and investment banking activities of The Toronto-Dominion Bank. All trademarks are the property of their respective owners. ® The TD logo and other trade-marks are the property of The Toronto-Dominion Bank. FTSE TMX Global Debt Capital Markets Inc. 2016 "FTSE®" is a trade mark of FTSE International Ltd and is used under licence. "TMX” is a trade mark of TSX Inc. and is used under licence. All rights in the FTSE TMX Global Debt Capital Markets Inc.'s indices and / or FTSE TMX Global Debt Capital Markets Inc.'s ratings vest in FTSE TMX Global Debt Capital Markets Inc. and/or its licensors. Neither FTSE TMX Global Debt Capital Markets Inc. nor its licensors accept any liability for any errors or omissions in such indices and / or ratings or underlying data. No further distribution of FTSE TMX Global Debt Capital Markets Inc.'s data is permitted without FTSE TMX Global Debt Capital Markets Inc.'s express written consent.