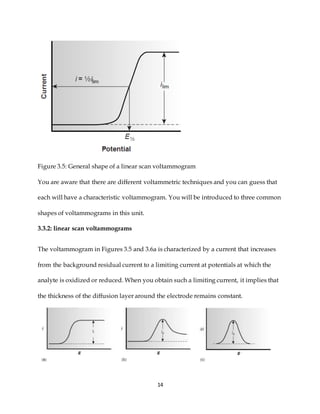
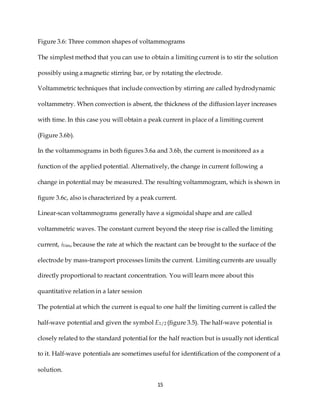
This document discusses voltammetry, an electroanalytical technique used in qualitative and quantitative analytical chemistry. It introduces the basic concepts and principles of voltammetry, including instrumentation, excitation signals, types of voltammetry, and features of voltammograms. Specifically, it discusses the fundamentals of voltammetric cells, electrodes, hydrodynamic voltammetry, and common shapes of voltammograms including linear scan and peak voltammograms. The overall purpose is to explain the fundamental concepts and applications of voltammetry as an analytical technique.

![45
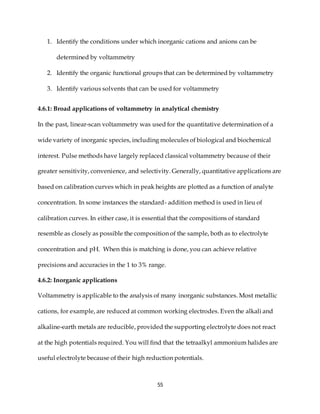
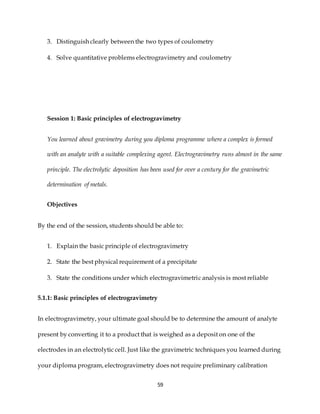
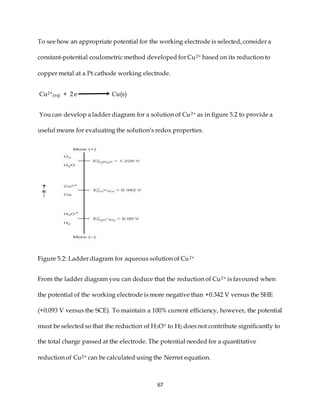
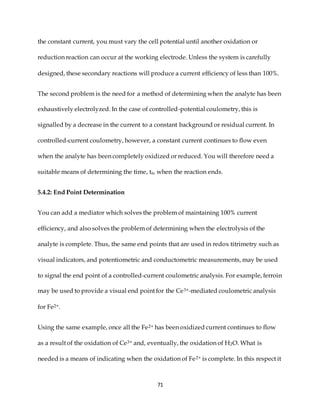
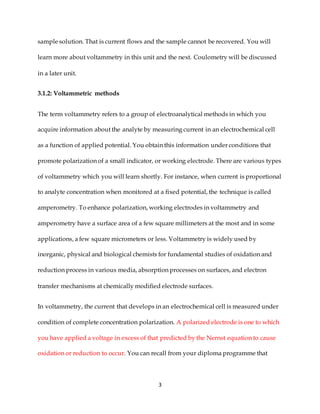
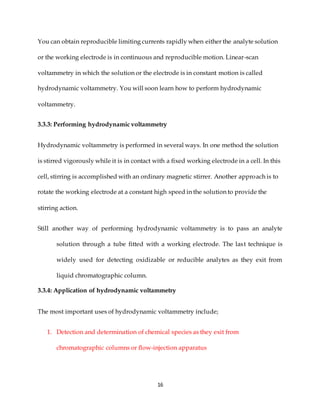
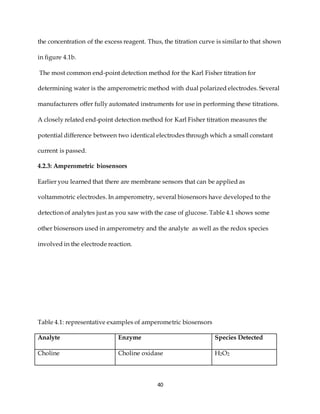
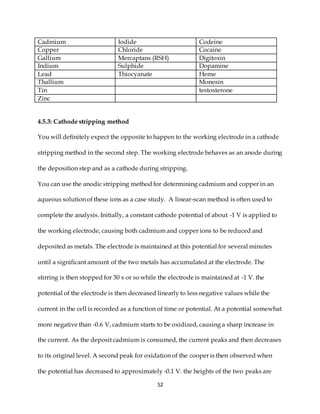
scanned toward more negative potentials at a rate of 5 mV/s. Reduction of As(III) to
As(0) occurs at a potential of approximately -0.44 V versus the SCE. The peak currents,
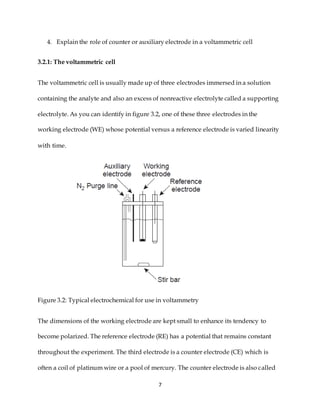
corrected for the residual current, for a set of standard solutions are shown in the
following table.
[As(III)], M ip, μA
1.00 x 10⁻⁶ 0.298
3.00 x 10⁻⁶ 0.947
6.00 x 10⁻⁶ 1.83
9.00 x 10⁻⁶ 2.72
What is the concentration of As(III) ina sample of water if the peak current under the
same conditions is 1.37 μA?
Solution
Linear regression gives the equation for the calibration curve as;
ip(μA) = 0.0176 + 3.01 x 10⁵[As(III)]
substituting the peak current into the regression equation, gives the concentration of
As(III) as 4.49 x 10⁻⁶M
Self Assessment Questions
1. The differential pulse polarographic analysis of mixtures of indium and cadmium in
0.1 M HCl is complicated by the overlap of their respective voltammograms. The peak
potential for indium is at –0.557 V, and that for cadmium occurs at a potential of –0.597
V. When a 0.800-ppm indium standard is analyzed, the peak current (in arbitrary units)](https://image.slidesharecdn.com/voltammetryforlevel800students2021-211220134704/85/Voltammetry-for-level-800-students-2021-45-320.jpg)
![54
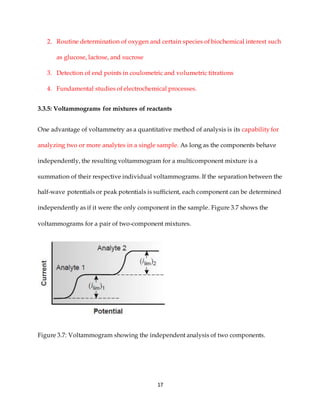
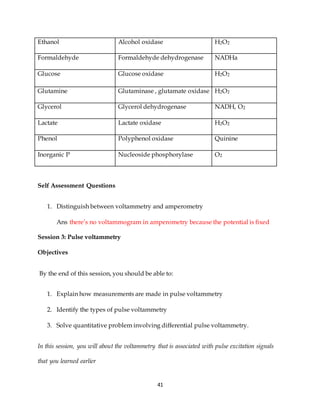
Solution
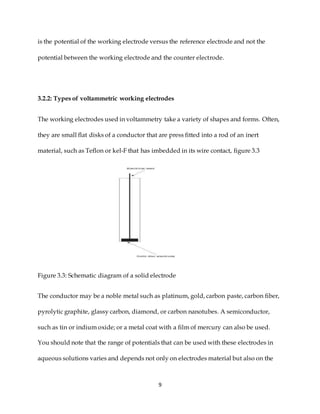
Peak currents in anodic stripping voltammetry are linear function of concentration.
Thus you write;
ip = k(ppm Cu2+), k is a constant.
You can write in this case as;
0.886 = k(ppmCu2+)
And for the standard addition;
a. = k[
0.0500 L
0.0500L+5.00 x 10⁻⁶
𝑝𝑝m𝐶𝑢2+
+
5.00 x 10⁻⁶L
0.0500L + 5.00 x 10⁻⁶L
(10.0 ppm)]
You should first solve for k, using the first equation. You will then substitute it into
the second equation and simplify.
2.52 = 0.8859 +
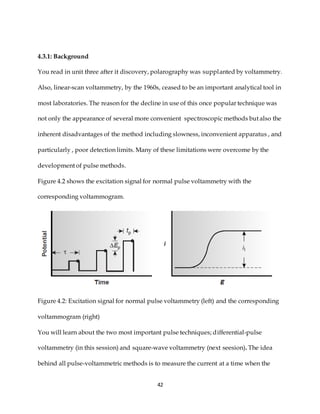
(8.859 x10⁻⁵)(10.0 ppm)
(ppmCu2+)
You now finally solve for the concentration of Cu2+ (ppmCu2+). This will give you
5.42 x 10⁻⁴ ppm = 0.542 ppb
Self Assessment Questions
1. What is the purpose of the electrodeposition step instripping analysis?
Session 6 Applications of voltammetry in analytical chemistry
In this last session of the unit four, you will learn the wide range of analytes that can determined
using voltammetry.
Objectives
By the end of this session, you should be able to:](https://image.slidesharecdn.com/voltammetryforlevel800students2021-211220134704/85/Voltammetry-for-level-800-students-2021-54-320.jpg)