Section 1 provides an introduction to esxtop, a tool for monitoring system resources like CPU, memory, disk, and network on an ESXi host. Esxtop displays statistics through interactive screens or collects data in batch mode.
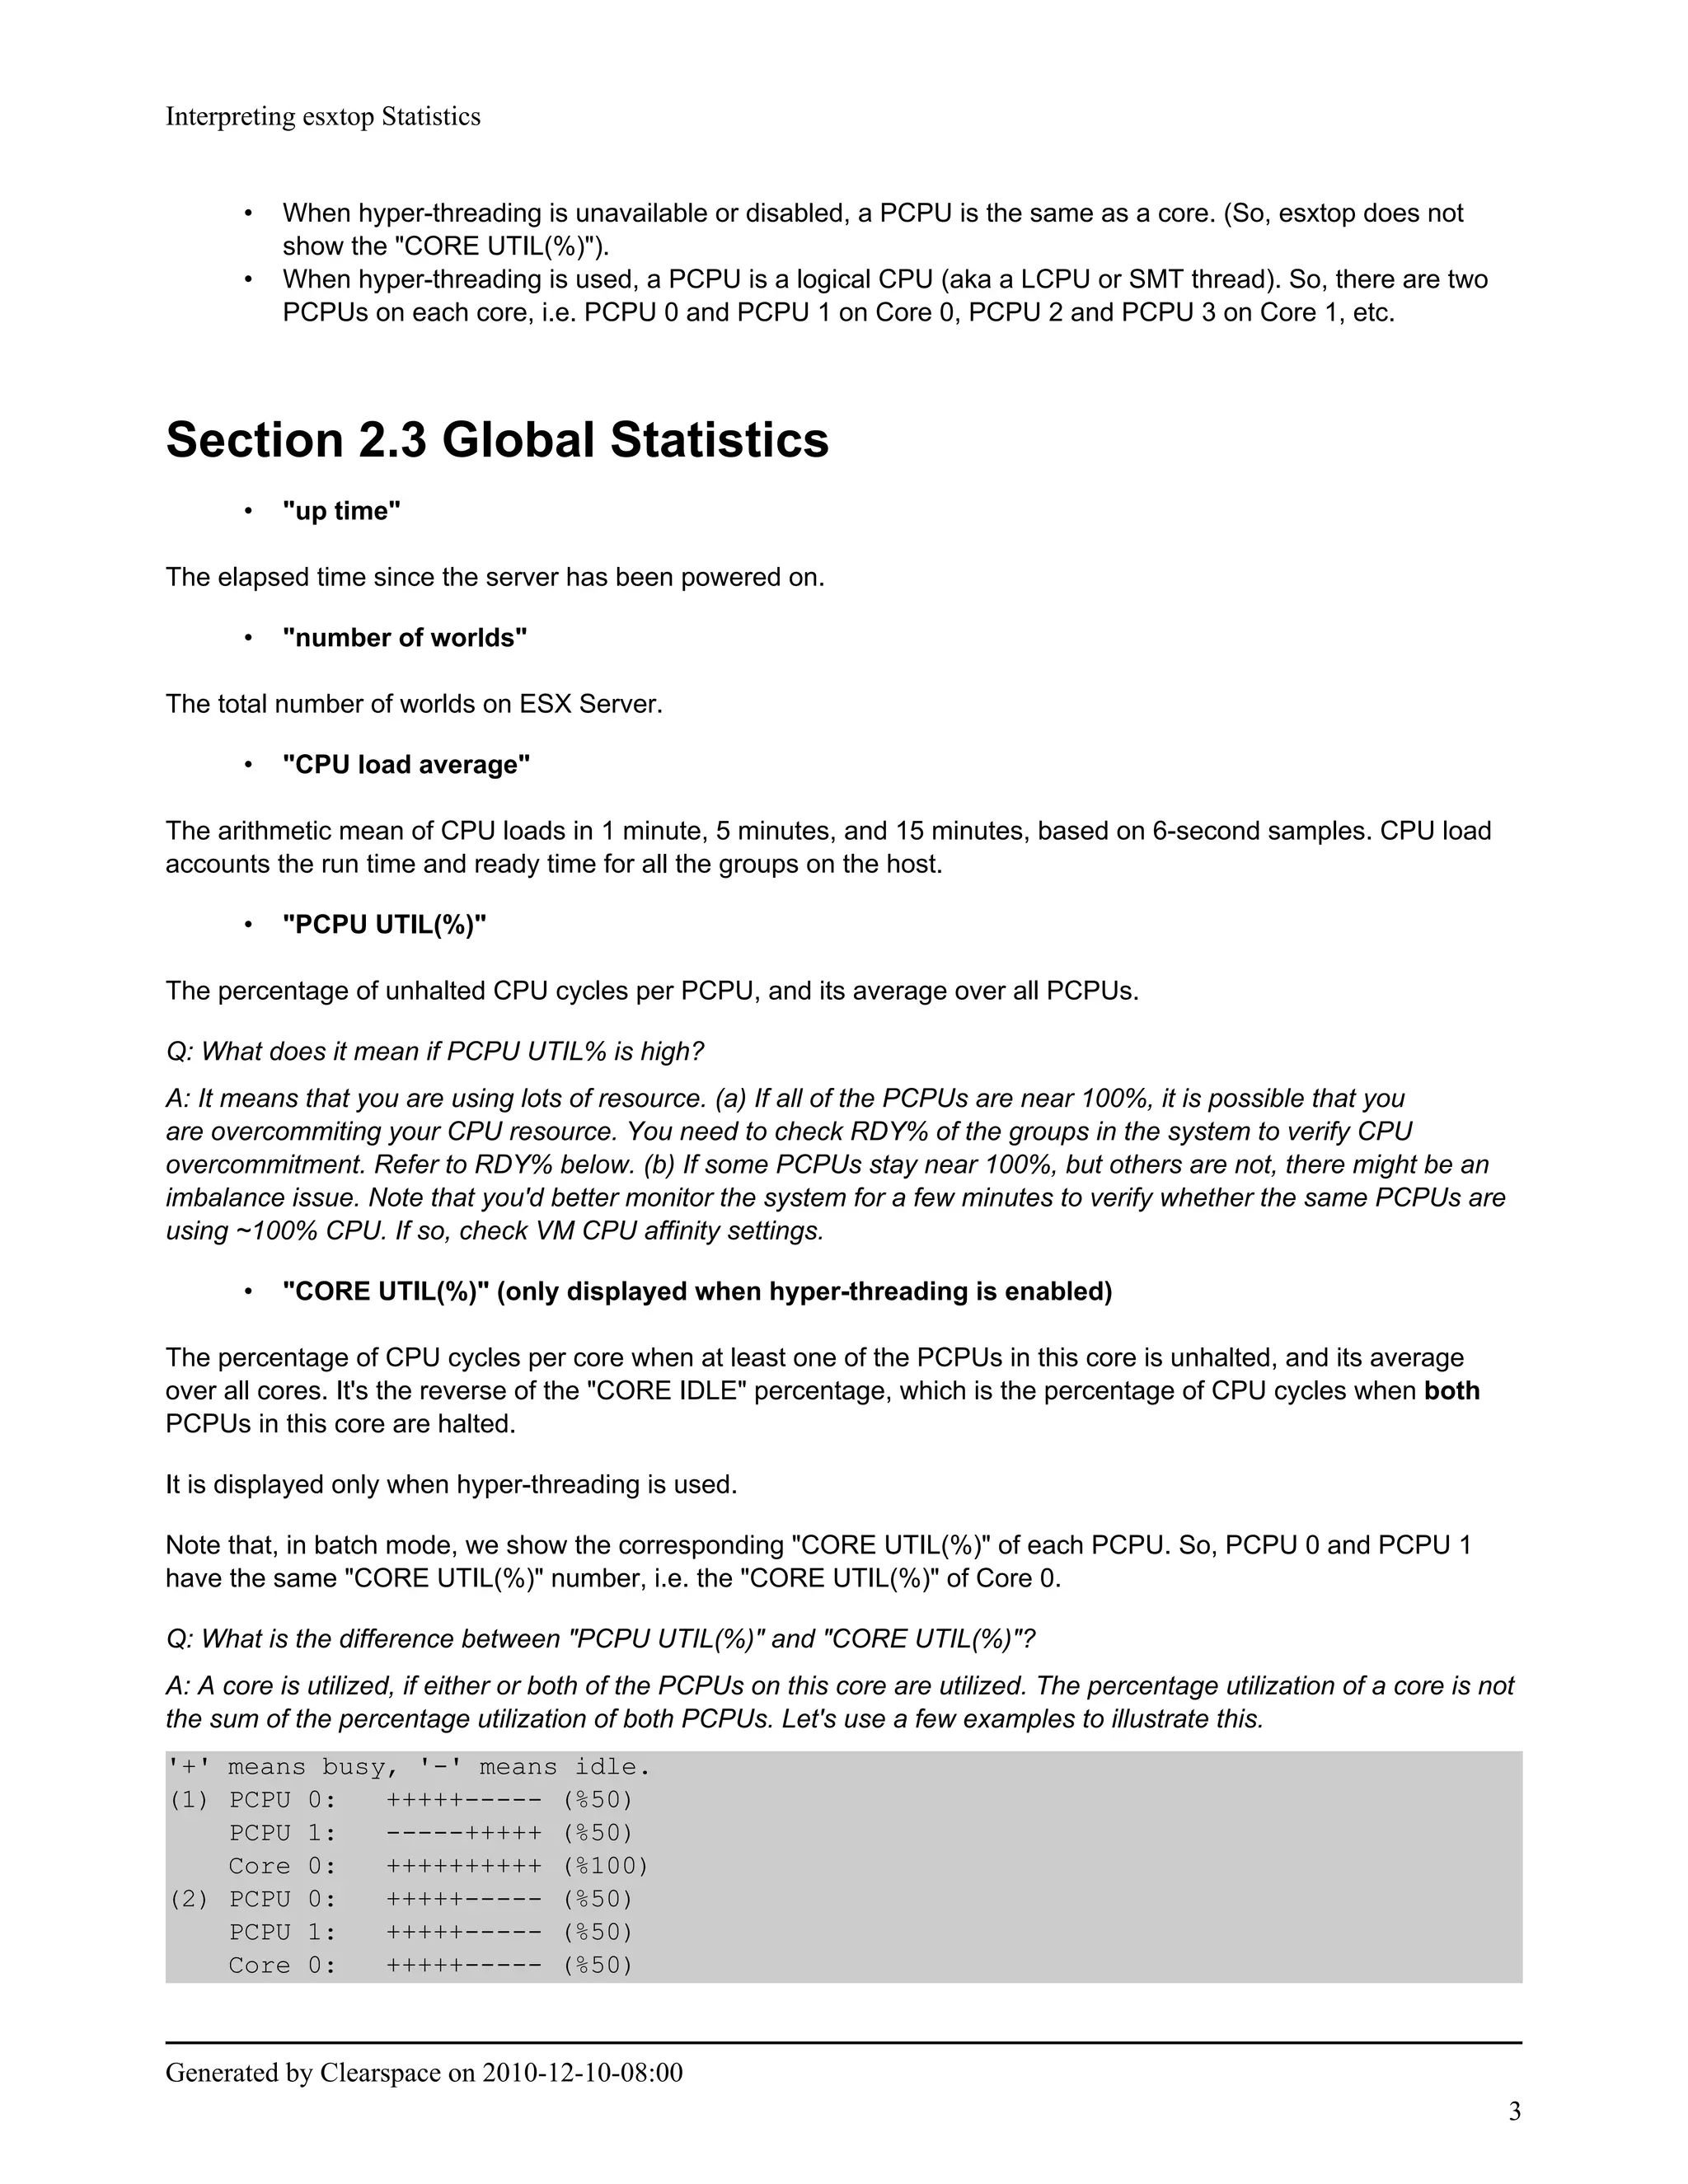
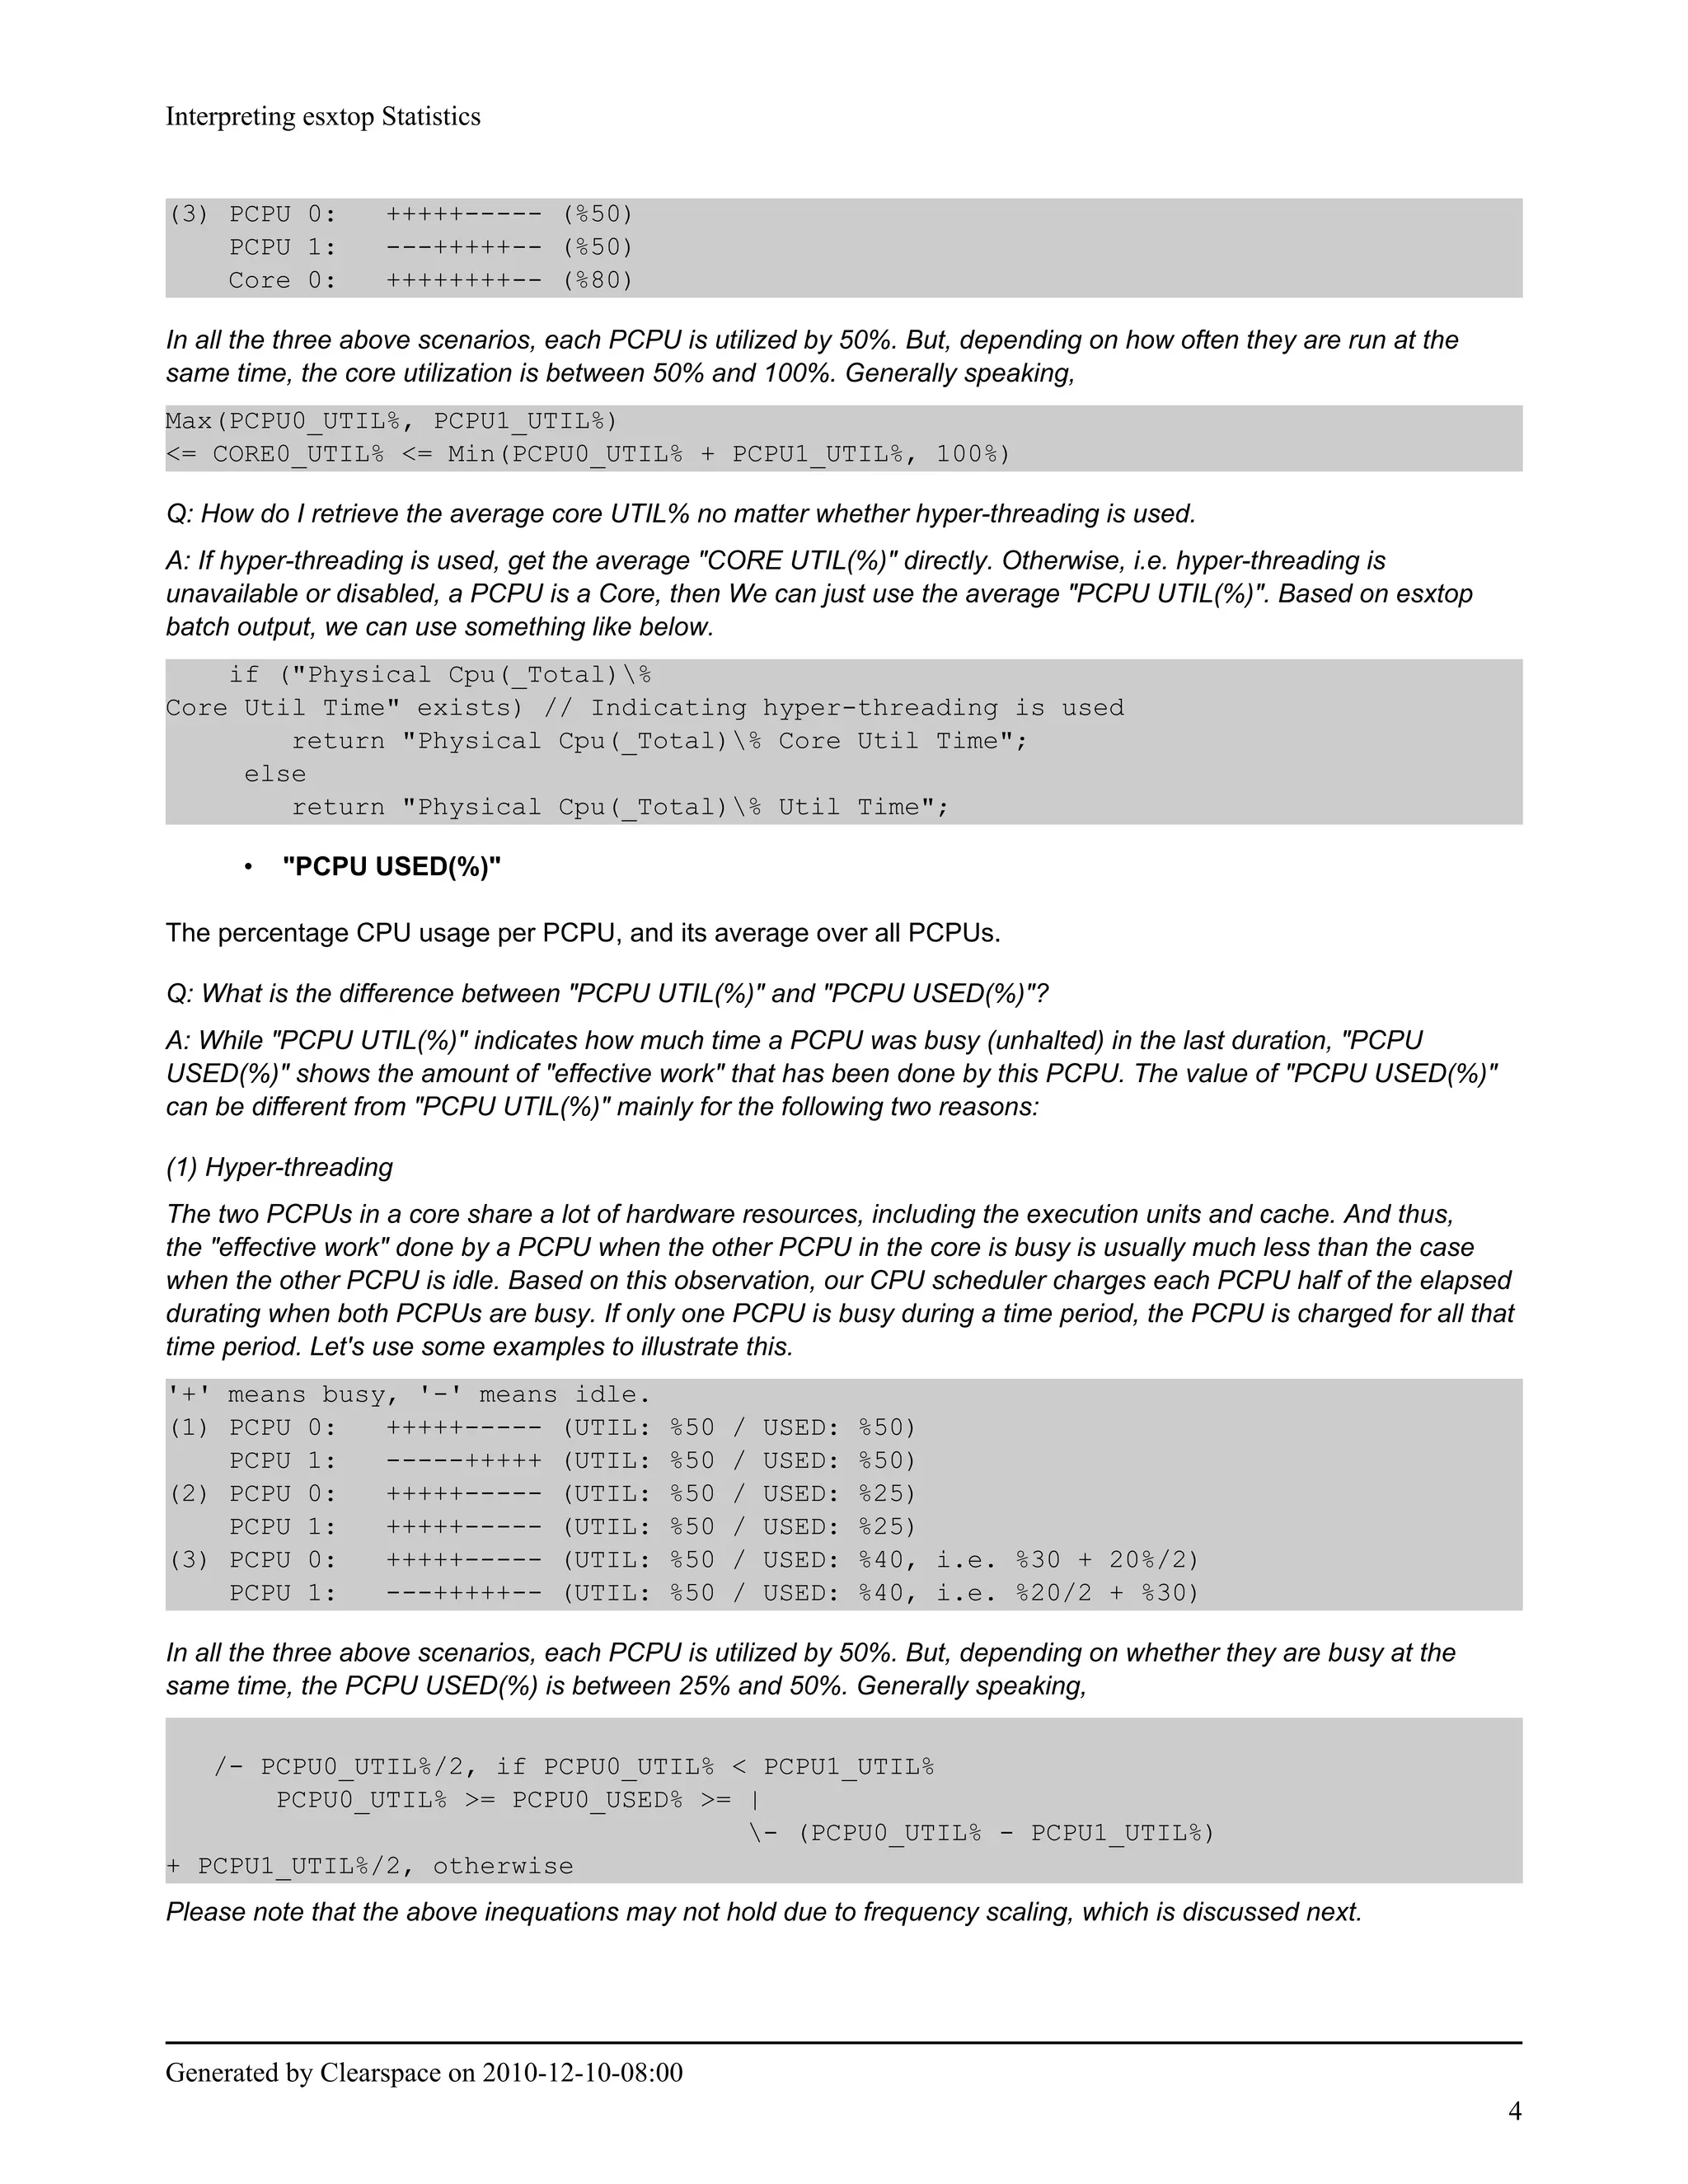
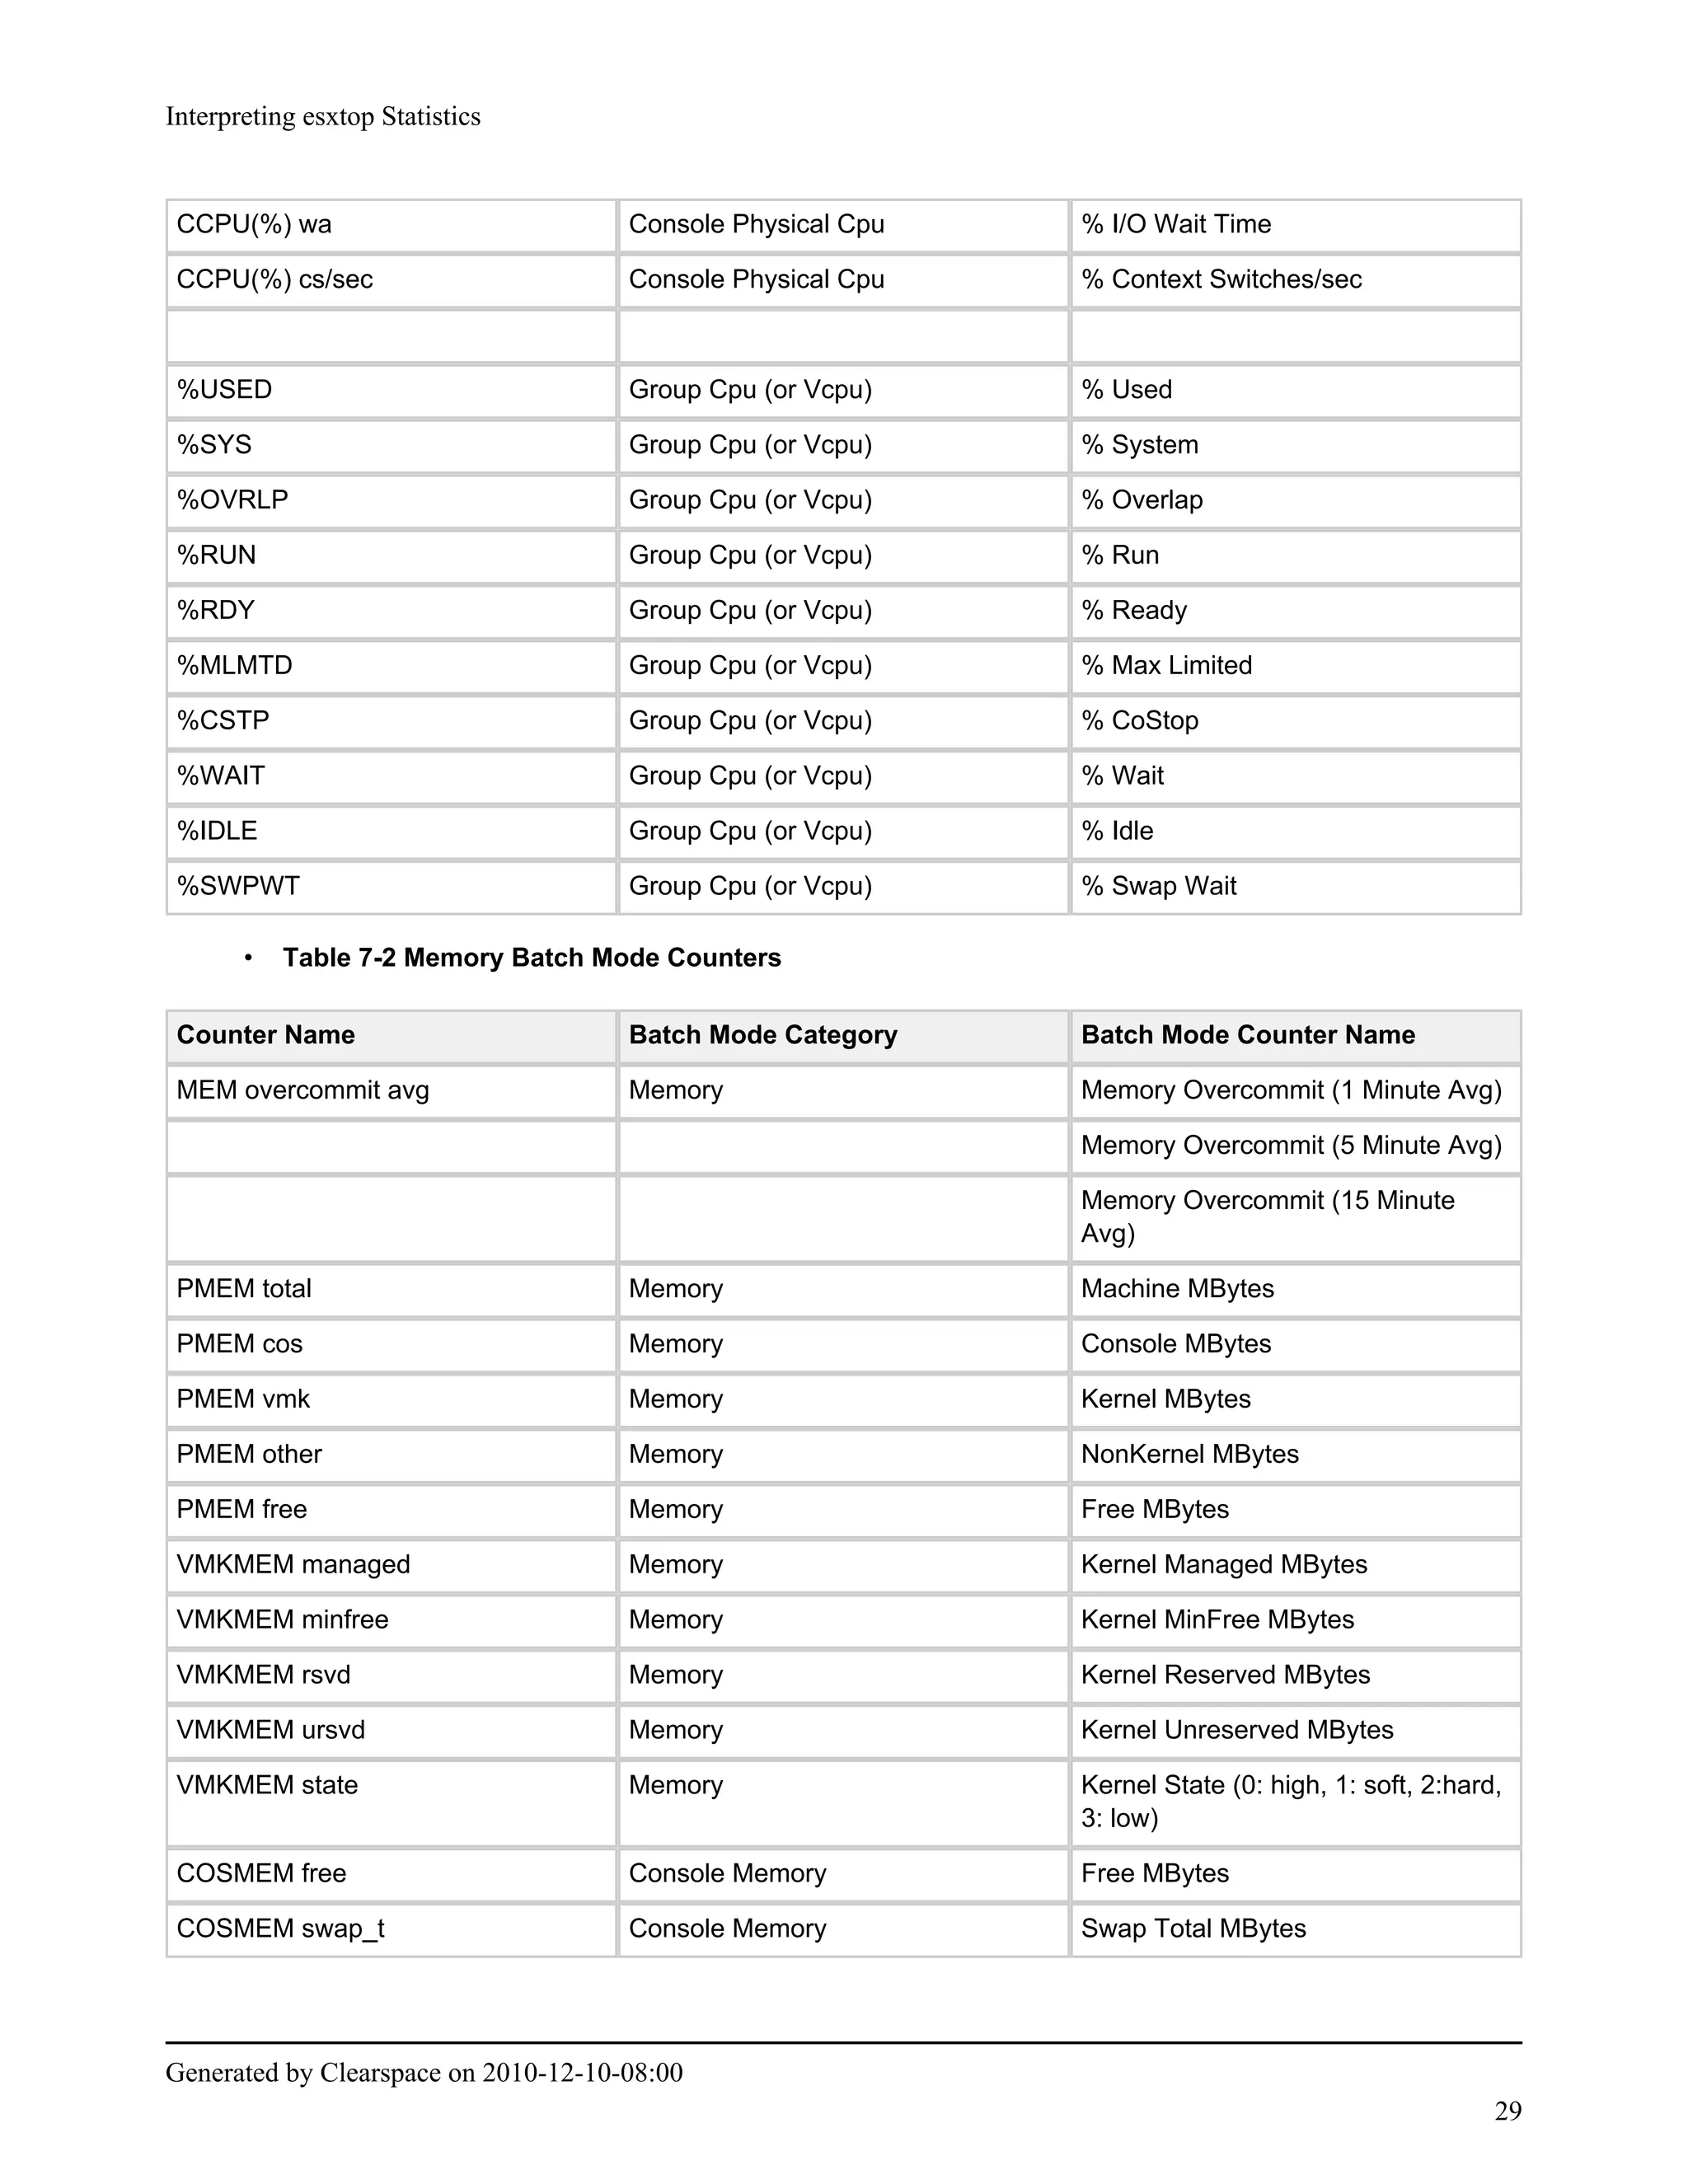
Section 2 discusses CPU statistics reported by esxtop. It describes how worlds and groups are used to represent schedulable entities. Key global CPU statistics include utilization, load averages, and used/ready percentages for physical CPUs (PCPUs) and cores. PCPU utilization indicates busy time while used indicates effective work done.
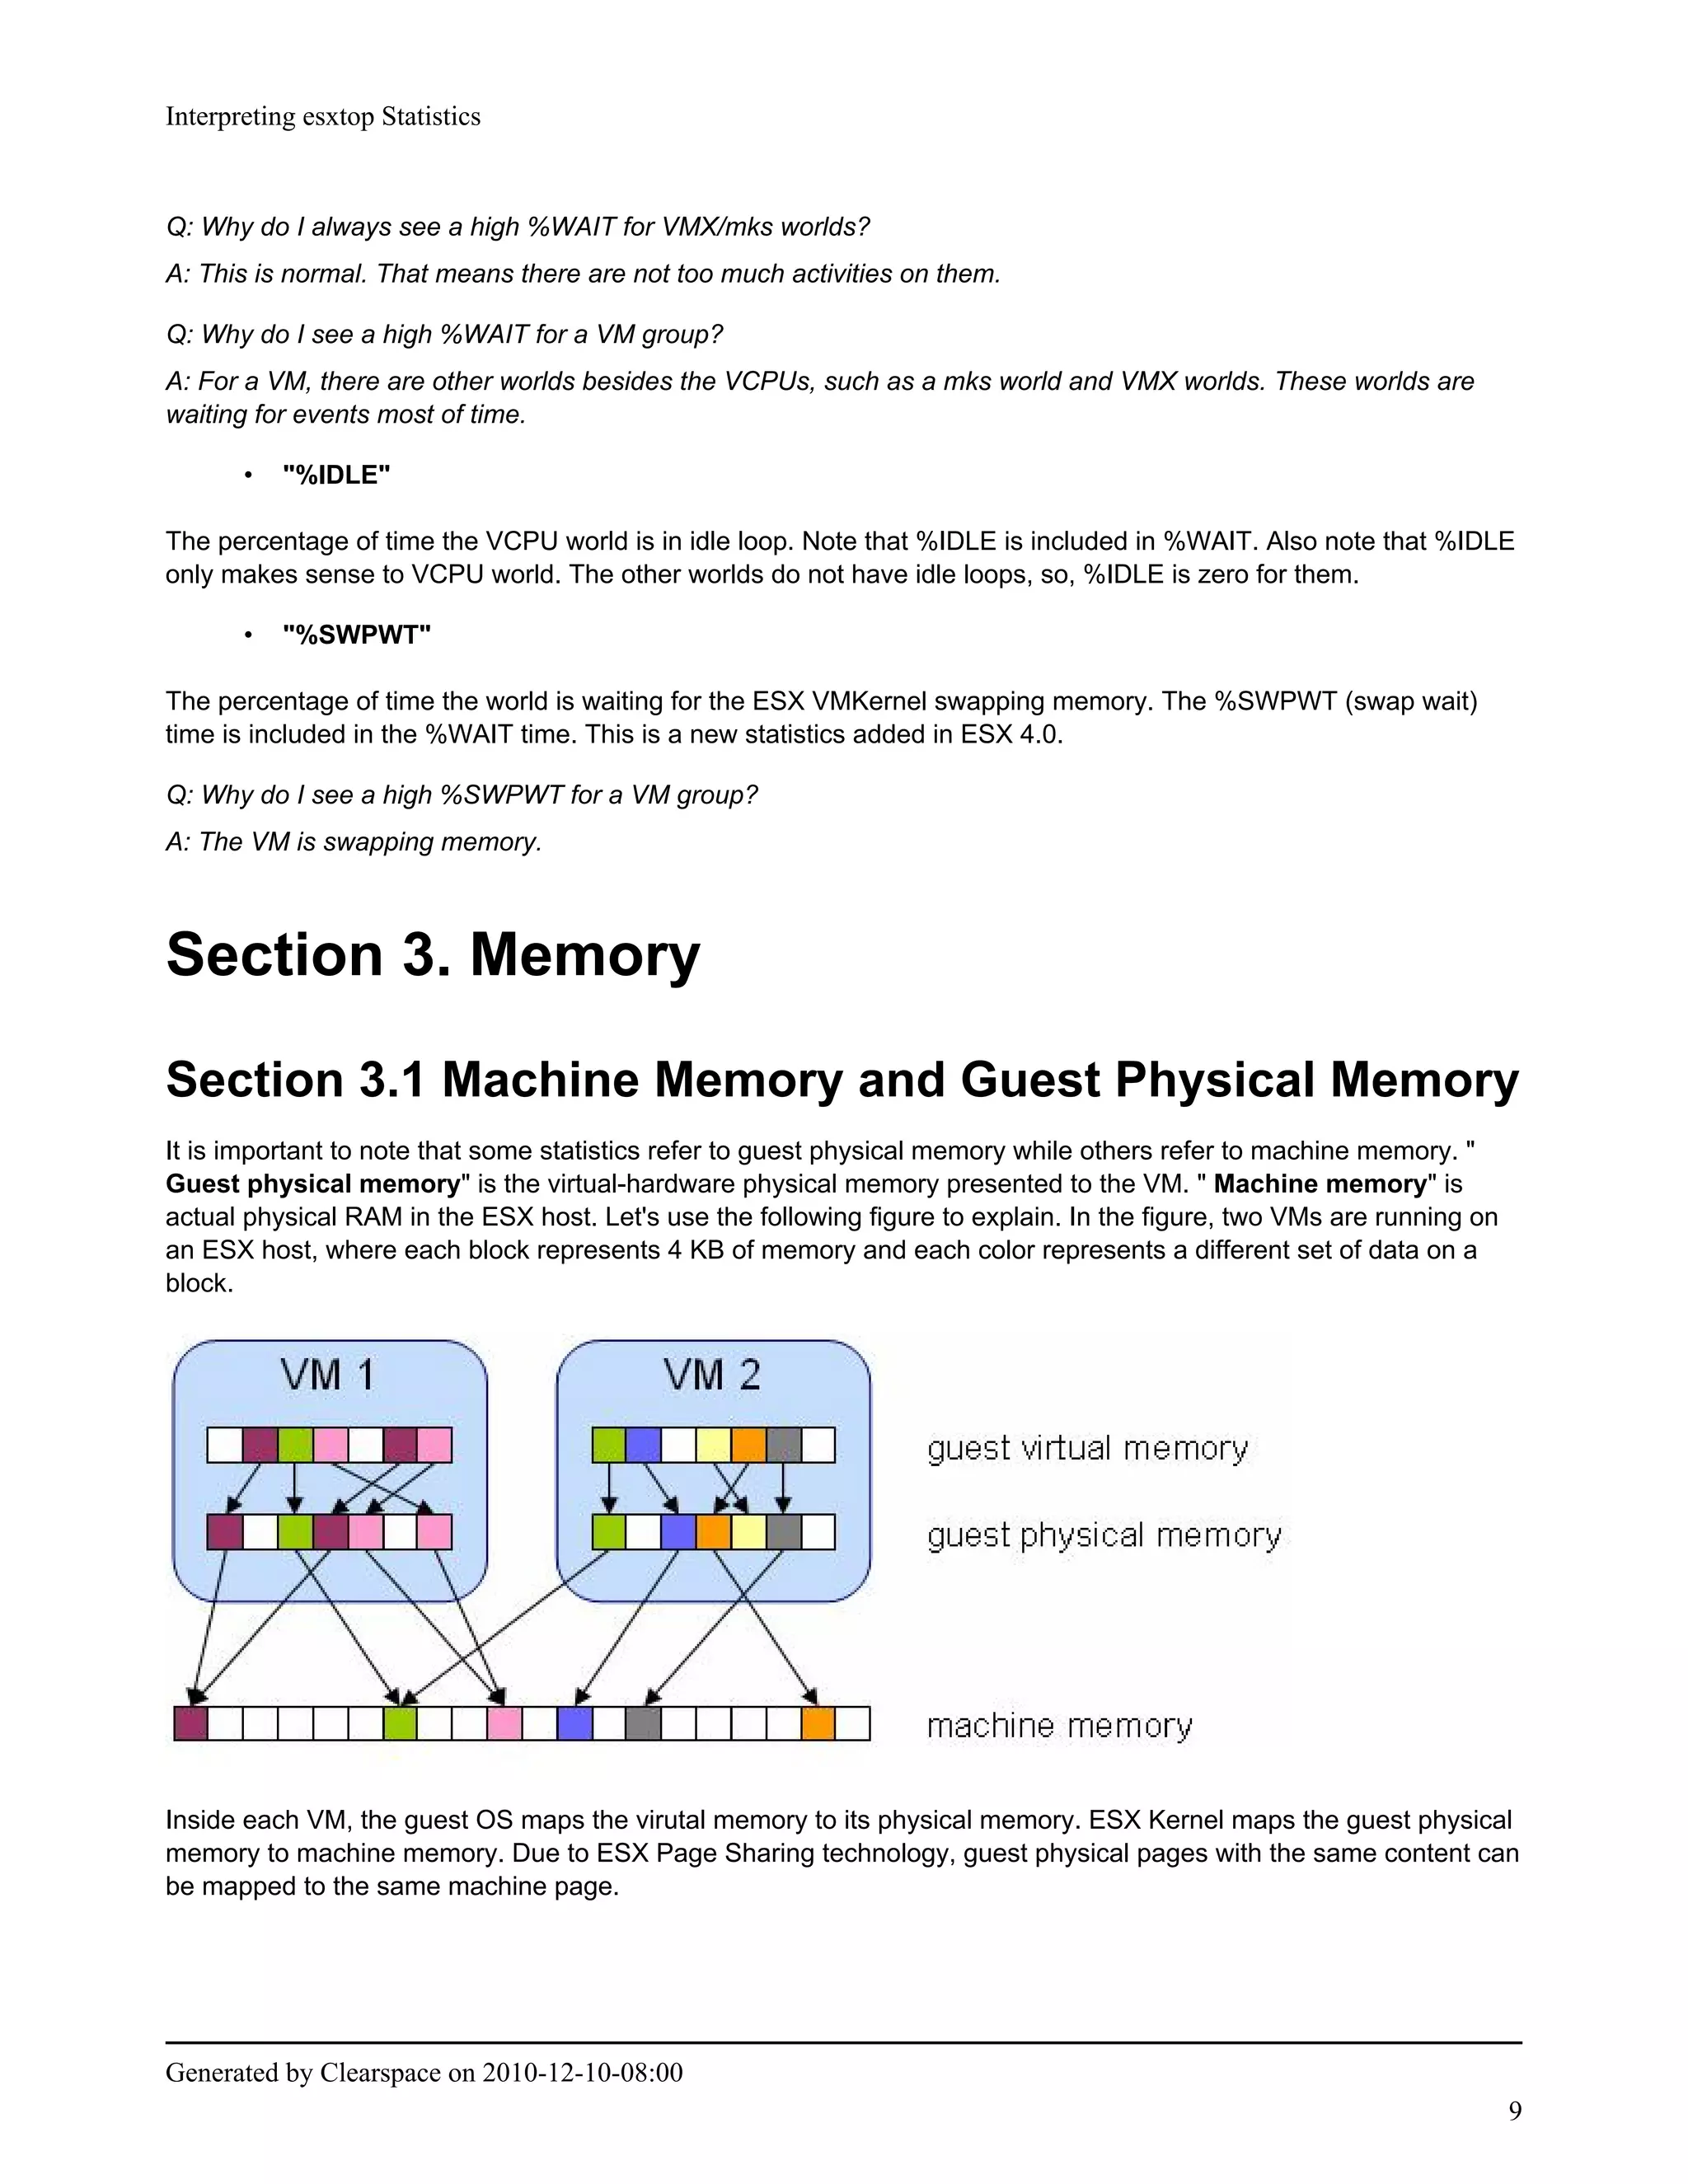
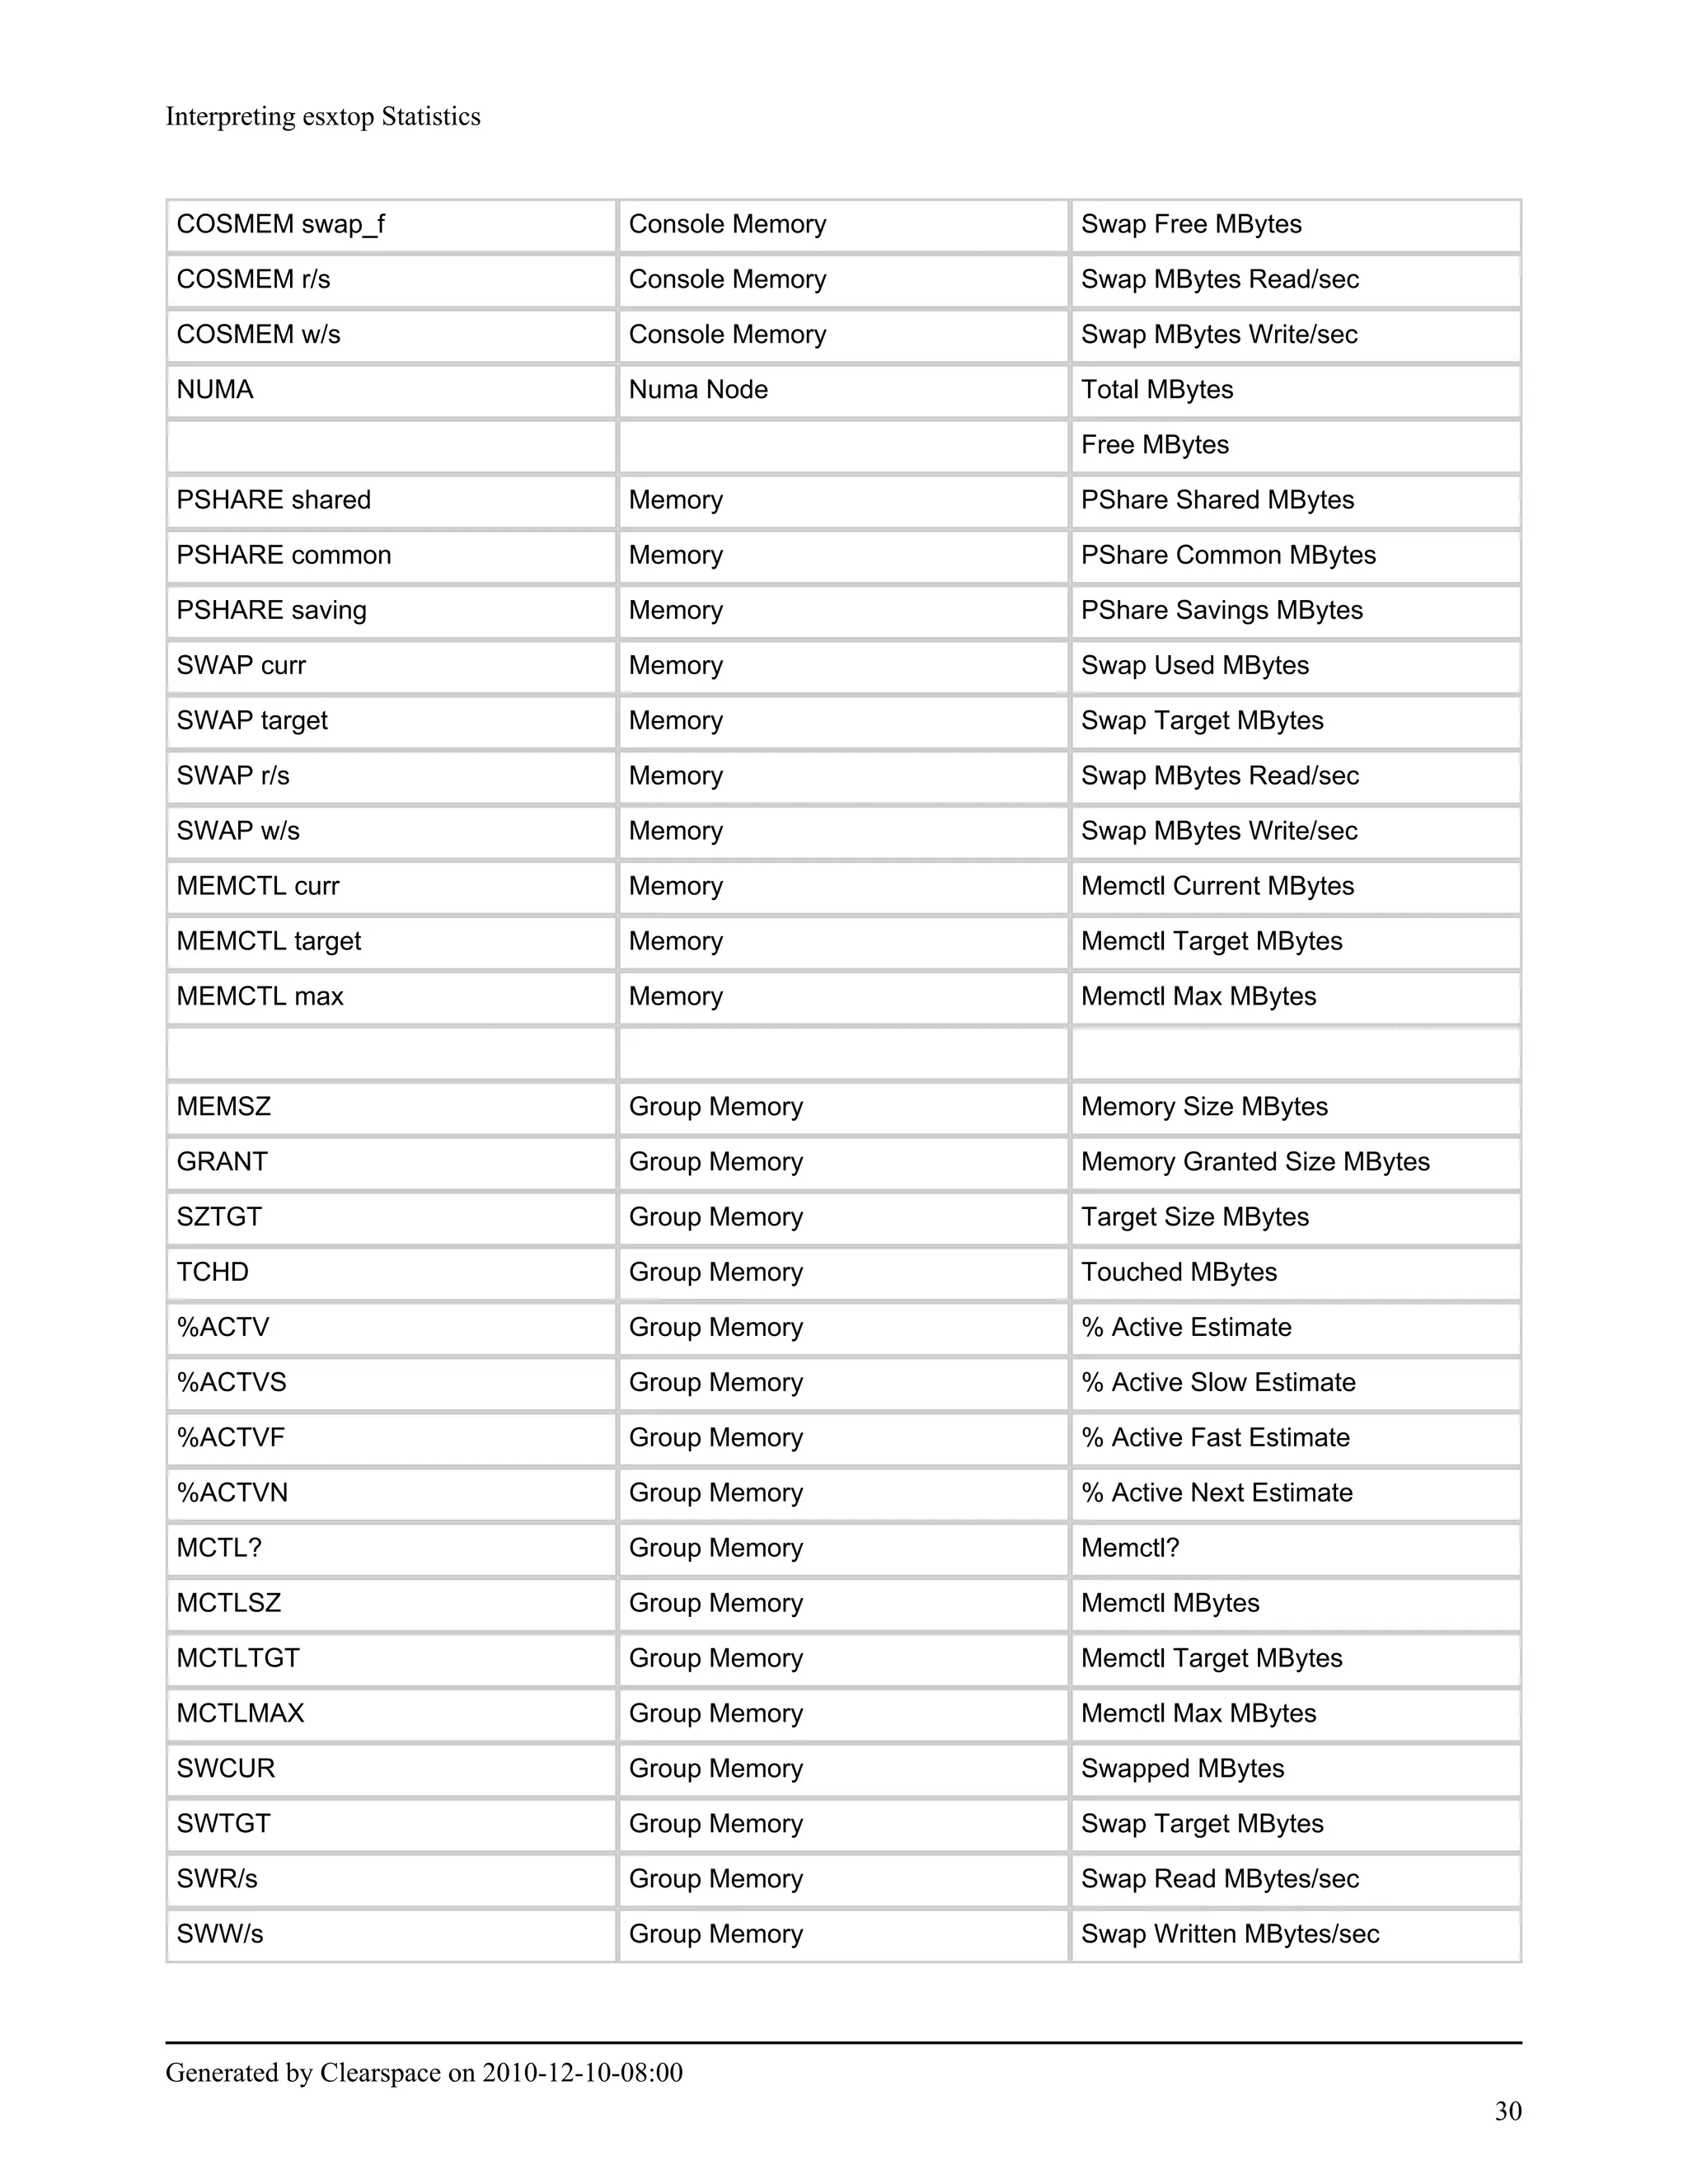
Section 3 covers memory statistics, including total memory and usage at the machine, guest, group, and global levels.
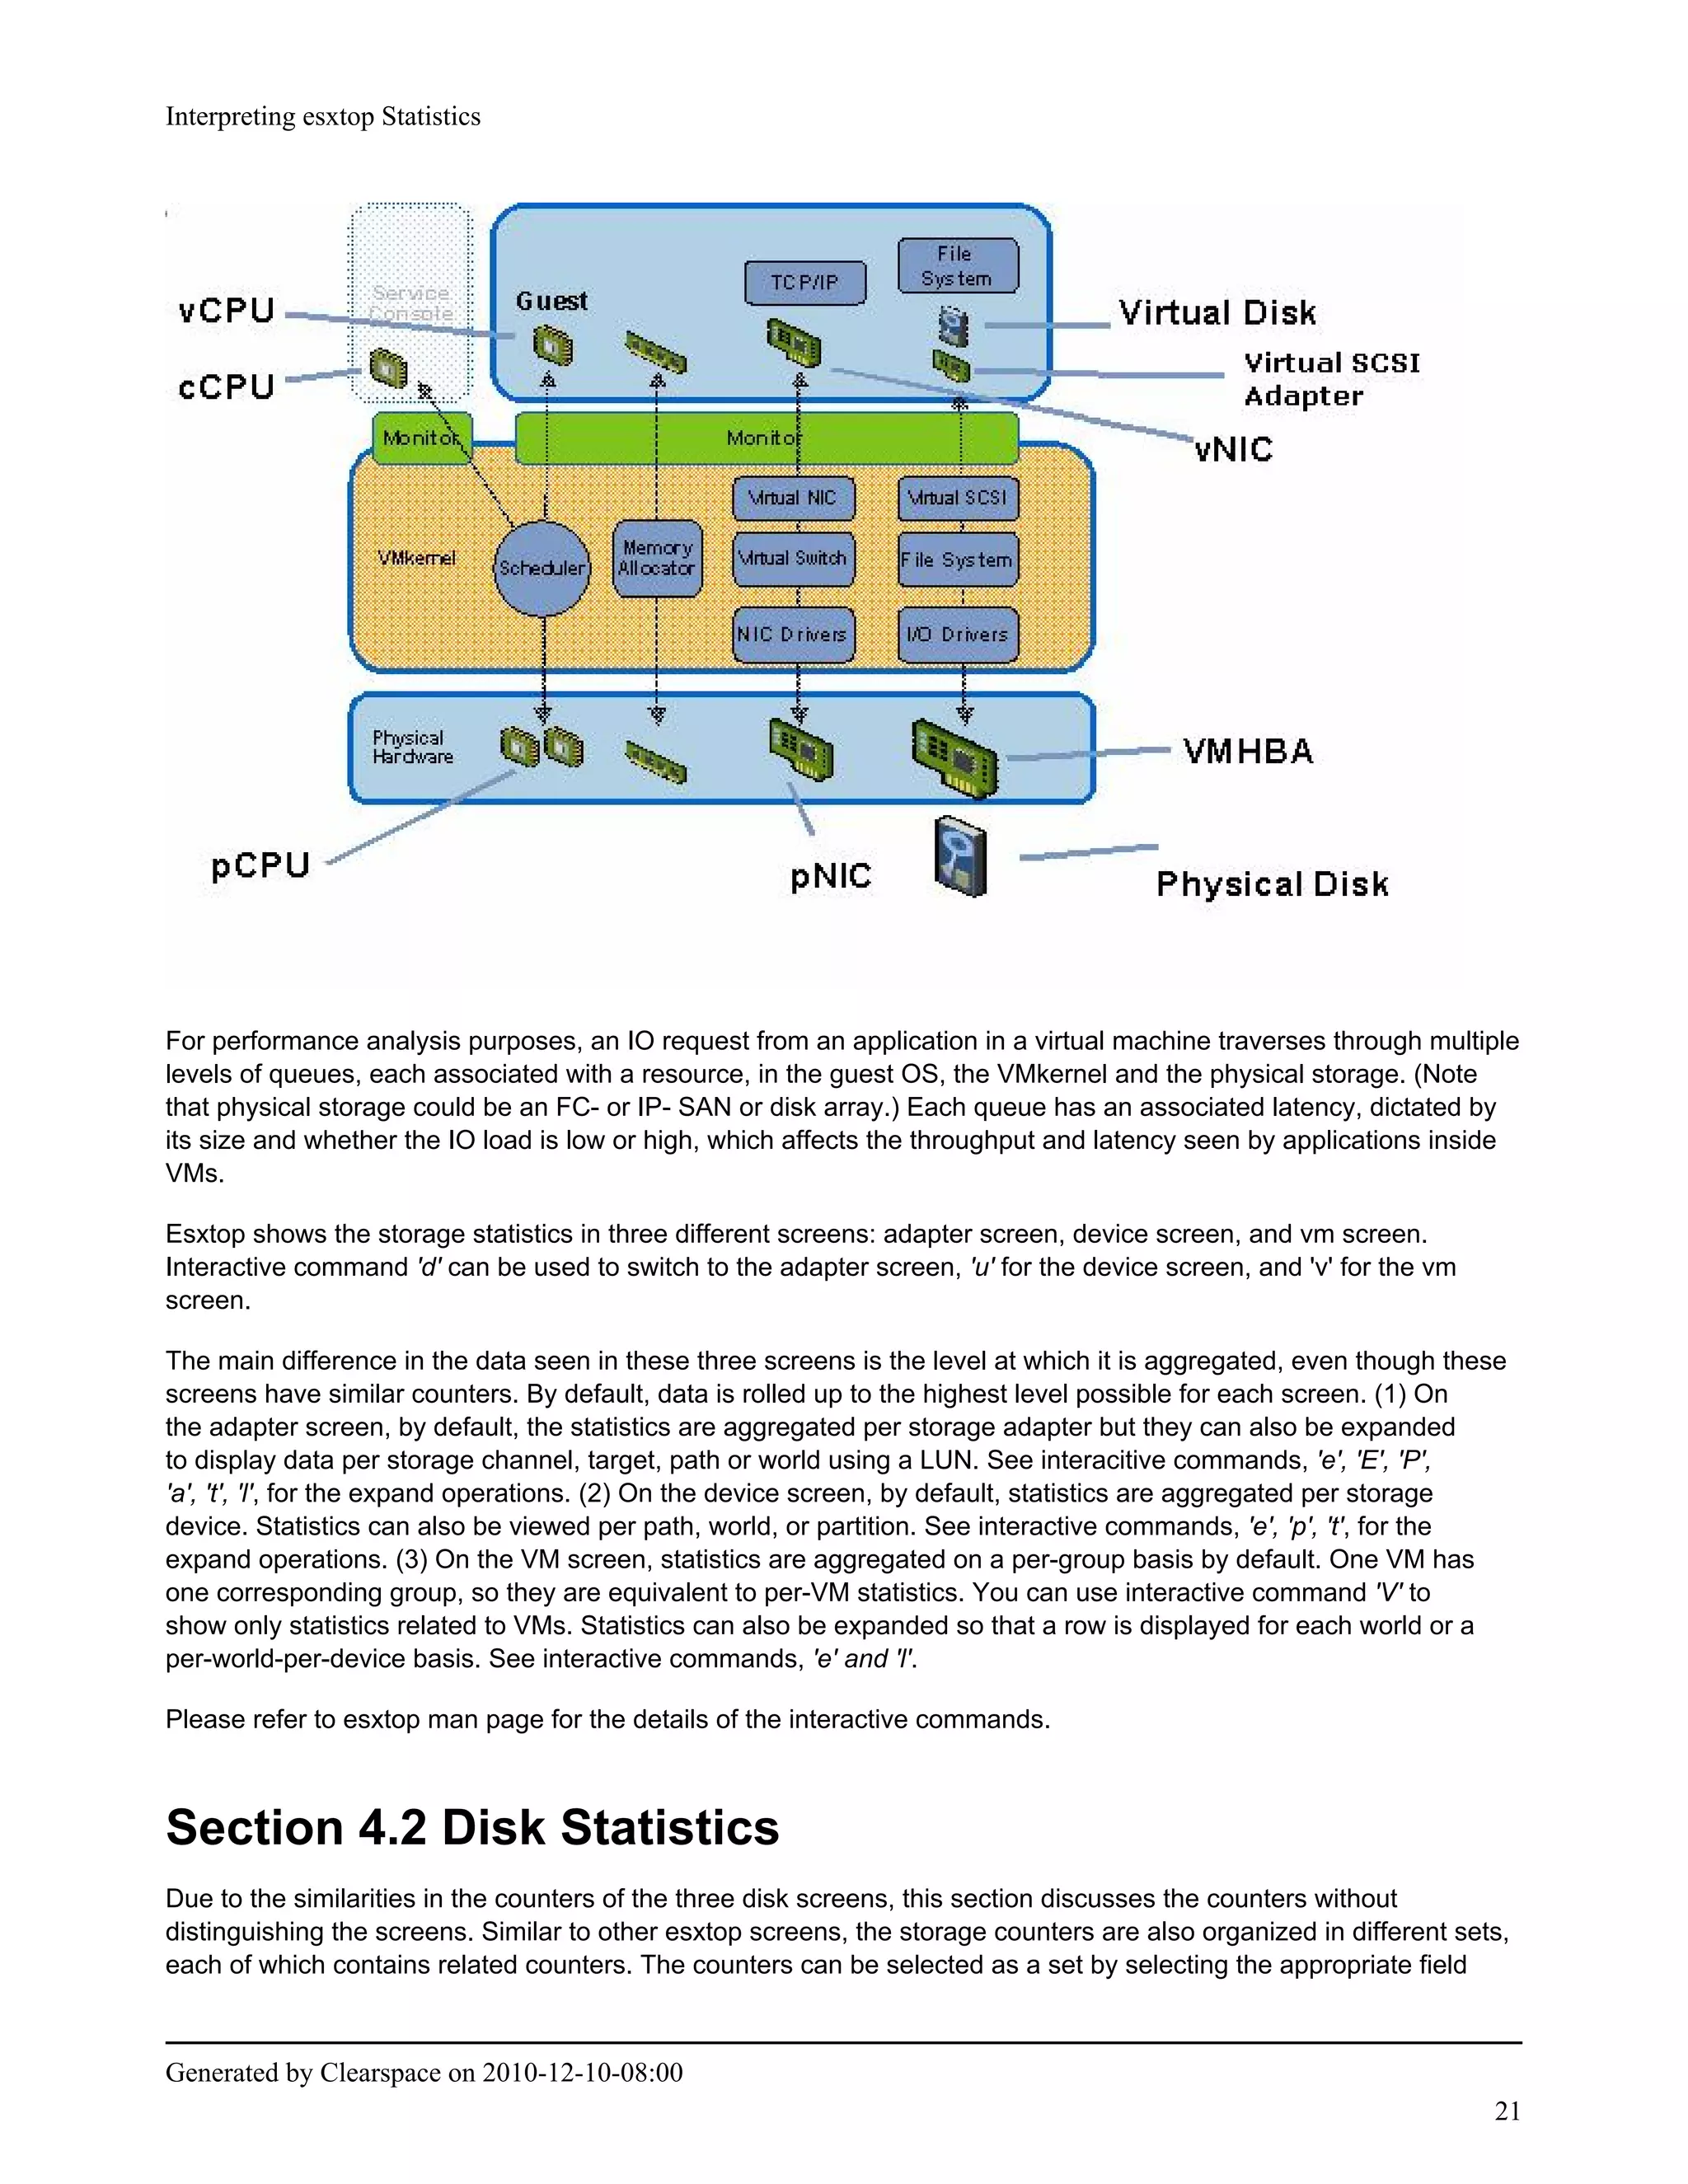
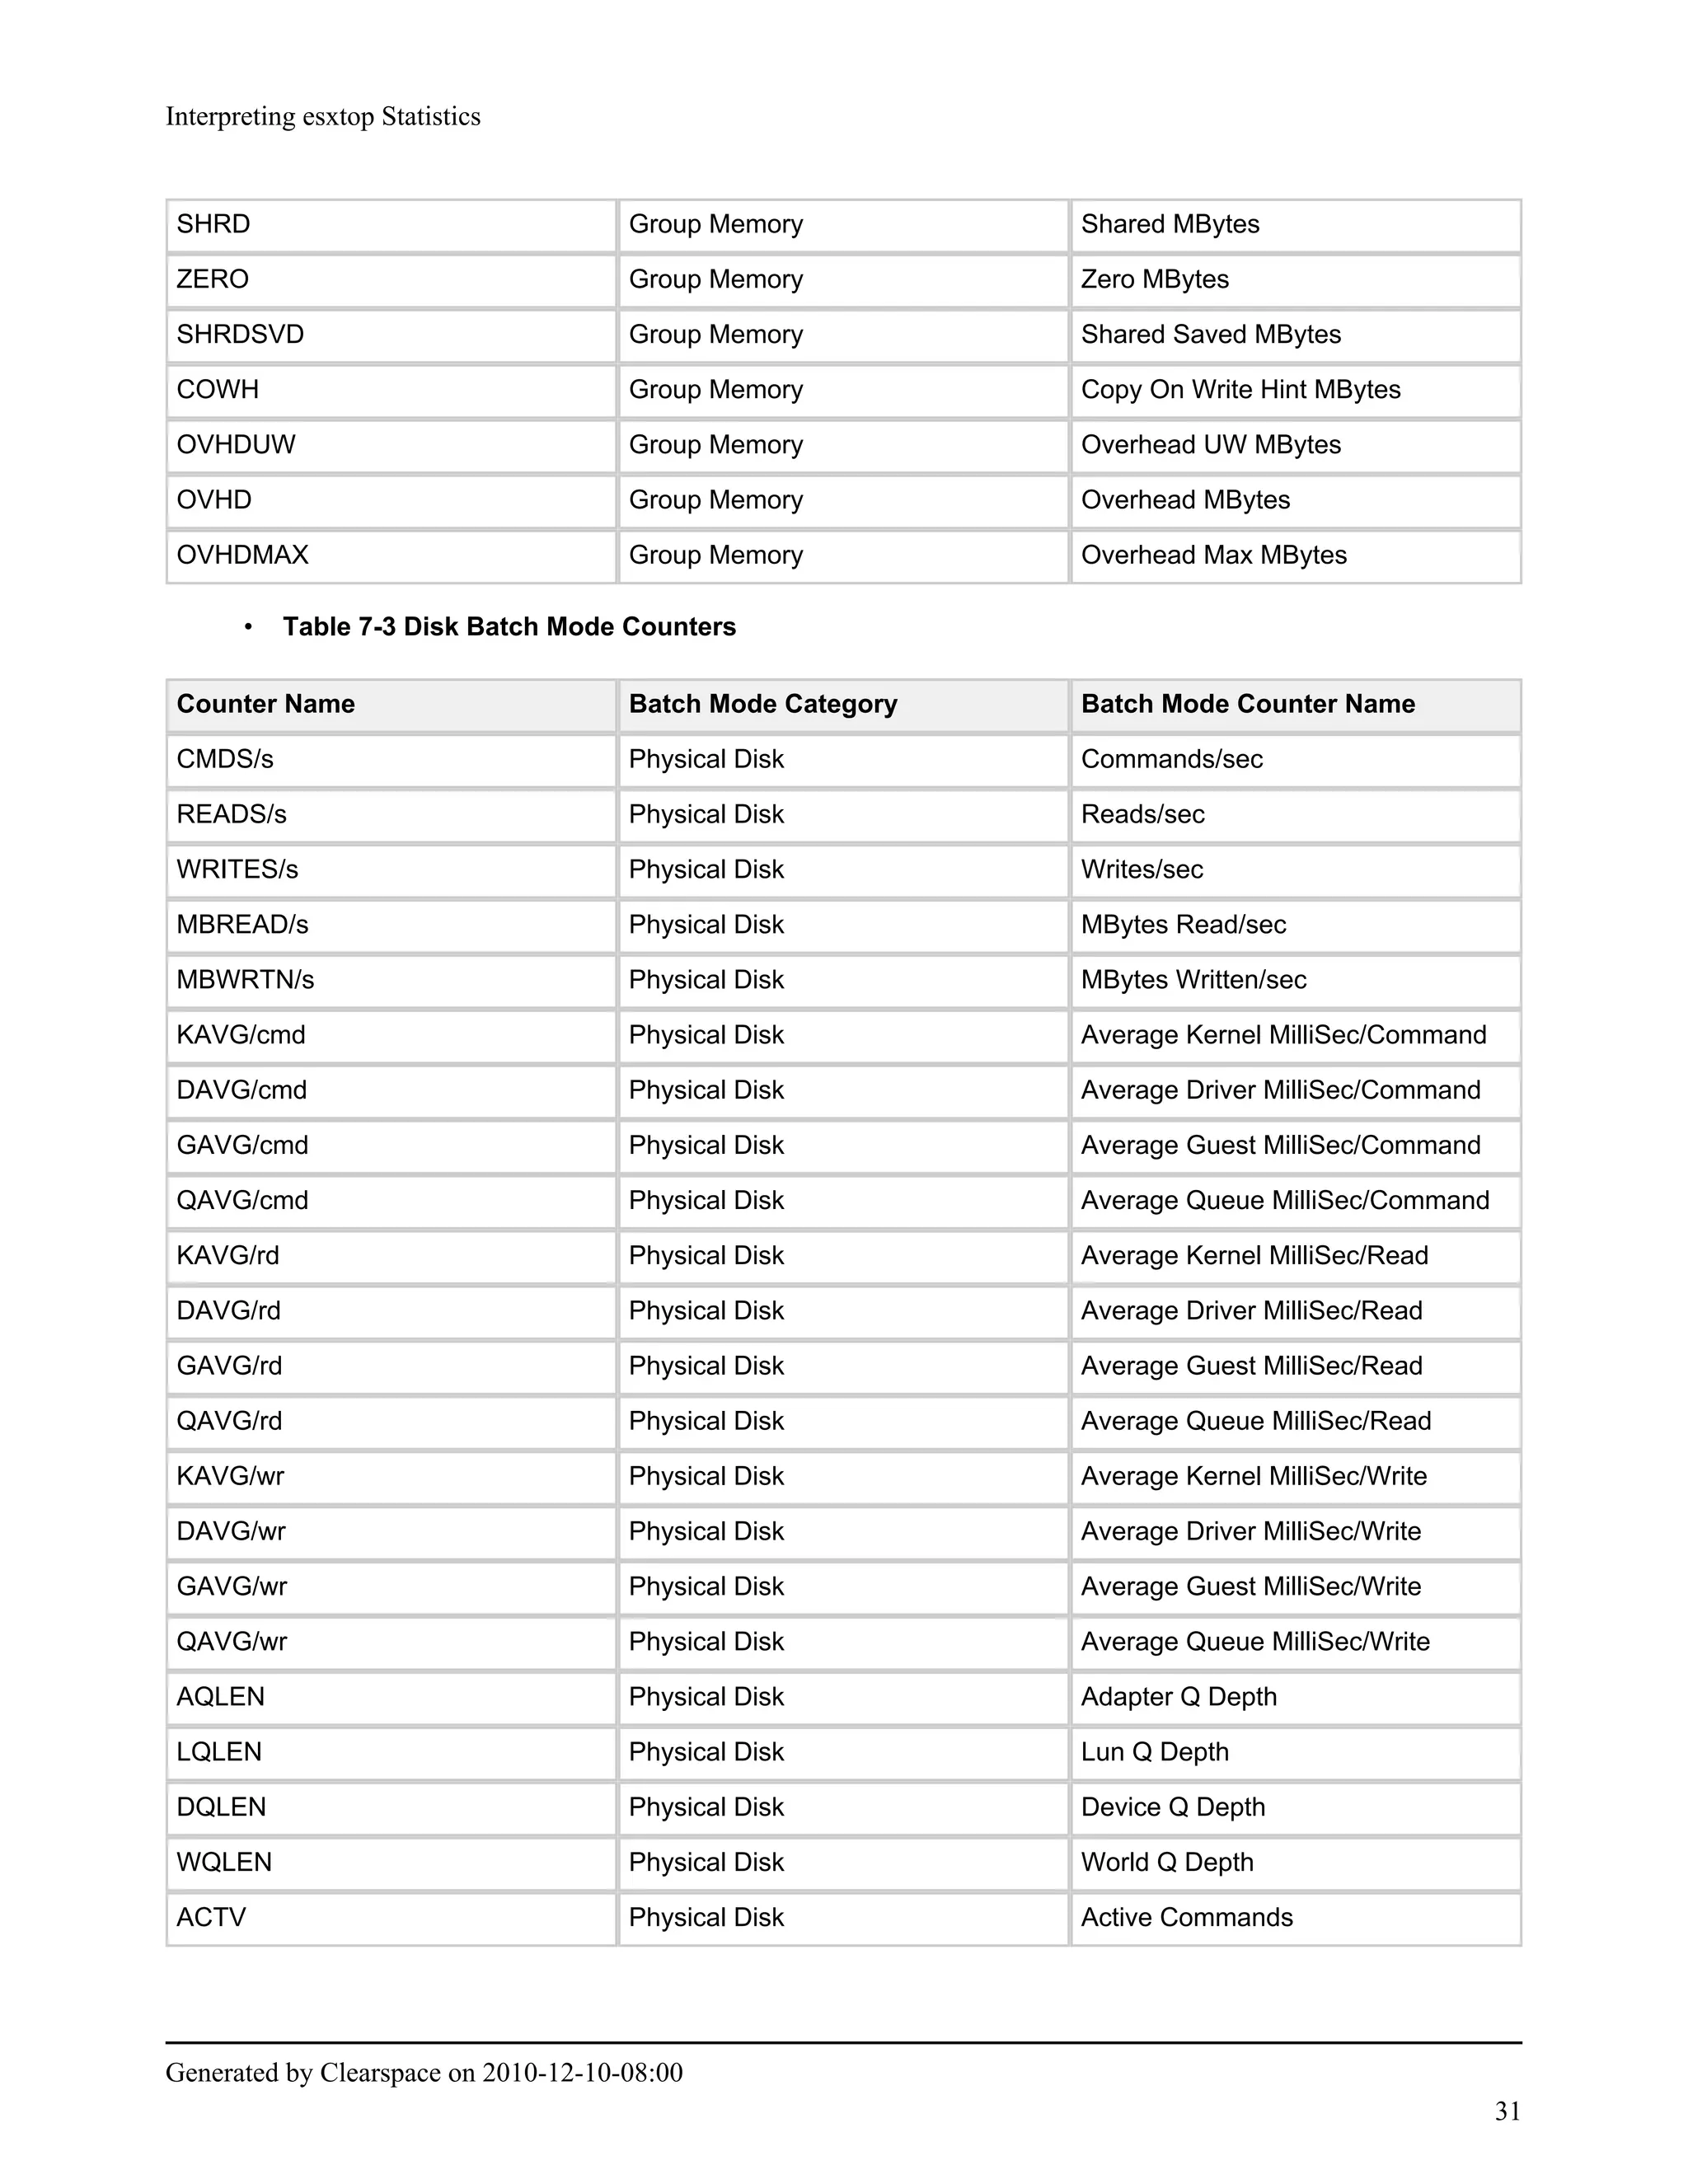
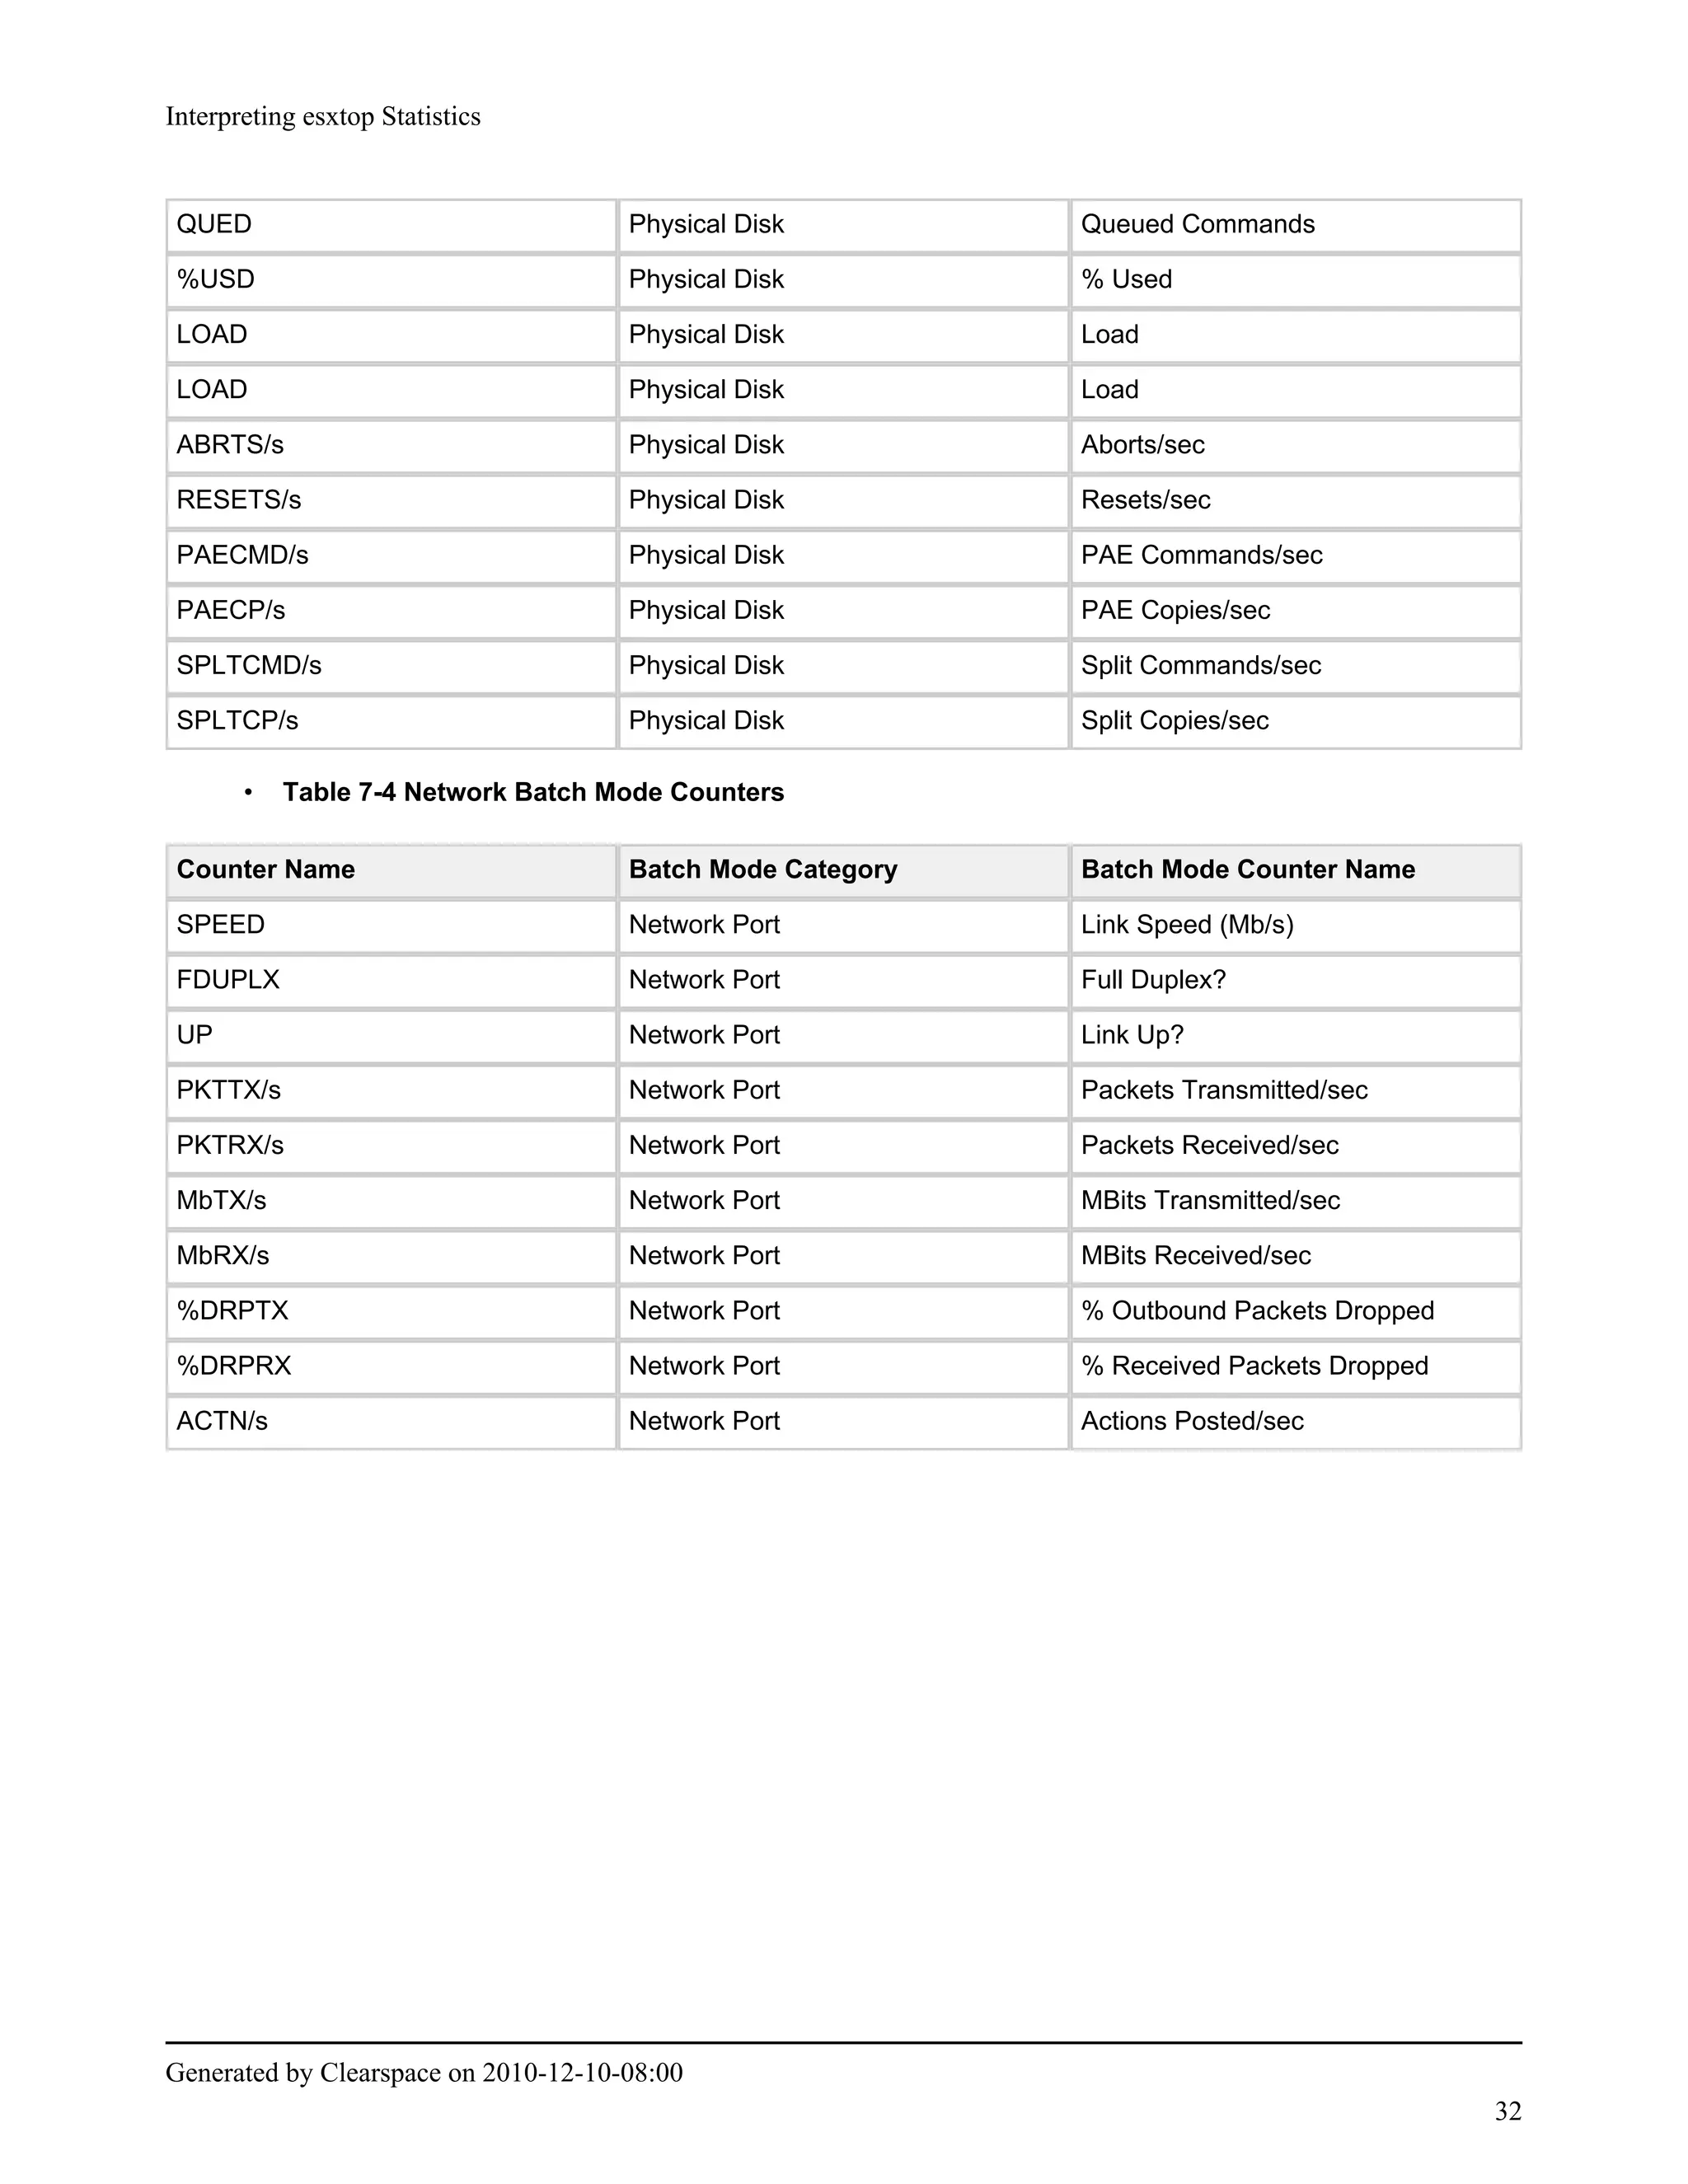
Section 4 discusses disk statistics for