

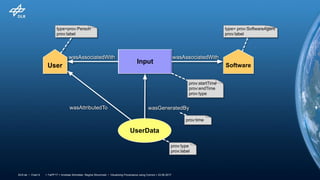
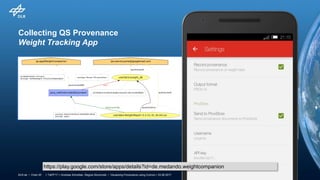
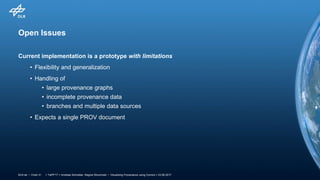
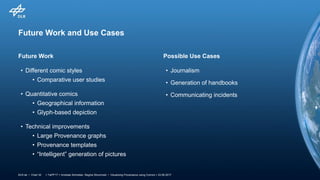
![> TaPP'17 > Andreas Schreiber, Regina Struminski • Visualizing Provenance using Comics > 23.06.2017DLR.de • Chart 30
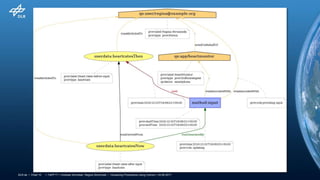
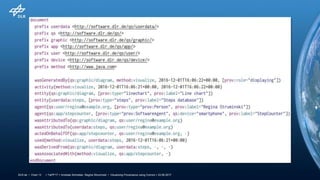
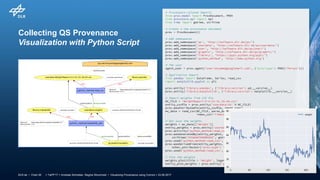
Implementation Details
Additional attributes
agent(qs:app/stepcounter, [prov:type="prov:SoftwareAgent",
qs:device="smartphone", prov:label="StepCounter"])
agent(qs:service/fitbit,
[prov:type="prov:Organization", prov:label="Fitbit"])
wasGeneratedBy(userdata:activities/steps, method:request,
2016-12-01T16:06:22+00:00, [prov:role="uploading"])
http://provcomics.de/?username=rstruminski&docId=115547](https://image.slidesharecdn.com/20170623provcomics-170624174403/85/Visualizing-Provenance-using-Comics-30-320.jpg)


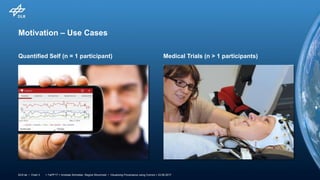
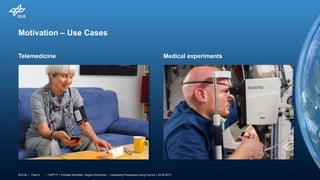
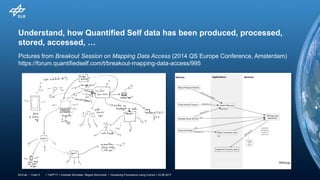
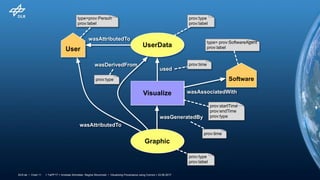
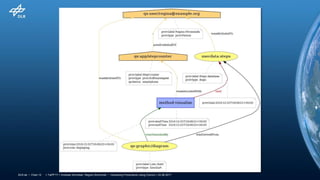
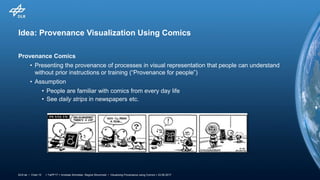
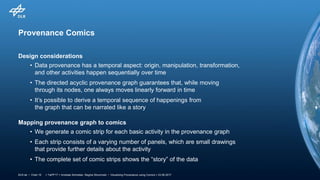
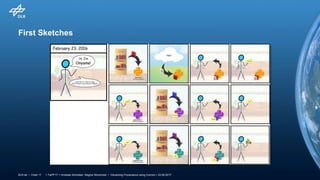
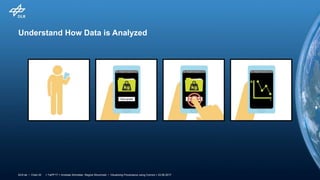
The document discusses visualizing data provenance through comics as a way to enhance understanding for non-experts. It outlines the need for clear representation of how personal data is generated and used in contexts like quantified self practices, telemedicine, and medical trials. The authors propose a comic strip format that narratively depicts the data's lifecycle, addressing issues of access and privacy while also suggesting future improvements and potential applications of this visualization method.


