Downloaded 42 times


![ProvenanceinScience
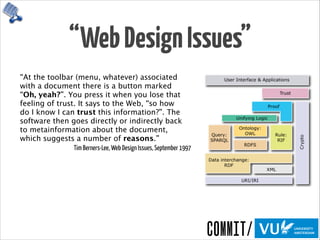
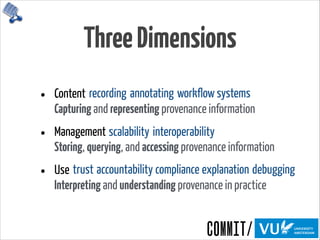
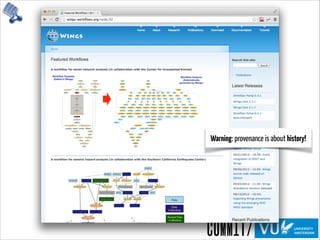
“We need a paradigm that makes it simple […]
to perform and publish reproducible
computational research. […] a Reproducible
Research Environment (RRE) […] provides
computational tools together with the ability
to automatically track the provenance of data,
analysis, and results and to package them (or
pointers to persistent versions of them) for
redistribution.”
Jill Mesirov, Chief Informatics Officer of the MIT/
Harvard Broad Institute, in Science, January 2010
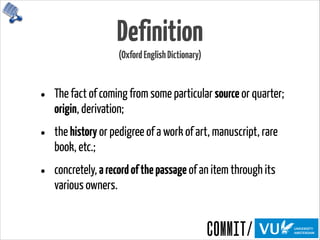
Need provenance for reproducibility
and verification of processes](https://image.slidesharecdn.com/provoviz-wai-20140331-140331090542-phpapp02/85/Prov-O-Viz-Interactive-Provenance-Visualization-20-320.jpg)

![NaiveApproaches
InProv: Visualizing Provenance Graphs with Radial Layouts and Time-Based Hierarchical Grouping
Madelaine D. Boyd - http://www.seas.harvard.edu/sites/default/files/files/archived/Boyd.pdf
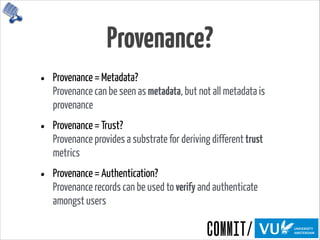
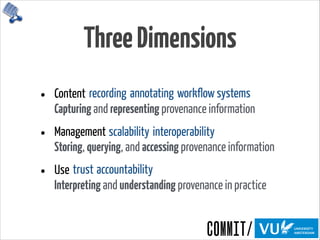
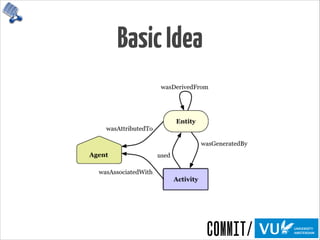
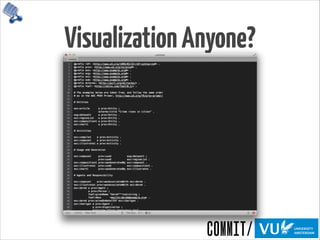
Orbiter has several limitations. It does not have capabilities for query subgraph high-
lighting, regular expression filters, process grouping, annotations, or programmable views[16].
Furthermore, the structure of each summary node, where child nodes are grouped within
parents and are hidden until the parent is expanded, benefits queries earlier in the depen-
dency chain. Initial overviews often correspond with system bootup, and appear very similar
across di↵erent traces (time slices of system activity).
Figure 10: In these screenshots of Orbiter, the presence of edges overwhelms the visibility of
nodes. By relying on a node-link graph layout and using spatial location to encode object
relationships, Orbiter’s graph layout algorithm must draw many long edges to communi-
cate node connections. Without edge bundling or opacity variation, the meanings of these
relationships are obscured.
Another one of Orbiter’s weaknesses is its node-link diagram layout. As a result, each
node’s position in the X-Y plane and the length and angle of connecting lines are wasted
attributes. The chosen graph layout algorithm (dot by default) arranges nodes to minimize
Figure 11: (Top): A screenshot of the portion of the graph generated by GraphViz for a
trace of the third provenance challenge. (Bottom): A zoomed-in view of the same graph.
The horizontal black bars across the images are dense collections of edges.
E↵ective large graph visualizations present the user with a summary view that can be
explored, filtered, and expanded interactively.
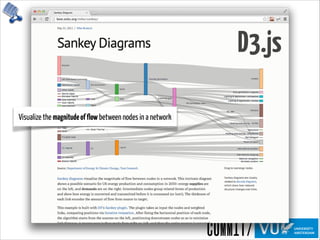
2.5 Tree Visualization
While trees are a subcategory of graphs, because of their hierarchical composition, tree visu-
alization forms its own subfield of research. A survey of over two-hundred tree visualizations
is given at Hans-Jrg Schulz’s treevis.net. Visitors can narrow down by dimensionality
(2D, 3D, or mixed), representation (explicit node-link diagram, implicit treemap, or combi-
nation), alignment (XY plot, radial layout, or free diagram)[55]. These categories are shown
Figure 12: Left: Pajek uses various summary node-link and matrix-based representations
depending on the structure of the supplied data set. Pictured is a main core subgraph
extracted from routing data on the Internet. Right: TopoLayout optimizes the choice of
visualization display depending on the underlying graph structure. The right column is
TopoLayout’s output, while the left and middle columns are the outputs of the GRIP and
FM graph layout algorithms.
Figure 13: treevis.net defines di↵erent categories for tree maps. Tree maps can be cate-
gorized by dimensionality (2D, 3D, or mixed), representation (explicit, implicit, or mixed),
or alignment (XY, radial, or spring).
Tree visualizations are either explicit or implicit. Explicit representations resemble node-
link diagrams. An example of an implicit representation is a tree map, a diagram where the
entire tree is inscribed in a rectangle representing the root node. This root is subdivided
hierarchically into more rectangles, which represent child nodes, and each child node is
subdivided into more child nodes. Treemaps are excellent for displaying hierarchical or
categorical data[57]. One famous example, shown in Figure 14, is the “Map of the Market”
from SmartMoney.com, which displays in red and green the changes in market value of
publicly-traded companies, grouped by market sector, with cell size proportional to market
capitalization[64].
TreePlus is an example of a tree-inspired graph visualization tool (Figure 15). It uses
the guiding metaphor of “plant a seed to watch it grow” to summarize navigation of its tree-](https://image.slidesharecdn.com/provoviz-wai-20140331-140331090542-phpapp02/85/Prov-O-Viz-Interactive-Provenance-Visualization-40-320.jpg)
![InProv
InProv: Visualizing Provenance Graphs with Radial Layouts and Time-Based Hierarchical Grouping
Madelaine D. Boyd - http://www.seas.harvard.edu/sites/default/files/files/archived/Boyd.pdf
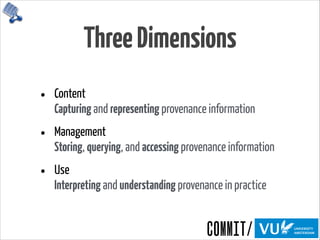
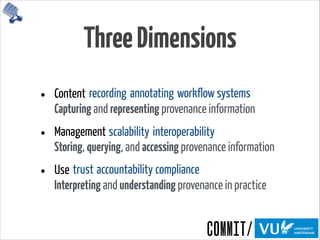
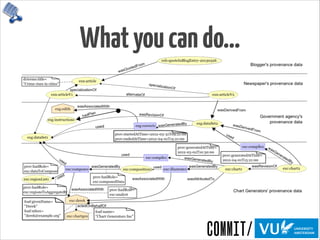
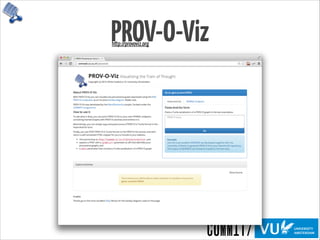
6 Final Design
Figure 30: A view of a cluster of system activity. This particular timeslice shows the activity
of the init.sh and mount processes.
This visualization was designed with the Visual Information-Seeking Mantra in mind -
“overview first, zoom and filter, then details-on-demand”[56].](https://image.slidesharecdn.com/provoviz-wai-20140331-140331090542-phpapp02/85/Prov-O-Viz-Interactive-Provenance-Visualization-41-320.jpg)
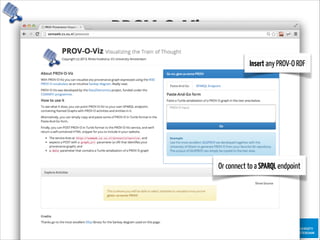
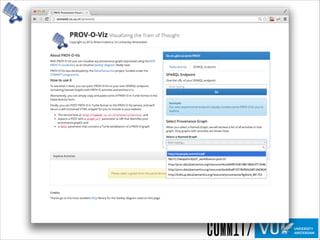
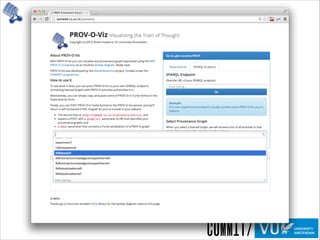
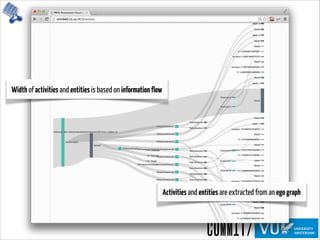
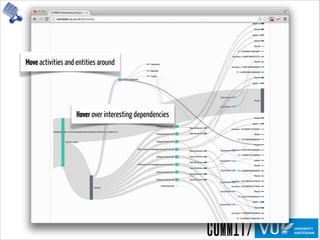
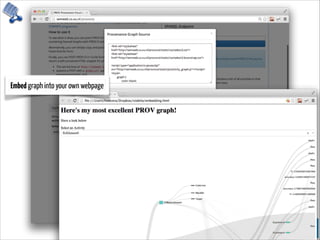

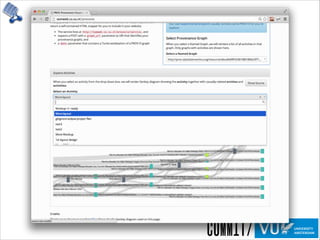
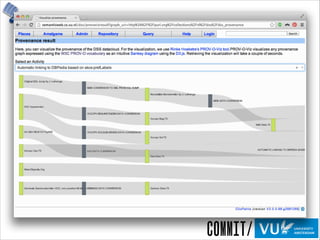

The document discusses the importance of provenance in various fields such as government, science, and industry, highlighting its role in ensuring trust, compliance, and reproducibility. It outlines the challenges of visualizing complex provenance data and introduces prov-o-viz, a tool for creating intuitive visual representations of provenance graphs. Additionally, it emphasizes the need for standards and effective management of provenance information to enhance data integration and reuse.


![Getting Started with Apache Spark: Big Data Made Simple [Free Meetup]](https://cdn.slidesharecdn.com/ss_thumbnails/apachesparkgettingstarted-260203175547-8361bcc3-thumbnail.jpg?width=640&height=640&fit=bounds)


