Download to read offline


![Analyzing and Querying – CYPHER Graph Query Language (Neo4j)
CYPHER „Query“ with one „Clause“
MATCH
(a)-[r:RELATIONSHIP_TYPE]->(b)
RETURN a, r, b
Nodes in our data model
• Packages: PackageFragment
• Classes: CompilationUnit
Relationships in our data model
• Dependencies: EXPORTS, IMPORTS
• Service implementations and
dependencies:
HAS_SERVICE_COMPONENT,
HAS_IMPLEMENTATION_CLASS, …
> IEEE Aerospace 2019 > A. Schreiber, L. Nafeie, A. Baranowski, P. Seipel, M. Misiak • Visualization of Software Architectures in Virtual Reality and Augmented Reality > 03.03.2019DLR.de • Chart 8
MATCH
(pf:PackageFragment)-[c:CONTAINS]->
(cu:CompilationUnit),
()-[e:EXPORTS]->(),
()-[i:IMPORTS]->(),
()-[hs:HAS_SERVICE_COMPONENT]->(),
()-[hi:HAS_IMPLEMENTATION_CLASS]->(),
()-[ps:PROVIDES_SERVICE]->(),
()-[hfh:HAS_FRAGMENT_HOST]->(),
()-[hba:HAS_BUNDLE_ACTIVATOR]->(),
()-[rb:REQUIRES_BUNDLE]->()
RETURN pf,c,cu,e,i,hs,hi,ps,hfh,hba,rb](https://image.slidesharecdn.com/20190303-1visualizationofsoftwarearchitecturesinvirtualrealityandaugmentedreality-190303130032/85/Visualization-of-Software-Architectures-in-Virtual-Reality-and-Augmented-Reality-8-320.jpg)
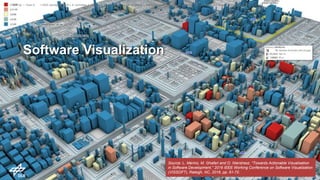


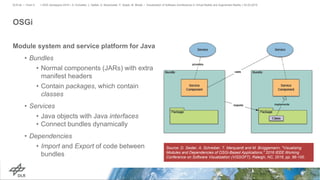
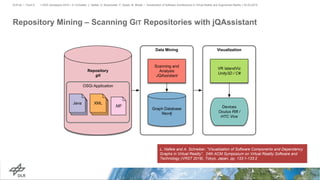
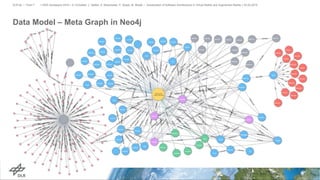
The document discusses visualizing software architectures in virtual reality and augmented reality. Researchers at DLR developed techniques to mine code repositories for OSGi-based applications, represent the data as a graph in Neo4j, and visualize the software as 3D islands in VR and AR using an "island metaphor". This allows developers to explore package dependencies, service dependencies, and get an overview of large and complex software systems. Current work involves usability studies and adding capabilities like visualizing code evolution over time.