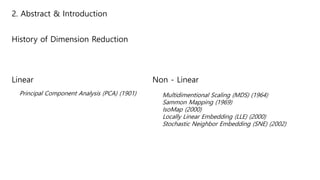
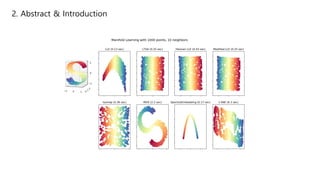
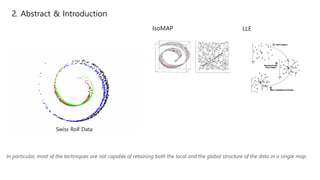
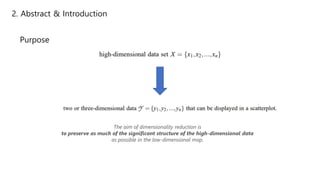
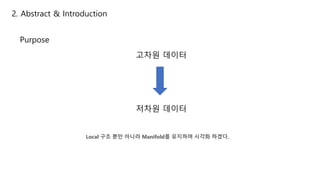
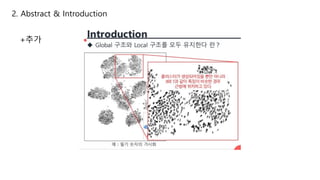
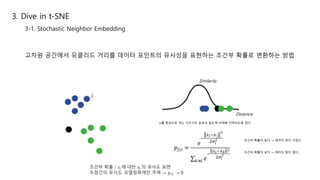
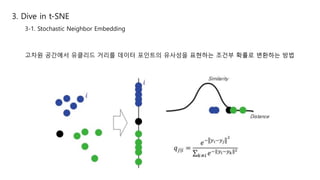
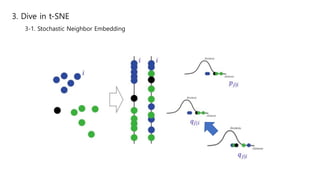
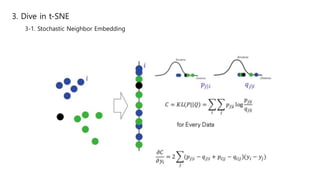
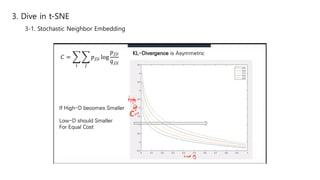
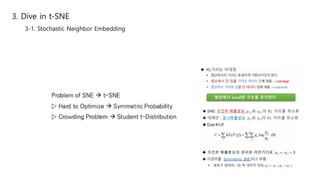
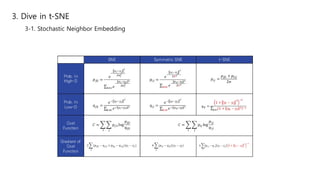
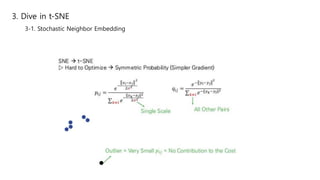
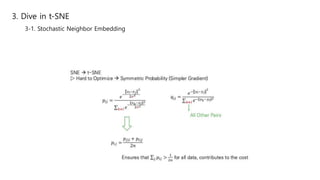
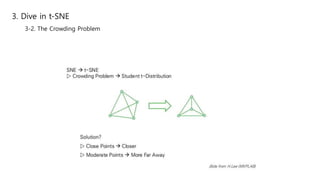
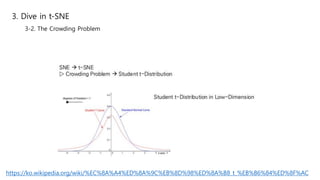
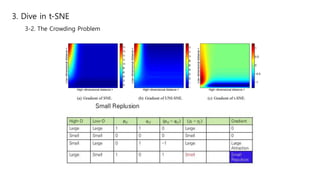
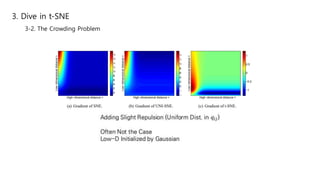
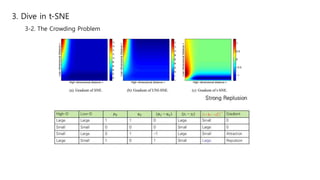
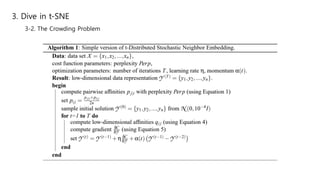
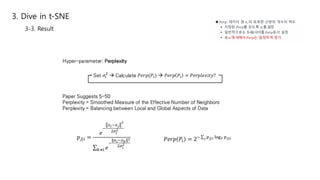
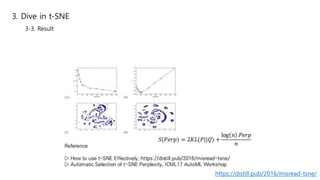
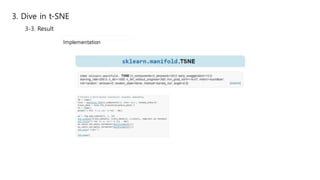
Visualizing data using t-SNE
장경욱
Contents
2. Abstract & Introduction
3. Dive in t-SNE
1. Why I choose this paper?
3-1. Stochastic Neighbor Embedding
3-2. The Crowding Problem
3-3. Result
1. Why I choose this paper?
http://www.jmlr.org/papers/volume9/vandermaaten08a/vandermaaten08a.pdf
Visualizing Data using t-SNE
시각화 공부
많은 자료
Creative AI
https://experiments.withgoogle.com/visualizing-high-dimensional-space
2. Abstract & Introduction
t-SNE
Student T Distributed-Stochastic Neighbor Embedding
Nonlinear Dimension Reduction for Visualization (2-D or 3-D)
Advance Version of SNE (G. Hinton, NIPS 2003)
Gradient-based Machine Learning Algorithm
2. Abstract & Introduction
고차원 데이터의 시각화는 다양한 분야에서 중요한 과제
- 다양한 차원 취급
- Ex : 유방암 관련 세포핵의 종류 – 30종류
- Ex : 문서를 표현하는 단어벡터 – 수천 차원
2. Abstract & Introduction
Dimension Reduction Visualization
Traditional dimensionality reduction techniques such as
Principal Components Analysis (PCA; Hotelling, 1933)
classical multidimensional scaling (MDS; Torgerson, 1952) are
linear techniques that focus on keeping the low-dimensional
representations of dissimilar datapoints far apart
(1) Sammon mapping (Sammon, 1969),
(2) curvilinear components analysis (CCA; Demartines and Herault,1997),
(3) Stochastic Neighbor Embedding (SNE; Hinton and Roweis, 2002),
(4) Isomap (Tenenbaum et al., 2000),
(5) Maximum Variance Unfolding (MVU; Weinberger et al., 2004),
(6) Locally Linear Embedding (LLE; Roweis and Saul, 2000), and
(7) Laplacian Eigenmaps (Belkin and Niyogi, 2002)
https://docs.google.com/document/d/1gOMppfeYjoQFBqQjFXpEcHwWVXYRZF9EWjfxMPyj37Q/edit?usp=sharing
2. Abstract & Introduction
History of Dimension Reduction
Linear
Principal Component Analysis (PCA) (1901)
Non - Linear
Multidimentional Scaling (MDS) (1964)
Sammon Mapping (1969)
IsoMap (2000)
Locally Linear Embedding (LLE) (2000)
Stochastic Neighbor Embedding (SNE) (2002)
2. Abstract & Introduction
IsoMAP LLE
In particular, most of the techniques are not capable of retaining both the local and the global structure of the data in a single map.
Swiss Roll Data
2. Abstract & Introduction
Purpose
The aim of dimensionality reduction is
to preserve as much of the significant structure of the high-dimensional data
as possible in the low-dimensional map.
2. Abstract & Introduction
Purpose
Local 구조 뿐만 아니라 Manifold를 유지하며 시각화 하겠다.
고차원 데이터
저차원 데이터
2. Abstract & Introduction
+추가
2. Abstract & Introduction
Problem
3. Dive in t-SNE
3-1. Stochastic Neighbor Embedding
고차원 공간에서 유클리드 거리를 데이터 포인트의 유사성을 표현하는 조건부 확률로 변환하는 방법
xi를 중심으로 하는 가우시안 분포의 밀도에 비례해 선택되도록 한다.
조건부 확률이 높다 → 데이터 점이 가깝다
조건부 확률이 낮다 → 데이터 점이 멀다
3. Dive in t-SNE
3-1. Stochastic Neighbor Embedding
고차원 공간에서 유클리드 거리를 데이터 포인트의 유사성을 표현하는 조건부 확률로 변환하는 방법
3. Dive in t-SNE
3-1. Stochastic Neighbor Embedding
3. Dive in t-SNE
3-1. Stochastic Neighbor Embedding
3. Dive in t-SNE
3-1. Stochastic Neighbor Embedding
3. Dive in t-SNE
3-1. Stochastic Neighbor Embedding
3. Dive in t-SNE
3-1. Stochastic Neighbor Embedding
3. Dive in t-SNE
3-1. Stochastic Neighbor Embedding
3. Dive in t-SNE
3-1. Stochastic Neighbor Embedding
3. Dive in t-SNE
3-2. The Crowding Problem
3. Dive in t-SNE
3-2. The Crowding Problem
https://ko.wikipedia.org/wiki/%EC%8A%A4%ED%8A%9C%EB%8D%98%ED%8A%B8_t_%EB%B6%84%ED%8F%AC
3. Dive in t-SNE
3-2. The Crowding Problem
3. Dive in t-SNE
3-2. The Crowding Problem
3. Dive in t-SNE
3-2. The Crowding Problem
3. Dive in t-SNE
3-2. The Crowding Problem
3. Dive in t-SNE
3-3. Result
3. Dive in t-SNE
3-3. Result
https://distill.pub/2016/misread-tsne/
3. Dive in t-SNE
3-3. Result
3. Dive in t-SNE
3-3. Result
Reference
- http://www.jmlr.org/papers/volume9/vandermaaten08a/vandermaaten08a.pdf
- https://www.slideshare.net/TaeohKim4/pr-103-tsne
- https://www.slideshare.net/ssuser06e0c5/visualizing-data-using-tsne-73621033
- https://www.youtube.com/watch?v=zpJwm7f7EXs
- https://www.youtube.com/watch?v=NEaUSP4YerM
- https://ml-dnn.tistory.com/10
- http://mlexplained.com/2018/09/14/paper-dissected-visualizing-data-using-t-sne-
explained/
- https://lovit.github.io/nlp/representation/2018/09/28/tsne/
- https://lovit.github.io/nlp/representation/2018/09/28/mds_isomap_lle/

Visualizing data using t-SNE

  • 1.
    Visualizing data usingt-SNE 장경욱
  • 2.
    Contents 2. Abstract &Introduction 3. Dive in t-SNE 1. Why I choose this paper? 3-1. Stochastic Neighbor Embedding 3-2. The Crowding Problem 3-3. Result
  • 3.
    1. Why Ichoose this paper? http://www.jmlr.org/papers/volume9/vandermaaten08a/vandermaaten08a.pdf Visualizing Data using t-SNE 시각화 공부 많은 자료 Creative AI https://experiments.withgoogle.com/visualizing-high-dimensional-space
  • 4.
    2. Abstract &Introduction t-SNE Student T Distributed-Stochastic Neighbor Embedding Nonlinear Dimension Reduction for Visualization (2-D or 3-D) Advance Version of SNE (G. Hinton, NIPS 2003) Gradient-based Machine Learning Algorithm
  • 5.
    2. Abstract &Introduction
  • 6.
    2. Abstract &Introduction
  • 7.
    2. Abstract &Introduction 고차원 데이터의 시각화는 다양한 분야에서 중요한 과제 - 다양한 차원 취급 - Ex : 유방암 관련 세포핵의 종류 – 30종류 - Ex : 문서를 표현하는 단어벡터 – 수천 차원
  • 8.
    2. Abstract &Introduction
  • 9.
    2. Abstract &Introduction
  • 10.
    2. Abstract &Introduction Dimension Reduction Visualization Traditional dimensionality reduction techniques such as Principal Components Analysis (PCA; Hotelling, 1933) classical multidimensional scaling (MDS; Torgerson, 1952) are linear techniques that focus on keeping the low-dimensional representations of dissimilar datapoints far apart (1) Sammon mapping (Sammon, 1969), (2) curvilinear components analysis (CCA; Demartines and Herault,1997), (3) Stochastic Neighbor Embedding (SNE; Hinton and Roweis, 2002), (4) Isomap (Tenenbaum et al., 2000), (5) Maximum Variance Unfolding (MVU; Weinberger et al., 2004), (6) Locally Linear Embedding (LLE; Roweis and Saul, 2000), and (7) Laplacian Eigenmaps (Belkin and Niyogi, 2002) https://docs.google.com/document/d/1gOMppfeYjoQFBqQjFXpEcHwWVXYRZF9EWjfxMPyj37Q/edit?usp=sharing
  • 11.
    2. Abstract &Introduction History of Dimension Reduction Linear Principal Component Analysis (PCA) (1901) Non - Linear Multidimentional Scaling (MDS) (1964) Sammon Mapping (1969) IsoMap (2000) Locally Linear Embedding (LLE) (2000) Stochastic Neighbor Embedding (SNE) (2002)
  • 12.
    2. Abstract &Introduction
  • 13.
    2. Abstract &Introduction IsoMAP LLE In particular, most of the techniques are not capable of retaining both the local and the global structure of the data in a single map. Swiss Roll Data
  • 14.
    2. Abstract &Introduction Purpose The aim of dimensionality reduction is to preserve as much of the significant structure of the high-dimensional data as possible in the low-dimensional map.
  • 15.
    2. Abstract &Introduction Purpose Local 구조 뿐만 아니라 Manifold를 유지하며 시각화 하겠다. 고차원 데이터 저차원 데이터
  • 16.
    2. Abstract &Introduction +추가
  • 17.
    2. Abstract &Introduction Problem
  • 18.
    3. Dive int-SNE 3-1. Stochastic Neighbor Embedding 고차원 공간에서 유클리드 거리를 데이터 포인트의 유사성을 표현하는 조건부 확률로 변환하는 방법 xi를 중심으로 하는 가우시안 분포의 밀도에 비례해 선택되도록 한다. 조건부 확률이 높다 → 데이터 점이 가깝다 조건부 확률이 낮다 → 데이터 점이 멀다
  • 19.
    3. Dive int-SNE 3-1. Stochastic Neighbor Embedding 고차원 공간에서 유클리드 거리를 데이터 포인트의 유사성을 표현하는 조건부 확률로 변환하는 방법
  • 20.
    3. Dive int-SNE 3-1. Stochastic Neighbor Embedding
  • 21.
    3. Dive int-SNE 3-1. Stochastic Neighbor Embedding
  • 22.
    3. Dive int-SNE 3-1. Stochastic Neighbor Embedding
  • 23.
    3. Dive int-SNE 3-1. Stochastic Neighbor Embedding
  • 24.
    3. Dive int-SNE 3-1. Stochastic Neighbor Embedding
  • 25.
    3. Dive int-SNE 3-1. Stochastic Neighbor Embedding
  • 26.
    3. Dive int-SNE 3-1. Stochastic Neighbor Embedding
  • 27.
    3. Dive int-SNE 3-2. The Crowding Problem
  • 28.
    3. Dive int-SNE 3-2. The Crowding Problem https://ko.wikipedia.org/wiki/%EC%8A%A4%ED%8A%9C%EB%8D%98%ED%8A%B8_t_%EB%B6%84%ED%8F%AC
  • 29.
    3. Dive int-SNE 3-2. The Crowding Problem
  • 30.
    3. Dive int-SNE 3-2. The Crowding Problem
  • 31.
    3. Dive int-SNE 3-2. The Crowding Problem
  • 32.
    3. Dive int-SNE 3-2. The Crowding Problem
  • 33.
    3. Dive int-SNE 3-3. Result
  • 34.
    3. Dive int-SNE 3-3. Result https://distill.pub/2016/misread-tsne/
  • 35.
    3. Dive int-SNE 3-3. Result
  • 36.
    3. Dive int-SNE 3-3. Result
  • 37.
    Reference - http://www.jmlr.org/papers/volume9/vandermaaten08a/vandermaaten08a.pdf - https://www.slideshare.net/TaeohKim4/pr-103-tsne -https://www.slideshare.net/ssuser06e0c5/visualizing-data-using-tsne-73621033 - https://www.youtube.com/watch?v=zpJwm7f7EXs - https://www.youtube.com/watch?v=NEaUSP4YerM - https://ml-dnn.tistory.com/10 - http://mlexplained.com/2018/09/14/paper-dissected-visualizing-data-using-t-sne- explained/ - https://lovit.github.io/nlp/representation/2018/09/28/tsne/ - https://lovit.github.io/nlp/representation/2018/09/28/mds_isomap_lle/