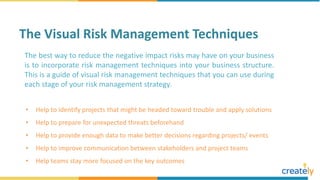
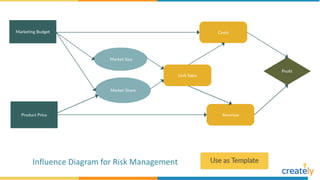
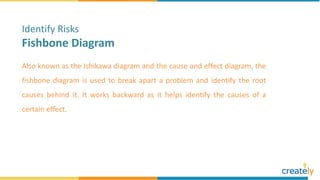
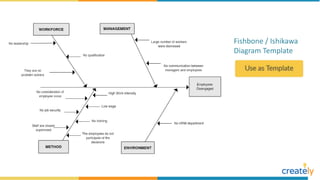
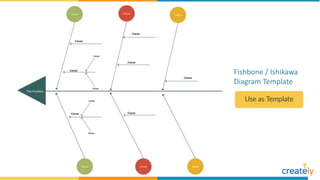
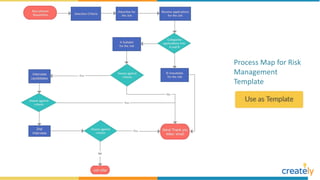
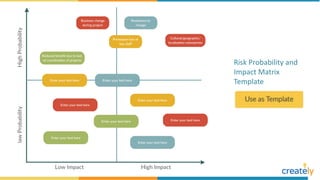
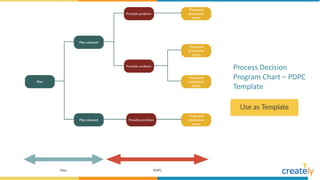
SlideShare a Scribd company logo
The best way to reduce the negative impact risks may have on your business
is to incorporate risk management techniques into your business structure.
This is a guide of visual risk management techniques that you can use during
each stage of your risk management strategy.
The Visual Risk Management Techniques
• Help to identify projects that might be headed toward trouble and apply solutions
• Help to prepare for unexpected threats beforehand
• Help to provide enough data to make better decisions regarding projects/ events
• Help to improve communication between stakeholders and project teams
• Help teams stay more focused on the key outcomes
The risk management process begins with identifying risks in advance
once you have set the goal. Identifying risks should be done early in a
project and shouldn’t be done in the middle of or during a project, as it
may be too late.
Identifying risks can be done in 2 ways;
• By identifying root causes and the impact they may have
• By identifying the essential functions the company must perform to
reach a goal and identifying how they can fail
Identify Risks
Decision trees are used to make decisions when you are faced with
multiple options. It allows you to assess the values of outcomes and
possibilities of achieving them. This, in turn, helps make a better decision.
Identify Risks
Decision Tree Diagram
Step 1: Identify decisions and prepare a decision tree diagram based on decisions,
costs, and rewards of uncertain options available to you.
Step 2: Figure out the probability of a risk occurring and assign it
Step 3: In this step you have to identify the monetary value of the risk, or in other
words how much it would cost you if the risk is to occur
Step 4: Calculate the Expected Monetary Value (EMV) of each decision path by
multiplying probability and impact
How to use Decision Tree Diagram
Decision Tree Analysis Template
Decision Tree Diagram
Template
Decision Tree Diagram With 6 Outcomes
An influence diagram is used to represent the summary of information of a
decision tree. It shows variables that are known and unknown when
making a decision and the relationships that exist among them.
Identify Risks
Influence Diagram
Step 1: Identify the decisions to be made to reach your objective
Step 2: Consider the risks and performance factors that may have an influence on
achieving your objective.
Step 3: Recognize secondary factors that affect uncertainty associated with the
performance factors.
Step 4: Identify second-order risk factors that can influence secondary factors.
How to use Influence Diagram
Step 5: Continue to figure out what factors influence uncertainty until all key risks are
identified.
Influence Diagram for Risk Management
Whether you are planning a new project or developing a new process, a
SWOT Analysis can help you get insight into any risks that may occur. It
helps you identify the Strengths, Weaknesses, Threats and Opportunities
associated with the event.
Identify Risks
SWOT Analysis
Step 1: The first step is to list down your strengths. Knowing these will help you to be
more confident.
Step 2: The second step is to identify your weaknesses. Identifying weaknesses is the
best way to improve them.
Step 3: Opportunities come in different shapes and forms. Sometimes opportunities
past by you without you even noticing them.
Step 4: When doing a personal SWOT analysis you need to think of yourself as a
company or a product and assess yourself against others.
How to use SWOT Analysis
SWOT Analysis of Tourism
Industry
SWOT Analysis Blank
Template
SWOT Analysis Blank
Template
Also known as the Ishikawa diagram and the cause and effect diagram, the
fishbone diagram is used to break apart a problem and identify the root
causes behind it. It works backward as it helps identify the causes of a
certain effect.
Identify Risks
Fishbone Diagram
Fishbone / Ishikawa
Diagram Template
Fishbone / Ishikawa
Diagram Template
Fishbone / Ishikawa
Diagram Template
Process maps help visualize the major steps and relationships between
them in a process. By having the people who actually perform it outline
the process using a process map, you can check for its accuracy. This also
helps identify bottlenecks and blockers in advance.
Identify Risks
Process Maps
Step 1: Identify the team you need to map – whether its a new process or a process
being redesigned
Step 2: Bring together everyone who is involved in performing/ developing the
process and brainstorm all information related to the process, such as inputs,
outputs etc.
Step 3: Take the steps you identified and put them in a sequential order
Step 4: Draw a map that shows the current state of the process
How to use Process Maps
Step 5: Identify the bottlenecks and flaws in your process
Process Map for Risk
Management
Template
Once you have identified the risks, the next step is to assess the risks to see
what kind of an impact they have on your business and current projects. By
correctly analyzing the risks, you will be able to prioritize as to which risk has
the highest impact on your business.
Analyzing risks can be done in two ways
• Qualitative risk analysis – here the risks are analyzed based on the
likelihood of them occurring and the impact they may have on projects,
business etc.
• Quantitative risk analysis – quantifies the possible outcomes and evaluate
the probability of achieving objects
Analyze the Identified Risk
This is a tool that can be used to do a qualitative risk assessment. It helps
to evaluate the relative impact (high or low) of a risk and the probability of
its occurrence (high or low).
Analyze the Identified Risk
Risk Probability and Impact Matrix
Risk Probability and
Impact Matrix
Template
Pareto diagrams are a great way to identify which problems should be
prioritized based on the cumulative effect it has on a system. While the
length of the bars represents the frequency or cost (time or money), the
bars are arranged with the longest bars to the right and shortest bars to
the right. This way it depicts which situation is the most significant.
Analyze the Identified Risk
Pareto Chart
Step 1: Identify the categories you want to use to group the items, and the
measurements (i.e. frequency, cost, time etc.)
Step 2: Decide the period of time (an hour, week or day etc.) you want the Pareto
chart to cover
Step 3: Collect the data along with the category and subtotal the measurements for
each category
Step 4: Determine the right scale for the measurements and mark the scale on the
left side of the chart
How to use Pareto Chart
Step 5: Label bars for each category, placing the tallest at the far left
Step 6: Calculate the percentage for each category
Step 7: Calculate and draw cumulative sums
Risk Probability and
Impact Matrix
Template
The fault tree analysis helps to identify the probabilities of various
outcomes from given faults and failures. The fault tree analysis helps to
identify the likelihood of an event occurring by visualizing a certain event
at a top and the conditions causing that event.
Analyze the Identified Risk
Fault Tree Analysis
Step 1: Identify the fault/ failure that should be analyzed
Step 2: List down the immediate or direct causes of the fault. Thoroughly examine
each step until the root causes are analyzed
Step 3: Once you apply the data to the fault tree, use it to do the evaluation
How to use Pareto Chart
Fault Tree Analysis Diagram Template
In the planning phase of the risk management cycle, you need to pay
attention to mitigating risks by finding solutions and controlling them.
Starting from the risks that have the most severe impact on your projects
or organization, find out how to minimize their effect.
Planning to Avoid Future Risks
Futures wheel is a tool that you can use to identify direct and indirect
results of a certain trend, event or decision.
Planning to Avoid Future Risks
Futures Wheel Diagram
Step 1: Identify the change. This could be a problem or a potential risk.
Step 2: Brainstorm possible consequences of the trend.
Step 3: Brainstorm the secondary or “second-order” consequences related to the
“first-order” consequences you identified earlier. You can continue to expand
the diagram by adding several layers.
Step 4: Calculate the Expected Monetary Value (EMV) of each decision path by
multiplying probability and impact
How to use Futures Wheel Diagram
Step 5: Once the futures wheel is complete you can get an overview of the direct and
indirect consequences of the change you want to implement.
Step 6: Take the negative consequences and identify possible actions you can take to
control them.
Futures Wheel
Template
The process decision program chart (PDPC) help you look into what might
go wrong in a plan that is under development. You can use the chart to
alter your plan in order to prevent the problem from occurring and to
prepare a contingency plan to mitigate the risk.
Planning to Avoid Future Risks
Process Decision Program Chart
Step 1: Create a tree diagram of the plan, listing the objectives, main activities and
the tasks that should be completed under each activity.
Step 2: Take the tasks on the third level and brainstorm what could go wrong
Step 3: If the consequences of the problems identified earlier are insignificant leave
them out. Add the significant problems related to each task on the tree
diagram as a fourth level.
Step 4: Come up with countermeasures for each problem, and add them as a fifth
level to the diagram
How to use Process Decision Program Chart
Step 5: Consider how practical each countermeasure is in terms of time, resources,
cost etc. You can use an X to mark the impractical solution and an O to mark
those that are practical.
Process Decision
Program Chart – PDPC
Template
Risk reward analysis is a tool you can use to evaluate the risk and reward
profile of different options.
Planning to Avoid Future Risks
Risk-Reward Analysis
Step 1: List down the options and possible risks related to them
Step 2: Plot the risks and rewards on the risk-reward analysis chart
Step 3: While some options may have a positive risk-reward profile, take time to see
whether you should spend time on mitigating risks of other options as well
Step 4: Compare each option against one another to identify the best option for you
How to use Risk-Reward Analysis
Risk – Reward Analysis
Template
Want more details on How to draw Deployment Diagrams easily? Visit
https://creately.com/blog/diagrams/risk-management-techniques/
To create use case diagrams, flowcharts and
many more other diagrams visit
https://creately.com
For colorful diagrams and Info-graphics follow us on:

More Related Content

What's hot

Root Cause Analysis
Root Cause AnalysisRoot Cause Analysis
Root Cause Analysis
gatelyw396
 
Module 5 evaluating safety messages and training
Module 5   evaluating safety messages and trainingModule 5   evaluating safety messages and training
Module 5 evaluating safety messages and training
The Windsdor Consulting Group, Inc.
 
Analyze phase of a six sigma dmaic project
Analyze phase of a six sigma dmaic projectAnalyze phase of a six sigma dmaic project
Analyze phase of a six sigma dmaic project
Kumar Satyam
 
Root cause analysis
Root cause analysisRoot cause analysis
Root cause analysis
Root cause analysisRoot cause analysis
Job Hazard Analysis
Job Hazard AnalysisJob Hazard Analysis
Job Hazard Analysis
Tristan Hart
 
#8 Root Cause Analysis
#8 Root Cause Analysis#8 Root Cause Analysis
#8 Root Cause Analysis
suman_purumandla
 
Root Cause Analysis
Root Cause AnalysisRoot Cause Analysis
Root Cause Analysis
mtalhausmani
 
Root cause analysis training
Root cause analysis trainingRoot cause analysis training
Root cause analysis training
Jothilingam Durai
 
Root cause analysis
Root cause analysisRoot cause analysis
Root cause analysis
Mohamed Mosaad Hasan
 
Risk Assessment and Risk Assessment Matrix Presentation
Risk Assessment and Risk Assessment Matrix PresentationRisk Assessment and Risk Assessment Matrix Presentation
Risk Assessment and Risk Assessment Matrix Presentation
Usama Saeed
 
Root cause analysis
Root cause analysisRoot cause analysis
Root cause analysis
Rental Solutions and Services
 
Root cause analysis
Root cause analysisRoot cause analysis
Root cause analysis
Krishnan Lakshmi Narayanan
 
Fishbone and 5 Why webinar 02 11-21
Fishbone and 5 Why webinar 02 11-21Fishbone and 5 Why webinar 02 11-21
Fishbone and 5 Why webinar 02 11-21
Darren Dolcemascolo
 
QuantAware
QuantAwareQuantAware
QuantAware
GerardVoskuil
 
Root cause analysis 1
Root cause analysis 1Root cause analysis 1
Root cause analysis 1
Thandiwe Kgagabi
 
Root Cause Analysis
Root Cause AnalysisRoot Cause Analysis
Root Cause Analysis
Jo Balucanag - Bitonio
 
Intro to Root Cause Analysis
Intro to Root Cause AnalysisIntro to Root Cause Analysis
Intro to Root Cause Analysis
Carmel Khan
 
Risk assessment
Risk assessmentRisk assessment
Risk assessment
PANNALAL SONI
 
A simplified guide to Risk Assessment in Occupational Health & Safety
A simplified guide to Risk Assessment in Occupational Health & SafetyA simplified guide to Risk Assessment in Occupational Health & Safety
A simplified guide to Risk Assessment in Occupational Health & Safety
Wessam Atif
 

What's hot (20)

Root Cause Analysis
Root Cause AnalysisRoot Cause Analysis
Root Cause Analysis
 
Module 5 evaluating safety messages and training
Module 5   evaluating safety messages and trainingModule 5   evaluating safety messages and training
Module 5 evaluating safety messages and training
 
Analyze phase of a six sigma dmaic project
Analyze phase of a six sigma dmaic projectAnalyze phase of a six sigma dmaic project
Analyze phase of a six sigma dmaic project
 
Root cause analysis
Root cause analysisRoot cause analysis
Root cause analysis
 
Root cause analysis
Root cause analysisRoot cause analysis
Root cause analysis
 
Job Hazard Analysis
Job Hazard AnalysisJob Hazard Analysis
Job Hazard Analysis
 
#8 Root Cause Analysis
#8 Root Cause Analysis#8 Root Cause Analysis
#8 Root Cause Analysis
 
Root Cause Analysis
Root Cause AnalysisRoot Cause Analysis
Root Cause Analysis
 
Root cause analysis training
Root cause analysis trainingRoot cause analysis training
Root cause analysis training
 
Root cause analysis
Root cause analysisRoot cause analysis
Root cause analysis
 
Risk Assessment and Risk Assessment Matrix Presentation
Risk Assessment and Risk Assessment Matrix PresentationRisk Assessment and Risk Assessment Matrix Presentation
Risk Assessment and Risk Assessment Matrix Presentation
 
Root cause analysis
Root cause analysisRoot cause analysis
Root cause analysis
 
Root cause analysis
Root cause analysisRoot cause analysis
Root cause analysis
 
Fishbone and 5 Why webinar 02 11-21
Fishbone and 5 Why webinar 02 11-21Fishbone and 5 Why webinar 02 11-21
Fishbone and 5 Why webinar 02 11-21
 
QuantAware
QuantAwareQuantAware
QuantAware
 
Root cause analysis 1
Root cause analysis 1Root cause analysis 1
Root cause analysis 1
 
Root Cause Analysis
Root Cause AnalysisRoot Cause Analysis
Root Cause Analysis
 
Intro to Root Cause Analysis
Intro to Root Cause AnalysisIntro to Root Cause Analysis
Intro to Root Cause Analysis
 
Risk assessment
Risk assessmentRisk assessment
Risk assessment
 
A simplified guide to Risk Assessment in Occupational Health & Safety
A simplified guide to Risk Assessment in Occupational Health & SafetyA simplified guide to Risk Assessment in Occupational Health & Safety
A simplified guide to Risk Assessment in Occupational Health & Safety
 

Similar to Visual tools for Risk Management Process

Risk Management
Risk ManagementRisk Management
Risk Management
Hinal Lunagariya
 
Li Rmp Prep
Li Rmp PrepLi Rmp Prep
Li Rmp Prep
mchlstldr
 
PMI-RMP Exam Prep Presentation
PMI-RMP Exam Prep PresentationPMI-RMP Exam Prep Presentation
PMI-RMP Exam Prep Presentation
scottdreynolds
 
Risk Matrix.docx
Risk Matrix.docxRisk Matrix.docx
Risk Matrix.docx
Shivani54174
 
اهم برزنتيشن لجنك2222
اهم برزنتيشن لجنك2222اهم برزنتيشن لجنك2222
اهم برزنتيشن لجنك2222
nashaat algrara
 
Corporate and Project Risk Management Toolkit
Corporate and Project Risk Management Toolkit Corporate and Project Risk Management Toolkit
Corporate and Project Risk Management Toolkit
Aurelien Domont, MBA
 
PMP Training - 11 project risk management
PMP Training - 11 project risk managementPMP Training - 11 project risk management
PMP Training - 11 project risk management
ejlp12
 
C O N T R O L L P R E S E N T A T I O N
C O N T R O L L  P R E S E N T A T I O NC O N T R O L L  P R E S E N T A T I O N
C O N T R O L L P R E S E N T A T I O N
وديع المخلافي
 
Risk Management
Risk ManagementRisk Management
Risk Management
rajuinstru
 
Quality risk management tools
Quality risk management toolsQuality risk management tools
Quality risk management tools
selinasimpson1901
 
New 7QC tools for the quality person during RCa
New 7QC tools for the quality person during RCaNew 7QC tools for the quality person during RCa
New 7QC tools for the quality person during RCa
AravindhNagaraj1
 
Seven Basic Tools of QC and their Applications
Seven Basic Tools of QC and their ApplicationsSeven Basic Tools of QC and their Applications
Seven Basic Tools of QC and their Applications
DrJayantaKumarMahato1
 
Comprehensive Overview Of Risk Management
Comprehensive Overview Of Risk ManagementComprehensive Overview Of Risk Management
Comprehensive Overview Of Risk Management
Andrew Valenti
 
Project Risk Management
 Project Risk Management Project Risk Management
Project Risk Management
Hayat Denzi
 
concept of evaluation "Character insight"
concept of evaluation "Character insight"concept of evaluation "Character insight"
concept of evaluation "Character insight"
Shafiyazahoor327
 
Session 18 4th edition PMP
Session 18 4th edition PMPSession 18 4th edition PMP
Session 18 4th edition PMP
محمد عصمت عبد الرازق
 
complete any required actions as described in the highlighted are.docx
complete any required actions as described in the highlighted are.docxcomplete any required actions as described in the highlighted are.docx
complete any required actions as described in the highlighted are.docx
mccormicknadine86
 
Enactus O6U '16 Leadership Program: Strategic Thinking (1)
Enactus O6U '16 Leadership Program: Strategic Thinking (1)Enactus O6U '16 Leadership Program: Strategic Thinking (1)
Enactus O6U '16 Leadership Program: Strategic Thinking (1)
Mohamed Dawod
 
7 QC Tools training presentation
7 QC Tools training presentation7 QC Tools training presentation
7 QC Tools training presentation
PRASHANT KSHIRSAGAR
 
Global Health Comparison Grid TemplateGlobal Health Co
Global Health Comparison Grid TemplateGlobal Health CoGlobal Health Comparison Grid TemplateGlobal Health Co
Global Health Comparison Grid TemplateGlobal Health Co
MatthewTennant613
 

Similar to Visual tools for Risk Management Process (20)

Risk Management
Risk ManagementRisk Management
Risk Management
 
Li Rmp Prep
Li Rmp PrepLi Rmp Prep
Li Rmp Prep
 
PMI-RMP Exam Prep Presentation
PMI-RMP Exam Prep PresentationPMI-RMP Exam Prep Presentation
PMI-RMP Exam Prep Presentation
 
Risk Matrix.docx
Risk Matrix.docxRisk Matrix.docx
Risk Matrix.docx
 
اهم برزنتيشن لجنك2222
اهم برزنتيشن لجنك2222اهم برزنتيشن لجنك2222
اهم برزنتيشن لجنك2222
 
Corporate and Project Risk Management Toolkit
Corporate and Project Risk Management Toolkit Corporate and Project Risk Management Toolkit
Corporate and Project Risk Management Toolkit
 
PMP Training - 11 project risk management
PMP Training - 11 project risk managementPMP Training - 11 project risk management
PMP Training - 11 project risk management
 
C O N T R O L L P R E S E N T A T I O N
C O N T R O L L  P R E S E N T A T I O NC O N T R O L L  P R E S E N T A T I O N
C O N T R O L L P R E S E N T A T I O N
 
Risk Management
Risk ManagementRisk Management
Risk Management
 
Quality risk management tools
Quality risk management toolsQuality risk management tools
Quality risk management tools
 
New 7QC tools for the quality person during RCa
New 7QC tools for the quality person during RCaNew 7QC tools for the quality person during RCa
New 7QC tools for the quality person during RCa
 
Seven Basic Tools of QC and their Applications
Seven Basic Tools of QC and their ApplicationsSeven Basic Tools of QC and their Applications
Seven Basic Tools of QC and their Applications
 
Comprehensive Overview Of Risk Management
Comprehensive Overview Of Risk ManagementComprehensive Overview Of Risk Management
Comprehensive Overview Of Risk Management
 
Project Risk Management
 Project Risk Management Project Risk Management
Project Risk Management
 
concept of evaluation "Character insight"
concept of evaluation "Character insight"concept of evaluation "Character insight"
concept of evaluation "Character insight"
 
Session 18 4th edition PMP
Session 18 4th edition PMPSession 18 4th edition PMP
Session 18 4th edition PMP
 
complete any required actions as described in the highlighted are.docx
complete any required actions as described in the highlighted are.docxcomplete any required actions as described in the highlighted are.docx
complete any required actions as described in the highlighted are.docx
 
Enactus O6U '16 Leadership Program: Strategic Thinking (1)
Enactus O6U '16 Leadership Program: Strategic Thinking (1)Enactus O6U '16 Leadership Program: Strategic Thinking (1)
Enactus O6U '16 Leadership Program: Strategic Thinking (1)
 
7 QC Tools training presentation
7 QC Tools training presentation7 QC Tools training presentation
7 QC Tools training presentation
 
Global Health Comparison Grid TemplateGlobal Health Co
Global Health Comparison Grid TemplateGlobal Health CoGlobal Health Comparison Grid TemplateGlobal Health Co
Global Health Comparison Grid TemplateGlobal Health Co
 

More from Creately

The Impact of Covid-19 on Education
The Impact of Covid-19 on EducationThe Impact of Covid-19 on Education
The Impact of Covid-19 on Education
Creately
 
Deployment Diagram Example Templates
Deployment Diagram Example TemplatesDeployment Diagram Example Templates
Deployment Diagram Example Templates
Creately
 
Workflow Diagram Examples and Templates
Workflow Diagram Examples and TemplatesWorkflow Diagram Examples and Templates
Workflow Diagram Examples and Templates
Creately
 
Component Diagram Example Templates
Component Diagram Example TemplatesComponent Diagram Example Templates
Component Diagram Example Templates
Creately
 
SWOT Analysis Example Diagrams with Editable Templates
SWOT Analysis Example Diagrams with Editable TemplatesSWOT Analysis Example Diagrams with Editable Templates
SWOT Analysis Example Diagrams with Editable Templates
Creately
 
Gantt Chart Examples with Editable Templates
Gantt Chart Examples with Editable TemplatesGantt Chart Examples with Editable Templates
Gantt Chart Examples with Editable Templates
Creately
 
Block Diagram Examples with Editable Templates
Block Diagram Examples with Editable TemplatesBlock Diagram Examples with Editable Templates
Block Diagram Examples with Editable Templates
Creately
 
Flowchart Examples with Editable Templates
Flowchart Examples with Editable TemplatesFlowchart Examples with Editable Templates
Flowchart Examples with Editable Templates
Creately
 
Improve Organizational Performance Using Diagrams by Creately
Improve Organizational Performance Using Diagrams by CreatelyImprove Organizational Performance Using Diagrams by Creately
Improve Organizational Performance Using Diagrams by Creately
Creately
 
Activity Diagram Examples by Creately
Activity Diagram Examples by Creately Activity Diagram Examples by Creately
Activity Diagram Examples by Creately
Creately
 
The Ultimate Guide for UML Class Diagrams by Creately
The Ultimate Guide for UML Class Diagrams by CreatelyThe Ultimate Guide for UML Class Diagrams by Creately
The Ultimate Guide for UML Class Diagrams by Creately
Creately
 
iOS Mockup Templates by Creately
iOS Mockup Templates by CreatelyiOS Mockup Templates by Creately
iOS Mockup Templates by Creately
Creately
 
Optimize Sales Processes Using Diagrams by Creately
Optimize Sales Processes Using Diagrams by CreatelyOptimize Sales Processes Using Diagrams by Creately
Optimize Sales Processes Using Diagrams by Creately
Creately
 
Infographic Templates by Creately
Infographic Templates by CreatelyInfographic Templates by Creately
Infographic Templates by Creately
Creately
 
Conversion Optimization Plan Tools
Conversion Optimization Plan ToolsConversion Optimization Plan Tools
Conversion Optimization Plan Tools
Creately
 
Essential HR Diagram Templates by Creately
Essential HR Diagram Templates by CreatelyEssential HR Diagram Templates by Creately
Essential HR Diagram Templates by Creately
Creately
 
Concept Map Templates by Creately
Concept Map Templates by CreatelyConcept Map Templates by Creately
Concept Map Templates by Creately
Creately
 
Change Management Tools
Change Management ToolsChange Management Tools
Change Management Tools
Creately
 
Marketing Strategy Planning Tools
Marketing Strategy Planning ToolsMarketing Strategy Planning Tools
Marketing Strategy Planning Tools
Creately
 
The Ultimate Sequence Diagram Tutorial
The Ultimate Sequence Diagram TutorialThe Ultimate Sequence Diagram Tutorial
The Ultimate Sequence Diagram Tutorial
Creately
 

More from Creately (20)

The Impact of Covid-19 on Education
The Impact of Covid-19 on EducationThe Impact of Covid-19 on Education
The Impact of Covid-19 on Education
 
Deployment Diagram Example Templates
Deployment Diagram Example TemplatesDeployment Diagram Example Templates
Deployment Diagram Example Templates
 
Workflow Diagram Examples and Templates
Workflow Diagram Examples and TemplatesWorkflow Diagram Examples and Templates
Workflow Diagram Examples and Templates
 
Component Diagram Example Templates
Component Diagram Example TemplatesComponent Diagram Example Templates
Component Diagram Example Templates
 
SWOT Analysis Example Diagrams with Editable Templates
SWOT Analysis Example Diagrams with Editable TemplatesSWOT Analysis Example Diagrams with Editable Templates
SWOT Analysis Example Diagrams with Editable Templates
 
Gantt Chart Examples with Editable Templates
Gantt Chart Examples with Editable TemplatesGantt Chart Examples with Editable Templates
Gantt Chart Examples with Editable Templates
 
Block Diagram Examples with Editable Templates
Block Diagram Examples with Editable TemplatesBlock Diagram Examples with Editable Templates
Block Diagram Examples with Editable Templates
 
Flowchart Examples with Editable Templates
Flowchart Examples with Editable TemplatesFlowchart Examples with Editable Templates
Flowchart Examples with Editable Templates
 
Improve Organizational Performance Using Diagrams by Creately
Improve Organizational Performance Using Diagrams by CreatelyImprove Organizational Performance Using Diagrams by Creately
Improve Organizational Performance Using Diagrams by Creately
 
Activity Diagram Examples by Creately
Activity Diagram Examples by Creately Activity Diagram Examples by Creately
Activity Diagram Examples by Creately
 
The Ultimate Guide for UML Class Diagrams by Creately
The Ultimate Guide for UML Class Diagrams by CreatelyThe Ultimate Guide for UML Class Diagrams by Creately
The Ultimate Guide for UML Class Diagrams by Creately
 
iOS Mockup Templates by Creately
iOS Mockup Templates by CreatelyiOS Mockup Templates by Creately
iOS Mockup Templates by Creately
 
Optimize Sales Processes Using Diagrams by Creately
Optimize Sales Processes Using Diagrams by CreatelyOptimize Sales Processes Using Diagrams by Creately
Optimize Sales Processes Using Diagrams by Creately
 
Infographic Templates by Creately
Infographic Templates by CreatelyInfographic Templates by Creately
Infographic Templates by Creately
 
Conversion Optimization Plan Tools
Conversion Optimization Plan ToolsConversion Optimization Plan Tools
Conversion Optimization Plan Tools
 
Essential HR Diagram Templates by Creately
Essential HR Diagram Templates by CreatelyEssential HR Diagram Templates by Creately
Essential HR Diagram Templates by Creately
 
Concept Map Templates by Creately
Concept Map Templates by CreatelyConcept Map Templates by Creately
Concept Map Templates by Creately
 
Change Management Tools
Change Management ToolsChange Management Tools
Change Management Tools
 
Marketing Strategy Planning Tools
Marketing Strategy Planning ToolsMarketing Strategy Planning Tools
Marketing Strategy Planning Tools
 
The Ultimate Sequence Diagram Tutorial
The Ultimate Sequence Diagram TutorialThe Ultimate Sequence Diagram Tutorial
The Ultimate Sequence Diagram Tutorial
 

Recently uploaded

一比一原版美国俄勒冈大学毕业证(UO,UofO学位证)如何办理
一比一原版美国俄勒冈大学毕业证(UO,UofO学位证)如何办理一比一原版美国俄勒冈大学毕业证(UO,UofO学位证)如何办理
一比一原版美国俄勒冈大学毕业证(UO,UofO学位证)如何办理
lyurzi7r
 
一比一原版(brunel毕业证书)布鲁内尔大学毕业证如何办理
一比一原版(brunel毕业证书)布鲁内尔大学毕业证如何办理一比一原版(brunel毕业证书)布鲁内尔大学毕业证如何办理
一比一原版(brunel毕业证书)布鲁内尔大学毕业证如何办理
aprhf21y
 
原版制作(MDIS毕业证书)新加坡管理发展学院毕业证学位证一模一样
原版制作(MDIS毕业证书)新加坡管理发展学院毕业证学位证一模一样原版制作(MDIS毕业证书)新加坡管理发展学院毕业证学位证一模一样
原版制作(MDIS毕业证书)新加坡管理发展学院毕业证学位证一模一样
hw2xf1m
 
一比一原版(UW毕业证书)华盛顿大学毕业证如何办理
一比一原版(UW毕业证书)华盛顿大学毕业证如何办理一比一原版(UW毕业证书)华盛顿大学毕业证如何办理
一比一原版(UW毕业证书)华盛顿大学毕业证如何办理
i990go7o
 
一比一原版英国伦敦政治经济学院毕业证(LSE学位证)如何办理
一比一原版英国伦敦政治经济学院毕业证(LSE学位证)如何办理一比一原版英国伦敦政治经济学院毕业证(LSE学位证)如何办理
一比一原版英国伦敦政治经济学院毕业证(LSE学位证)如何办理
k4krdgxx
 
一比一原版(UC毕业证书)堪培拉大学毕业证如何办理
一比一原版(UC毕业证书)堪培拉大学毕业证如何办理一比一原版(UC毕业证书)堪培拉大学毕业证如何办理
一比一原版(UC毕业证书)堪培拉大学毕业证如何办理
wkip62b
 
一比一原版(Hull毕业证)英国哈珀亚当斯大学毕业证如何办理
一比一原版(Hull毕业证)英国哈珀亚当斯大学毕业证如何办理一比一原版(Hull毕业证)英国哈珀亚当斯大学毕业证如何办理
一比一原版(Hull毕业证)英国哈珀亚当斯大学毕业证如何办理
aonx8o5f
 
Getting Data Ready for Culture Hack by Neontribe
Getting Data Ready for Culture Hack by NeontribeGetting Data Ready for Culture Hack by Neontribe
Getting Data Ready for Culture Hack by Neontribe
Harry Harrold
 
一比一原版(Teesside毕业证)英国提赛德大学毕业证如何办理
一比一原版(Teesside毕业证)英国提赛德大学毕业证如何办理一比一原版(Teesside毕业证)英国提赛德大学毕业证如何办理
一比一原版(Teesside毕业证)英国提赛德大学毕业证如何办理
mfria419
 
一比一原版(OU毕业证)美国俄克拉荷马大学毕业证如何办理
一比一原版(OU毕业证)美国俄克拉荷马大学毕业证如何办理一比一原版(OU毕业证)美国俄克拉荷马大学毕业证如何办理
一比一原版(OU毕业证)美国俄克拉荷马大学毕业证如何办理
67n7f53
 
欧洲杯足彩-欧洲杯足彩买球软件-欧洲杯足彩买球软件下载|【​网址​🎉ac123.net🎉​】
欧洲杯足彩-欧洲杯足彩买球软件-欧洲杯足彩买球软件下载|【​网址​🎉ac123.net🎉​】欧洲杯足彩-欧洲杯足彩买球软件-欧洲杯足彩买球软件下载|【​网址​🎉ac123.net🎉​】
欧洲杯足彩-欧洲杯足彩买球软件-欧洲杯足彩买球软件下载|【​网址​🎉ac123.net🎉​】
batchelorerbm45967
 
一比一原版马来西亚世纪大学毕业证成绩单一模一样
一比一原版马来西亚世纪大学毕业证成绩单一模一样一比一原版马来西亚世纪大学毕业证成绩单一模一样
一比一原版马来西亚世纪大学毕业证成绩单一模一样
k4krdgxx
 
一比一原版(ucb毕业证书)英国伯明翰大学学院毕业证如何办理
一比一原版(ucb毕业证书)英国伯明翰大学学院毕业证如何办理一比一原版(ucb毕业证书)英国伯明翰大学学院毕业证如何办理
一比一原版(ucb毕业证书)英国伯明翰大学学院毕业证如何办理
qbydc
 
一比一原版(UCB毕业证)英国伯明翰大学学院毕业证如何办理
一比一原版(UCB毕业证)英国伯明翰大学学院毕业证如何办理一比一原版(UCB毕业证)英国伯明翰大学学院毕业证如何办理
一比一原版(UCB毕业证)英国伯明翰大学学院毕业证如何办理
zv943dhb
 
一比一原版(USQ毕业证书)南昆士兰大学毕业证如何办理
一比一原版(USQ毕业证书)南昆士兰大学毕业证如何办理一比一原版(USQ毕业证书)南昆士兰大学毕业证如何办理
一比一原版(USQ毕业证书)南昆士兰大学毕业证如何办理
p74xokfq
 
欧洲杯买球-欧洲杯买球买球网好的网站-欧洲杯买球哪里有正规的买球网站|【​网址​🎉ac123.net🎉​】
欧洲杯买球-欧洲杯买球买球网好的网站-欧洲杯买球哪里有正规的买球网站|【​网址​🎉ac123.net🎉​】欧洲杯买球-欧洲杯买球买球网好的网站-欧洲杯买球哪里有正规的买球网站|【​网址​🎉ac123.net🎉​】
欧洲杯买球-欧洲杯买球买球网好的网站-欧洲杯买球哪里有正规的买球网站|【​网址​🎉ac123.net🎉​】
jafiradnan336
 
一比一原版南安普顿索伦特大学毕业证Southampton成绩单一模一样
一比一原版南安普顿索伦特大学毕业证Southampton成绩单一模一样一比一原版南安普顿索伦特大学毕业证Southampton成绩单一模一样
一比一原版南安普顿索伦特大学毕业证Southampton成绩单一模一样
3vgr39kx
 
Intel-Centrino-Mobile-Technology-guidelines
Intel-Centrino-Mobile-Technology-guidelinesIntel-Centrino-Mobile-Technology-guidelines
Intel-Centrino-Mobile-Technology-guidelines
EricHo305923
 
一比一原版(UVM毕业证)佛蒙特大学毕业证如何办理
一比一原版(UVM毕业证)佛蒙特大学毕业证如何办理一比一原版(UVM毕业证)佛蒙特大学毕业证如何办理
一比一原版(UVM毕业证)佛蒙特大学毕业证如何办理
yeytf
 
一比一原版马里兰大学毕业证(UMD毕业证书)如何办理
一比一原版马里兰大学毕业证(UMD毕业证书)如何办理一比一原版马里兰大学毕业证(UMD毕业证书)如何办理
一比一原版马里兰大学毕业证(UMD毕业证书)如何办理
9lq7ultg
 

Recently uploaded (20)

一比一原版美国俄勒冈大学毕业证(UO,UofO学位证)如何办理
一比一原版美国俄勒冈大学毕业证(UO,UofO学位证)如何办理一比一原版美国俄勒冈大学毕业证(UO,UofO学位证)如何办理
一比一原版美国俄勒冈大学毕业证(UO,UofO学位证)如何办理
 
一比一原版(brunel毕业证书)布鲁内尔大学毕业证如何办理
一比一原版(brunel毕业证书)布鲁内尔大学毕业证如何办理一比一原版(brunel毕业证书)布鲁内尔大学毕业证如何办理
一比一原版(brunel毕业证书)布鲁内尔大学毕业证如何办理
 
原版制作(MDIS毕业证书)新加坡管理发展学院毕业证学位证一模一样
原版制作(MDIS毕业证书)新加坡管理发展学院毕业证学位证一模一样原版制作(MDIS毕业证书)新加坡管理发展学院毕业证学位证一模一样
原版制作(MDIS毕业证书)新加坡管理发展学院毕业证学位证一模一样
 
一比一原版(UW毕业证书)华盛顿大学毕业证如何办理
一比一原版(UW毕业证书)华盛顿大学毕业证如何办理一比一原版(UW毕业证书)华盛顿大学毕业证如何办理
一比一原版(UW毕业证书)华盛顿大学毕业证如何办理
 
一比一原版英国伦敦政治经济学院毕业证(LSE学位证)如何办理
一比一原版英国伦敦政治经济学院毕业证(LSE学位证)如何办理一比一原版英国伦敦政治经济学院毕业证(LSE学位证)如何办理
一比一原版英国伦敦政治经济学院毕业证(LSE学位证)如何办理
 
一比一原版(UC毕业证书)堪培拉大学毕业证如何办理
一比一原版(UC毕业证书)堪培拉大学毕业证如何办理一比一原版(UC毕业证书)堪培拉大学毕业证如何办理
一比一原版(UC毕业证书)堪培拉大学毕业证如何办理
 
一比一原版(Hull毕业证)英国哈珀亚当斯大学毕业证如何办理
一比一原版(Hull毕业证)英国哈珀亚当斯大学毕业证如何办理一比一原版(Hull毕业证)英国哈珀亚当斯大学毕业证如何办理
一比一原版(Hull毕业证)英国哈珀亚当斯大学毕业证如何办理
 
Getting Data Ready for Culture Hack by Neontribe
Getting Data Ready for Culture Hack by NeontribeGetting Data Ready for Culture Hack by Neontribe
Getting Data Ready for Culture Hack by Neontribe
 
一比一原版(Teesside毕业证)英国提赛德大学毕业证如何办理
一比一原版(Teesside毕业证)英国提赛德大学毕业证如何办理一比一原版(Teesside毕业证)英国提赛德大学毕业证如何办理
一比一原版(Teesside毕业证)英国提赛德大学毕业证如何办理
 
一比一原版(OU毕业证)美国俄克拉荷马大学毕业证如何办理
一比一原版(OU毕业证)美国俄克拉荷马大学毕业证如何办理一比一原版(OU毕业证)美国俄克拉荷马大学毕业证如何办理
一比一原版(OU毕业证)美国俄克拉荷马大学毕业证如何办理
 
欧洲杯足彩-欧洲杯足彩买球软件-欧洲杯足彩买球软件下载|【​网址​🎉ac123.net🎉​】
欧洲杯足彩-欧洲杯足彩买球软件-欧洲杯足彩买球软件下载|【​网址​🎉ac123.net🎉​】欧洲杯足彩-欧洲杯足彩买球软件-欧洲杯足彩买球软件下载|【​网址​🎉ac123.net🎉​】
欧洲杯足彩-欧洲杯足彩买球软件-欧洲杯足彩买球软件下载|【​网址​🎉ac123.net🎉​】
 
一比一原版马来西亚世纪大学毕业证成绩单一模一样
一比一原版马来西亚世纪大学毕业证成绩单一模一样一比一原版马来西亚世纪大学毕业证成绩单一模一样
一比一原版马来西亚世纪大学毕业证成绩单一模一样
 
一比一原版(ucb毕业证书)英国伯明翰大学学院毕业证如何办理
一比一原版(ucb毕业证书)英国伯明翰大学学院毕业证如何办理一比一原版(ucb毕业证书)英国伯明翰大学学院毕业证如何办理
一比一原版(ucb毕业证书)英国伯明翰大学学院毕业证如何办理
 
一比一原版(UCB毕业证)英国伯明翰大学学院毕业证如何办理
一比一原版(UCB毕业证)英国伯明翰大学学院毕业证如何办理一比一原版(UCB毕业证)英国伯明翰大学学院毕业证如何办理
一比一原版(UCB毕业证)英国伯明翰大学学院毕业证如何办理
 
一比一原版(USQ毕业证书)南昆士兰大学毕业证如何办理
一比一原版(USQ毕业证书)南昆士兰大学毕业证如何办理一比一原版(USQ毕业证书)南昆士兰大学毕业证如何办理
一比一原版(USQ毕业证书)南昆士兰大学毕业证如何办理
 
欧洲杯买球-欧洲杯买球买球网好的网站-欧洲杯买球哪里有正规的买球网站|【​网址​🎉ac123.net🎉​】
欧洲杯买球-欧洲杯买球买球网好的网站-欧洲杯买球哪里有正规的买球网站|【​网址​🎉ac123.net🎉​】欧洲杯买球-欧洲杯买球买球网好的网站-欧洲杯买球哪里有正规的买球网站|【​网址​🎉ac123.net🎉​】
欧洲杯买球-欧洲杯买球买球网好的网站-欧洲杯买球哪里有正规的买球网站|【​网址​🎉ac123.net🎉​】
 
一比一原版南安普顿索伦特大学毕业证Southampton成绩单一模一样
一比一原版南安普顿索伦特大学毕业证Southampton成绩单一模一样一比一原版南安普顿索伦特大学毕业证Southampton成绩单一模一样
一比一原版南安普顿索伦特大学毕业证Southampton成绩单一模一样
 
Intel-Centrino-Mobile-Technology-guidelines
Intel-Centrino-Mobile-Technology-guidelinesIntel-Centrino-Mobile-Technology-guidelines
Intel-Centrino-Mobile-Technology-guidelines
 
一比一原版(UVM毕业证)佛蒙特大学毕业证如何办理
一比一原版(UVM毕业证)佛蒙特大学毕业证如何办理一比一原版(UVM毕业证)佛蒙特大学毕业证如何办理
一比一原版(UVM毕业证)佛蒙特大学毕业证如何办理
 
一比一原版马里兰大学毕业证(UMD毕业证书)如何办理
一比一原版马里兰大学毕业证(UMD毕业证书)如何办理一比一原版马里兰大学毕业证(UMD毕业证书)如何办理
一比一原版马里兰大学毕业证(UMD毕业证书)如何办理
 

Visual tools for Risk Management Process

  • 1.
  • 2.
  • 3.
  • 4. The best way to reduce the negative impact risks may have on your business is to incorporate risk management techniques into your business structure. This is a guide of visual risk management techniques that you can use during each stage of your risk management strategy. The Visual Risk Management Techniques • Help to identify projects that might be headed toward trouble and apply solutions • Help to prepare for unexpected threats beforehand • Help to provide enough data to make better decisions regarding projects/ events • Help to improve communication between stakeholders and project teams • Help teams stay more focused on the key outcomes
  • 5. The risk management process begins with identifying risks in advance once you have set the goal. Identifying risks should be done early in a project and shouldn’t be done in the middle of or during a project, as it may be too late. Identifying risks can be done in 2 ways; • By identifying root causes and the impact they may have • By identifying the essential functions the company must perform to reach a goal and identifying how they can fail Identify Risks
  • 6. Decision trees are used to make decisions when you are faced with multiple options. It allows you to assess the values of outcomes and possibilities of achieving them. This, in turn, helps make a better decision. Identify Risks Decision Tree Diagram
  • 7. Step 1: Identify decisions and prepare a decision tree diagram based on decisions, costs, and rewards of uncertain options available to you. Step 2: Figure out the probability of a risk occurring and assign it Step 3: In this step you have to identify the monetary value of the risk, or in other words how much it would cost you if the risk is to occur Step 4: Calculate the Expected Monetary Value (EMV) of each decision path by multiplying probability and impact How to use Decision Tree Diagram
  • 10. Decision Tree Diagram With 6 Outcomes
  • 11. An influence diagram is used to represent the summary of information of a decision tree. It shows variables that are known and unknown when making a decision and the relationships that exist among them. Identify Risks Influence Diagram
  • 12. Step 1: Identify the decisions to be made to reach your objective Step 2: Consider the risks and performance factors that may have an influence on achieving your objective. Step 3: Recognize secondary factors that affect uncertainty associated with the performance factors. Step 4: Identify second-order risk factors that can influence secondary factors. How to use Influence Diagram Step 5: Continue to figure out what factors influence uncertainty until all key risks are identified.
  • 13. Influence Diagram for Risk Management
  • 14. Whether you are planning a new project or developing a new process, a SWOT Analysis can help you get insight into any risks that may occur. It helps you identify the Strengths, Weaknesses, Threats and Opportunities associated with the event. Identify Risks SWOT Analysis
  • 15. Step 1: The first step is to list down your strengths. Knowing these will help you to be more confident. Step 2: The second step is to identify your weaknesses. Identifying weaknesses is the best way to improve them. Step 3: Opportunities come in different shapes and forms. Sometimes opportunities past by you without you even noticing them. Step 4: When doing a personal SWOT analysis you need to think of yourself as a company or a product and assess yourself against others. How to use SWOT Analysis
  • 16. SWOT Analysis of Tourism Industry
  • 19. Also known as the Ishikawa diagram and the cause and effect diagram, the fishbone diagram is used to break apart a problem and identify the root causes behind it. It works backward as it helps identify the causes of a certain effect. Identify Risks Fishbone Diagram
  • 23. Process maps help visualize the major steps and relationships between them in a process. By having the people who actually perform it outline the process using a process map, you can check for its accuracy. This also helps identify bottlenecks and blockers in advance. Identify Risks Process Maps
  • 24. Step 1: Identify the team you need to map – whether its a new process or a process being redesigned Step 2: Bring together everyone who is involved in performing/ developing the process and brainstorm all information related to the process, such as inputs, outputs etc. Step 3: Take the steps you identified and put them in a sequential order Step 4: Draw a map that shows the current state of the process How to use Process Maps Step 5: Identify the bottlenecks and flaws in your process
  • 25. Process Map for Risk Management Template
  • 26. Once you have identified the risks, the next step is to assess the risks to see what kind of an impact they have on your business and current projects. By correctly analyzing the risks, you will be able to prioritize as to which risk has the highest impact on your business. Analyzing risks can be done in two ways • Qualitative risk analysis – here the risks are analyzed based on the likelihood of them occurring and the impact they may have on projects, business etc. • Quantitative risk analysis – quantifies the possible outcomes and evaluate the probability of achieving objects Analyze the Identified Risk
  • 27. This is a tool that can be used to do a qualitative risk assessment. It helps to evaluate the relative impact (high or low) of a risk and the probability of its occurrence (high or low). Analyze the Identified Risk Risk Probability and Impact Matrix
  • 28. Risk Probability and Impact Matrix Template
  • 29. Pareto diagrams are a great way to identify which problems should be prioritized based on the cumulative effect it has on a system. While the length of the bars represents the frequency or cost (time or money), the bars are arranged with the longest bars to the right and shortest bars to the right. This way it depicts which situation is the most significant. Analyze the Identified Risk Pareto Chart
  • 30. Step 1: Identify the categories you want to use to group the items, and the measurements (i.e. frequency, cost, time etc.) Step 2: Decide the period of time (an hour, week or day etc.) you want the Pareto chart to cover Step 3: Collect the data along with the category and subtotal the measurements for each category Step 4: Determine the right scale for the measurements and mark the scale on the left side of the chart How to use Pareto Chart Step 5: Label bars for each category, placing the tallest at the far left Step 6: Calculate the percentage for each category Step 7: Calculate and draw cumulative sums
  • 31. Risk Probability and Impact Matrix Template
  • 32. The fault tree analysis helps to identify the probabilities of various outcomes from given faults and failures. The fault tree analysis helps to identify the likelihood of an event occurring by visualizing a certain event at a top and the conditions causing that event. Analyze the Identified Risk Fault Tree Analysis
  • 33. Step 1: Identify the fault/ failure that should be analyzed Step 2: List down the immediate or direct causes of the fault. Thoroughly examine each step until the root causes are analyzed Step 3: Once you apply the data to the fault tree, use it to do the evaluation How to use Pareto Chart
  • 34. Fault Tree Analysis Diagram Template
  • 35. In the planning phase of the risk management cycle, you need to pay attention to mitigating risks by finding solutions and controlling them. Starting from the risks that have the most severe impact on your projects or organization, find out how to minimize their effect. Planning to Avoid Future Risks
  • 36. Futures wheel is a tool that you can use to identify direct and indirect results of a certain trend, event or decision. Planning to Avoid Future Risks Futures Wheel Diagram
  • 37. Step 1: Identify the change. This could be a problem or a potential risk. Step 2: Brainstorm possible consequences of the trend. Step 3: Brainstorm the secondary or “second-order” consequences related to the “first-order” consequences you identified earlier. You can continue to expand the diagram by adding several layers. Step 4: Calculate the Expected Monetary Value (EMV) of each decision path by multiplying probability and impact How to use Futures Wheel Diagram Step 5: Once the futures wheel is complete you can get an overview of the direct and indirect consequences of the change you want to implement. Step 6: Take the negative consequences and identify possible actions you can take to control them.
  • 39. The process decision program chart (PDPC) help you look into what might go wrong in a plan that is under development. You can use the chart to alter your plan in order to prevent the problem from occurring and to prepare a contingency plan to mitigate the risk. Planning to Avoid Future Risks Process Decision Program Chart
  • 40. Step 1: Create a tree diagram of the plan, listing the objectives, main activities and the tasks that should be completed under each activity. Step 2: Take the tasks on the third level and brainstorm what could go wrong Step 3: If the consequences of the problems identified earlier are insignificant leave them out. Add the significant problems related to each task on the tree diagram as a fourth level. Step 4: Come up with countermeasures for each problem, and add them as a fifth level to the diagram How to use Process Decision Program Chart Step 5: Consider how practical each countermeasure is in terms of time, resources, cost etc. You can use an X to mark the impractical solution and an O to mark those that are practical.
  • 41. Process Decision Program Chart – PDPC Template
  • 42. Risk reward analysis is a tool you can use to evaluate the risk and reward profile of different options. Planning to Avoid Future Risks Risk-Reward Analysis
  • 43. Step 1: List down the options and possible risks related to them Step 2: Plot the risks and rewards on the risk-reward analysis chart Step 3: While some options may have a positive risk-reward profile, take time to see whether you should spend time on mitigating risks of other options as well Step 4: Compare each option against one another to identify the best option for you How to use Risk-Reward Analysis
  • 44. Risk – Reward Analysis Template
  • 45. Want more details on How to draw Deployment Diagrams easily? Visit https://creately.com/blog/diagrams/risk-management-techniques/ To create use case diagrams, flowcharts and many more other diagrams visit https://creately.com For colorful diagrams and Info-graphics follow us on: