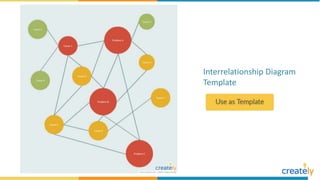
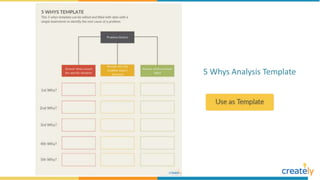
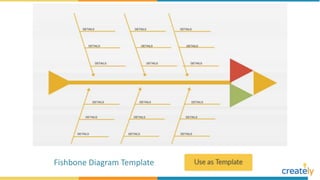
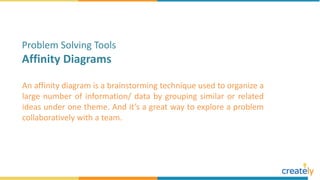
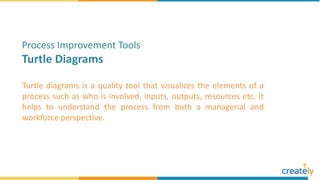
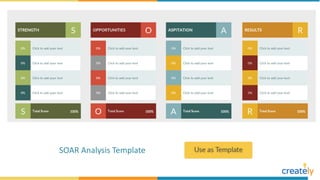
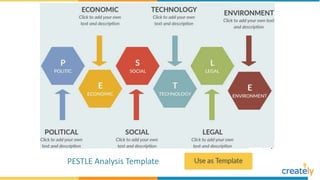
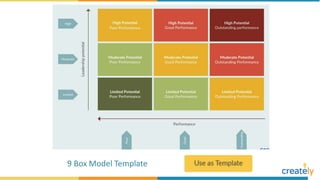
The goal of every organization is to reach its peak performance level
efficiently. If you have the necessary tools and techniques to identify
performance issues, isolate the root causes, improve processes and
provide the right employee performance interventions, this could be
done in a cost-effective manner.
Improve Organizational Performance using
Diagrams with Creately
An interrelationship diagram visualizes the cause-and-effect
relationships that exist within a set of issues. If you are trying to
figure out the causal relationship behind a problem, this tool could
help you out.
Problem Solving Tools
Interrelationship Diagrams
Interrelationship Diagram
Template
Root cause analysis is another tool that is used to identify the root
cause of a problem. It helps you get to the bottom of an issue and
find permanent solutions.
Problem Solving Tools
Root Cause Analysis
5 Whys Analysis Template
Fishbone (aka Cause and effect/Ishikawa) diagrams are great for
analyzing processes and identifying defects in them. They are a
great way to visualize causes and their effects. Fishbone diagrams
are used in many industries but primarily they’re used in
manufacturing, sales, and marketing.
Problem Solving Tools
Causes And Effect Diagram/Fishbone diagram
Fishbone Diagram Template
An affinity diagram is a brainstorming technique used to organize a
large number of information/ data by grouping similar or related
ideas under one theme. And it’s a great way to explore a problem
collaboratively with a team.
Problem Solving Tools
Affinity Diagrams
Affinity Diagram Template
Turtle diagrams is a quality tool that visualizes the elements of a
process such as who is involved, inputs, outputs, resources etc. It
helps to understand the process from both a managerial and
workforce perspective.
Process Improvement Tools
Turtle Diagrams
Turtle Diagram Template
Scenario planning is a tool that you can use to make assumptions
about the future and how your organizational environment will
change accordingly. Basically, with scenario planning, you can
picture different realities your business can be facing in the future.
This will help you come up with responses to successfully face
each alternative reality.
Strategic Planning Tools
Scenario Planning Template
SOAR stands for Strengths, Opportunities, Aspirations, and Results.
It’s a strategic planning framework that helps an organization focus
on what they are doing well, what should be improved and what
stakeholders are most interested in.
Strategic Planning Tools
SOAR Analysis Template
PESTLE analysis helps identify and analyze the key external factors
or the macro forces that affect an organization. During a PESTLE
analysis, you should examine and identify changes in each of the
following areas.
Strategic Planning Tools
PESTLE Analysis
PESTLE Analysis Template
9-box model is a great tool for succession planning and
development. The idea behind the matrix is that by figuring out
how all employees fit into the grid, the company can understand
where each employee belong and how they should be positioned
during the organizational changes that will occur in the future.
Employee Performance Improvement Tools
9-Box Model
9 Box Model Template
GROW model is a helpful tool to structure your employee coaching
or mentoring sessions. It helps a person clarify what he wants to
achieve and how he will achieve it.
Employee Performance Improvement Tools
GROW Model
GROW Model Template
Want more details on How to Improve Organizational Performance ? Visit
https://creately.com/blog/diagrams/improve-organizational-performance/
To draw these diagrams, use case diagrams, flowcharts and
many more other diagrams visit
https://creately.com
For colorful diagrams and Info-graphics follow us on:

Improve Organizational Performance Using Diagrams by Creately

  • 4.
    The goal ofevery organization is to reach its peak performance level efficiently. If you have the necessary tools and techniques to identify performance issues, isolate the root causes, improve processes and provide the right employee performance interventions, this could be done in a cost-effective manner. Improve Organizational Performance using Diagrams with Creately
  • 5.
    An interrelationship diagramvisualizes the cause-and-effect relationships that exist within a set of issues. If you are trying to figure out the causal relationship behind a problem, this tool could help you out. Problem Solving Tools Interrelationship Diagrams
  • 6.
  • 7.
    Root cause analysisis another tool that is used to identify the root cause of a problem. It helps you get to the bottom of an issue and find permanent solutions. Problem Solving Tools Root Cause Analysis
  • 8.
  • 9.
    Fishbone (aka Causeand effect/Ishikawa) diagrams are great for analyzing processes and identifying defects in them. They are a great way to visualize causes and their effects. Fishbone diagrams are used in many industries but primarily they’re used in manufacturing, sales, and marketing. Problem Solving Tools Causes And Effect Diagram/Fishbone diagram
  • 10.
  • 11.
    An affinity diagramis a brainstorming technique used to organize a large number of information/ data by grouping similar or related ideas under one theme. And it’s a great way to explore a problem collaboratively with a team. Problem Solving Tools Affinity Diagrams
  • 12.
  • 13.
    Turtle diagrams isa quality tool that visualizes the elements of a process such as who is involved, inputs, outputs, resources etc. It helps to understand the process from both a managerial and workforce perspective. Process Improvement Tools Turtle Diagrams
  • 14.
  • 15.
    Scenario planning isa tool that you can use to make assumptions about the future and how your organizational environment will change accordingly. Basically, with scenario planning, you can picture different realities your business can be facing in the future. This will help you come up with responses to successfully face each alternative reality. Strategic Planning Tools Scenario Planning Template
  • 16.
  • 17.
    SOAR stands forStrengths, Opportunities, Aspirations, and Results. It’s a strategic planning framework that helps an organization focus on what they are doing well, what should be improved and what stakeholders are most interested in. Strategic Planning Tools SOAR Analysis Template
  • 18.
  • 19.
    PESTLE analysis helpsidentify and analyze the key external factors or the macro forces that affect an organization. During a PESTLE analysis, you should examine and identify changes in each of the following areas. Strategic Planning Tools PESTLE Analysis
  • 20.
  • 21.
    9-box model isa great tool for succession planning and development. The idea behind the matrix is that by figuring out how all employees fit into the grid, the company can understand where each employee belong and how they should be positioned during the organizational changes that will occur in the future. Employee Performance Improvement Tools 9-Box Model
  • 22.
    9 Box ModelTemplate
  • 23.
    GROW model isa helpful tool to structure your employee coaching or mentoring sessions. It helps a person clarify what he wants to achieve and how he will achieve it. Employee Performance Improvement Tools GROW Model
  • 24.
  • 25.
    Want more detailson How to Improve Organizational Performance ? Visit https://creately.com/blog/diagrams/improve-organizational-performance/ To draw these diagrams, use case diagrams, flowcharts and many more other diagrams visit https://creately.com For colorful diagrams and Info-graphics follow us on: