Downloaded 654 times


![The MethodFeatures: Multiscale Contrast (Done!)Center surround histogram (Mostly Done!) (Done!)Color spatial distribution (Done!)Supervised learning using Conditional Random Fields to determine the parameters to combine the features obtained above. (Done!) [I will use a labeled dataset of 5000 images provided by Microsoft Research Asia!]](https://image.slidesharecdn.com/recognition-projectupdate2-091218220741-phpapp02/85/Visual-Saliency-Learning-to-Detect-Salient-Objects-5-320.jpg)


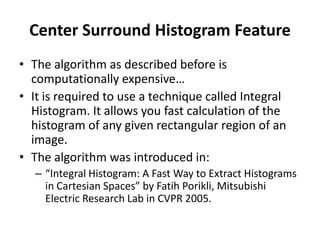


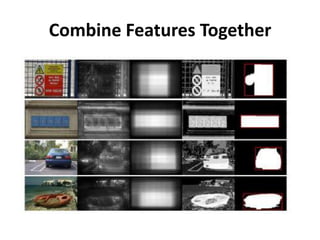


Vicente Ordonez will work on a 2007 paper about detecting salient objects in images. The paper uses multiscale contrast, center surround histograms, and color spatial distribution as visual attention features. These features are combined using conditional random fields trained on a labeled dataset to determine salient regions. Ordonez implements the features and achieves results similar to the original paper, with computation times of several seconds per image. The center surround histogram feature gives the highest precision for detecting salient objects.