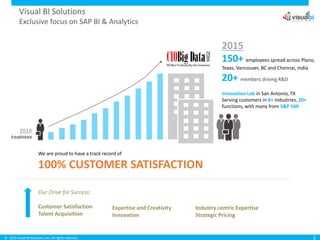
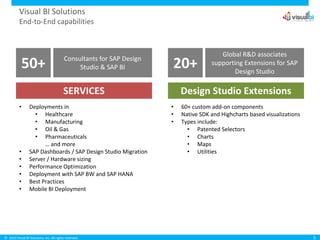
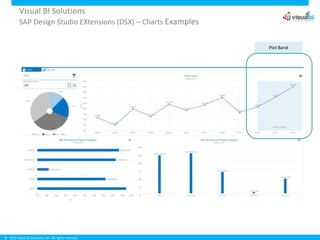
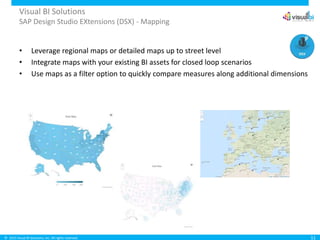
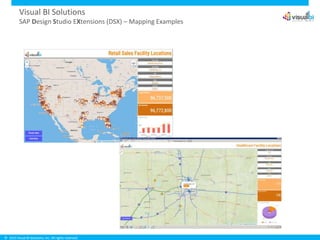
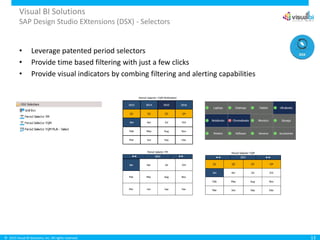
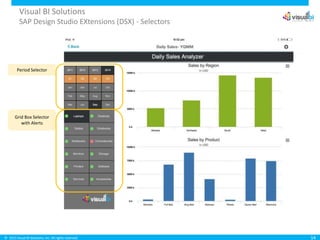
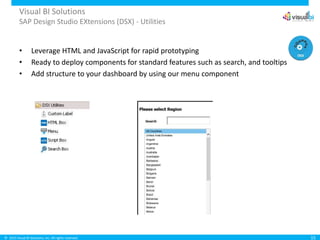
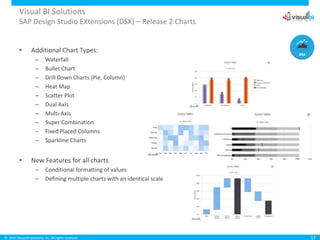
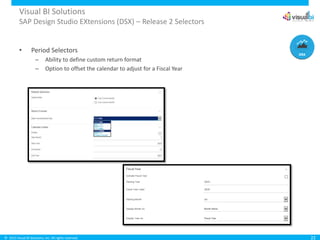
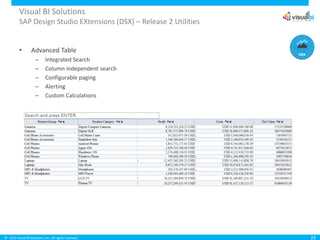
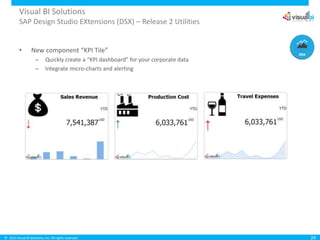
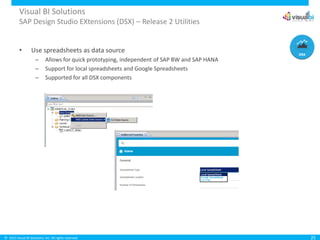
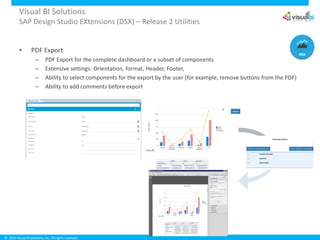
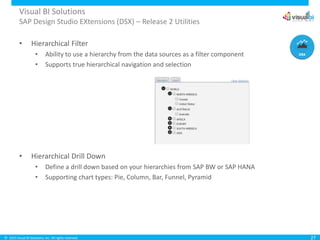
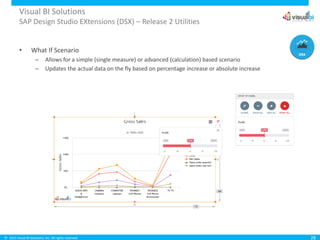
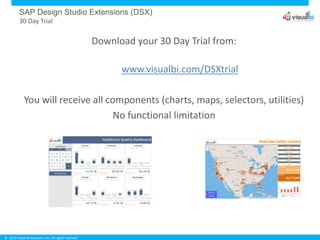
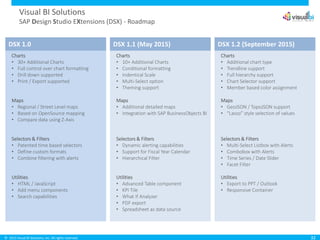
This document summarizes a presentation by Visual BI Solutions about their SAP Design Studio Extensions product. It provides an overview of Visual BI Solutions as a company, what the Design Studio Extensions product is, the key features it adds to Design Studio like additional charts and mapping capabilities, and a demonstration of the extensions. It outlines the pricing and licensing model and 30-day trial available. The roadmap is also presented showing additional functionality planned for future releases.
Dashboard Factory - most efficient way to develop with SAP Design Studio Iliya Ruvinsky
Using SkyTemplates can significantly shorten the process of creating reports in SAP Design Studio. SkyTemplates provide ready-made templates that include predefined layouts, components, functionality, and styling. Report developers can link data sources to a SkyTemplate without needing to design interfaces, write scripts, or fine-tune the report. This can reduce the time and costs of report development in Design Studio by up to 60% compared to building reports from scratch.
This document compares SAP BO Dashboards (Xcelsius) and SAP Design Studio. It provides an overview of the components, functionality, integration capabilities, performance, and development experience of each. Design Studio offers a more robust set of visual components, integration options, and mobile support compared to Xcelsius. However, Xcelsius may be more familiar for those with Excel skills. The document also provides tips for optimizing Design Studio dashboard performance.
This document provides an introduction to SAP BI dashboards and the Xcelsius tool. It describes the key components of the Xcelsius interface including the component browser, canvas, properties panel, and object browser. It also explains how to add and format components on the canvas, set properties, group and lock objects, and navigate between components using the object browser. The goal of Xcelsius is to transform raw data into interactive and visually appealing dashboard presentations.
Advanced Dashboards using Design Studio Extensions - WebinarVisualBISolutions
This presentation gives an update on the new release of Design Studio Extensions provided by Visual BI Solutions. These Design Studio extensions include charts, maps, filters and selectors, as well as a set of utilities. You will learn various types of advanced functionalities you could leverage as part of your dashboard and data visualization projects.
SAP Analytics Cloud combines BI, planning, predictive, and augmented analytics capabilities into one simple cloud environment. Powered by AI technologies and an in-memory database, it is one of the most advanced analytics solutions available today.
Can you keep up with SAP Analytics Cloud? (Martijn van Foeken)Twan van den Broek
SAP Inside Track NL talk by Martijn van Foeken
SAP is quickly extending their Analytics Cloud solution and it's hard to keep up with the waves containing exiting new features, introduced on a bi-weekly basis. Now with the introduction of Application Design, SAP adds a 4th pillar besides BI, Planning and Predictive features to SAP Analytics Cloud to enabling customers to easily and quicky build custom applications.
In this presentation Martijn will highlight some of the latest innovations in SAP Analytics Cloud and will talk about / live demo the first version of the Application Designer, which is currently in BETA. He will also talk about the APOS Publisher for Cloud, a partner solution that enables bursting of personalized SAP Analytics Cloud stories to end users to various destinations and in different formats.
Discover The Future Of SAP BusinessObjects (BI 4.3 SP02)Wiiisdom
This document discusses the reasons for adopting SAP BusinessObjects BI 4.3. It notes that SAP's BI portfolio includes both on-premise and cloud-based analytics solutions. While cloud adoption is growing, many customers still rely on large on-premise investments, so a hybrid approach is often needed. BI 4.3 aims to provide a modern user experience, tighter integration with SAP Analytics Cloud, and continued enhancements to lower costs and accelerate value. Key focus areas for BI 4.3 include enterprise readiness, the hybrid landscape, and improved usability.
With the advent of S/4HANA the paradigms of how to develop ABAP based applications changed. This talk will give you insight into the new way how to develop “S/4-style” applications.
Technical Track presented during the IT Conference on SAP technologies 2016 by Christian Lechner, Principal IT Consultant, msg systems ag.
The document provides an overview of the SAP BO Commentary Solution. It discusses why commenting is important, describes the single solution for managing comments across SAP BI tools, demonstrates the application functionality and frontend integration, explains how to handle custom logic, and outlines the technical requirements. Key points include the centralized web interface, ability to comment at different data levels, use of workflows and templates, and period locking capabilities.
SAP HANA is s a real-time, in-memory database that enables organizations to process “big data” in support of transactional processing, operational reporting, advanced analytics and predictive modeling. With that said, SAP HANA has the potential to be much more than a database. In fact, SAP HANA as platform can serve as an agile, flexible application development framework. This game-changing capability empowers organizations to build advanced applications directly on SAP HANA, leveraging the SAP HANA Extended Application Service (XS).
During this webinar, we will outline how the SAP HANA XS Engine can add value to your business through agile development methods. Additionally, we will demonstrate how SAP HANA Studio is used to develop applications that can both read and write to your SAP HANA instance. The webinar will specifically focus on how SAP HANA XS can provide personalization, page building and navigation. We will detail the benefits and best practices and demonstrate the integrated SAP HANA application layer tools.
The document provides information on SAP's Business Intelligence technology updates. It summarizes new features in SAP BusinessObjects BI 4.0, 4.1 and 4.2, including improved self-service analytics, dashboards, reporting, predictive analysis, data visualization, mobile access, and connectivity to additional data sources. It also describes tools like Explorer for data exploration, the Information Design Tool, and integration with desktop reporting and mapping technologies.
SAP cProjects (PPM) is a project management module that allows for planning, execution, and monitoring of projects while tightly integrating with other SAP modules. It provides capabilities for project structure definition, scheduling, resource planning, cost planning, and integration with finance, procurement, and other areas. cProjects has evolved as part of the SAP Portfolio and Project Management offering to provide comprehensive project management.
The document summarizes new features in SAP HANA SPS 10, including unmanaged associations and multi-file support in CDS modeling, replacing all views with calculation views, and remodeling SAPUI5 code with XML-based views. It provides details on how unmanaged associations allow defining associations that don't impact the data model and how multi-file support enables using CDS artifacts across files. It also notes that all attribute and analytic views were replaced with calculation views and that SAPUI5 code now uses XML views as per SAP guidelines.
The document summarizes the new features and enhancements in SAP HANA SPS 09 related to development tools. Key updates include improvements to the developer experience with the SAP HANA Web-based Development Workbench, including new editors for objects like SQLScript, XSODATA, roles, and more. The SAP HANA Studio was also enhanced with features like one-click debugging between XSJS and SQLScript, direct editing from the repository browser, and semantic code completion.
BW/4HANA provides easy integration of big data scenarios, new business intelligence from expanded data, and effortless data tiering automation. It offers an intuitive modern user interface, simplified data modelling, and continuous innovation delivery. BW/4HANA improves development productivity, time to business value, and reduces costs, while BW on HANA is in maintenance mode with no new features.
How to design web intelligence reports that behave like real dashboardsWiiisdom
Everyone knows that SAP BusinessObjects Web Intelligence is synonymous with ad-hoc querying and interactive reporting. But not everyone knows that the Web Intelligence toolkit can also be used for dashboards.
Join SAP’s Pascal Gaulin (BI Product Expert, Web Intelligence) and Gregory Botticchio (BI Product Manager, Web Intelligence) as they demonstrate how to create powerful dashboards using rich and versatile, modern Web Intelligence visualization features.
SAP HANA SPS10- Extended Application Services (XS) Programming ModelSAP Technology
The document summarizes new features in SAP HANA Extended Application Services Programming Model (XS) in SAP HANA SPS 10, including additional runtime containers for Node.js, Java, and C/C++; improvements to Core Data Services (CDS) such as support for more SQL functions, GIS types and functions, and series entities; and new capabilities for the HANA XS Admin tool like an online translation tool and parameter for automatic user generation during SQL Code Checker (SQLCC) usage. The roadmap also outlines future plans to move to Git version control and provide containers for schema-free content.
Dmm302 - Sap Hana Data Warehousing: Models for Sap Bw and SQL DW on SAP HANA Luc Vanrobays
This document discusses dynamic dimensional modeling approaches for SAP BW on HANA data warehouses (DW). It describes how BW on HANA uses InfoObjects to model DW dimensions and star schemas. Completely de-normalizing dimensions into single InfoObjects provides high performance but less flexibility. New features in BW on HANA like transitive attributes and split dimensions allow for more flexible modeling to absorb changes with minimal impact and integrate new data sources. The dynamic star schema defined through BW views also provides more agility compared to traditional static schemas.
SAP HANA Live allows for operational reporting directly on transactional data with zero latency, using lightweight modeling and open standards like SQL. It is part of SAP Business Suite powered by SAP HANA. In contrast, BW on HANA performs strategic and tactical reporting in an enterprise data warehouse, integrating and harmonizing data from multiple systems for consumption through BI clients. It provides preconfigured content with governance capabilities and a full analytical suite for long-term historical data storage and complex analytics.
Getting Started: How to Set Up Your "Data as a Feature" ProjectTIBCO Jaspersoft
This workshop series features a brand-new demo application—created by the TIBCO Jaspersoft team and projekt202—that illustrates and teaches you how to create answer-generating applications of your own. Over the course of 5 webinars, we will introduce you to the what and the why of data as a feature applications and how you can build your own.
Lesson #2 Agenda:
- Project Overview
- Defining the user experience
- Setting up the application environment
- Preparing data
ABAP Development in time of S/4 - Do's and Don'ts and Golden Rules for Simpli...Christian Lechner
This document provides recommendations for ABAP development for SAP S/4HANA. It recommends that developers read documentation to understand changes, clean up unused code, learn new extension mechanisms, make code compatible with S/4HANA, use modern ABAP practices, follow the S/4HANA programming model of data modeling, CDS views, BOPF and Fiori apps, and ensure the data model is high quality. It acknowledges challenges including some bleeding edge technology, limited information, harmonizing legacy and new concepts, and maintaining multiple code lines during a transformation.
Power BI for Dynamics - AJ Ansari - NAVUG Webinar -v3AJ Ansari
This document discusses Microsoft Power BI and how it can be used with Dynamics NAV. Power BI provides self-service business analytics tools for analyzing data and sharing insights. It has a freemium pricing model and works across devices. The document outlines how to connect Dynamics NAV to Power BI using the Dynamics NAV content pack in just four steps. It also discusses considerations for older NAV versions or non-internet facing deployments connecting to Power BI. The presenter demonstrates connecting NAV, working with reports and dashboards, and creating new datasets in Power BI Desktop.
Self-service BI with PowerPivot and PowerViewIvan Donev
This document discusses how to use PowerPivot and Power View for business intelligence and data analysis. PowerPivot allows users to load large amounts of data into Excel and perform self-service analytics. Power View builds on PowerPivot and allows users to visualize and explore data through interactive reports and dashboards. The document outlines several real-world scenarios where PowerPivot and Power View can be used and highlights their key features and capabilities like in-memory processing, tabular data models, and integration with SharePoint. It also provides demonstrations of building reports in Power View.
SQL Server Reporting Services 2016 FeaturesHARIHARAN R
This document discusses new features in SQL Server Reporting Services 2016. It describes the modernized web portal built on HTML5, custom branding capabilities, modern paginated reports with new chart types, customizable parameter layouts, export and print improvements including PowerPoint generation, pinning of report items, mobile reports, KPIs, and integration with Power BI. It provides an overview of the differences between integrated and native modes as well as a demonstration of the Power BI Report Server.
This document provides an overview of SAP BusinessObjects Analysis, edition for OLAP. It discusses how the software provides a premium alternative to BEx that allows power users to create purpose-built OLAP analysis and planning applications. It also includes a dedicated ad-hoc OLAP client for business users to analyze and share OLAP data. Additionally, it summarizes SAP BusinessObjects Analysis for Microsoft Office, which enables multidimensional analysis of SAP BW and SAP HANA directly within Excel for creating workbook applications and live PowerPoint presentations.
The document compares the old C/SIDE development environment for Dynamics NAV to the new VS Code environment. It discusses that C/SIDE used C/AL programming language and objects were stored in a database, while the new environment uses the AL language in VS Code and stores objects as files. It also provides overviews of AL programming, commonly used functions and methods, and differences between developing in the two environments such as using .FOB vs .APP files and the object designer vs code editor.
Mapping at “Object Geographies: Dis-assembly / Re-assembly Workshop in Art and Architecture” class at ACT in MIT.
A similar lecture, Civic Maps using this slides could be seen at the video-round table that took place at MIT Media Lab on October 20th 2011: http://civic.mit.edu/event/civic-media-session-civic-maps
The document provides driving directions from Cape Road to 25 Constitution Hill in Port Elizabeth. It instructs the driver to turn right onto Russel Rd from Cape Rd, then left onto Lawrence St and Parliament St, before turning left onto Donkin St and Chapel St. It notes to take the first left up Constitution Hill and park in the parking area, then walk up the double stairs past the coffee shop to number 25, the first double-story building on the right.
This document discusses raster data in GIS. Raster data represents geographic information as a grid of cells or pixels organized into a matrix of rows and columns. Each cell contains a value representing information such as elevation, vegetation index, or land use class. Raster data can represent data as integers, floats, or other data types and comes in various resolutions, with higher resolution providing more detail. Rasters can be single band (one value per cell) or multiband (multiple values per cell representing different wavelengths). Examples of raster data sources include remote sensing imagery, digital elevation models, and land cover maps.
This document provides an overview of map design using GIS software. It discusses important elements to include in maps such as titles, legends, scale bars, and north arrows. It also covers choosing appropriate symbology for different map features, file formats, and resolutions for different map outputs. The document is intended to teach learners how to design effective maps using GIS software.
The document discusses the Google Maps API which provides over 150 features for adding maps and mapping capabilities to web and mobile applications. It covers core map components like controls, overlays, and layers as well as services for geocoding, directions, elevation, street view and places. It also discusses customizing maps with styles, icons and tilt/heading controls as well as using the API across different languages and platforms. The document provides examples of common API tasks like placing markers, handling user input and clustering large datasets.
The document discusses key concepts related to maps and mapping. It addresses how maps answer fundamental questions about location and navigation by representing places in the real world. The document also examines different types of maps, including cognitive maps, strip maps, projections like Mercator and Peters, and thematic maps. Finally, it explores how maps can be used for propaganda or to advocate particular viewpoints.
This document discusses challenges faced by in-house design teams and strategies for demonstrating their value. It notes that designers are often not respected by clients or other coworkers and face difficulties with career development and value recognition. The document then outlines how design thinking and a focus on business metrics like revenue, turnaround time and cost-effectiveness can help design teams prove their worth to CEOs and employers. It also advocates for multi-disciplinary teams and standardized processes like chargeback models to establish design as a professional service.
Big Data and Hadoop training course is designed to provide knowledge and skills to become a successful Hadoop Developer. In-depth knowledge of concepts such as Hadoop Distributed File System, Setting up the Hadoop Cluster, Map-Reduce,PIG, HIVE, HBase, Zookeeper, SQOOP etc. will be covered in the course.
This document provides an overview of big data and Hadoop. It discusses why Hadoop is useful for extremely large datasets that are difficult to manage in relational databases. It then summarizes what Hadoop is, including its core components like HDFS, MapReduce, HBase, Pig, Hive, Chukwa, and ZooKeeper. The document also outlines Hadoop's design principles and provides examples of how some of its components like MapReduce and Hive work.
Turn the next 12 days into a productivity makeover at work! These easy-to-implement tips, one for each day, are a perfect refresher.
Find out more about Redbooth at https://redbooth.com
In this webinar recording, we explore why the latest version of VBI View is the only enterprise BI portal you need to manage multiple BI platforms like Tableau, Microsoft Power BI, SSRS, SAP BusinessObjects, Qlik, TIBCO Spotfire, MicroStrategy and more.
Why Customers need to upgrade to SAP Lumira 2.2?Visual_BI
SAP Lumira 2.2 includes new features that enhance self-service capabilities for both the Discovery and Designer editions. In Discovery, there are improvements to filtering, number formatting, and SAP BW data presentation. Designer adds offline data refresh, variant support for prompts, and performance enhancements. It also allows for more end-user control through features like runtime application authoring and saving dashboard changes. These updates strengthen SAP Lumira's position in SAP's convergence strategy for agile data discovery and dashboarding.
Learn why Microsoft Power BI is an Undisputed Market Leader?Visual_BI
Power BI Report Server is the on-premise version of Power BI that allows organizations to consume Power BI reports within their internal network behind the firewall. It provides a dedicated user interface and organizational resources to view and interact with Power BI reports on-premises. Power BI Embedded allows embedding Power BI reports and visualizations into third-party applications using REST APIs. It is used to distribute reports to a large audience without requiring each user to have a Power BI license. Premium capacity in Power BI provides dedicated cloud resources for large datasets, frequent refreshes and advanced capabilities like paginated reports and predictive analytics.
Cognos Offering Manager Rachel Su demos the cool new functionality and improvements of Cognos Analytics 11.1.4 including custom visualizations, crosstabs and KPI widget improvements, compact legends, Exploration, Jupyter Notebooks and Smarts. View the video recording and download this deck at: https://senturus.com/resources/what-new-in-cognos-analytics-11-1-4/
Senturus offers a full spectrum of services for business analytics. Our resource library has hundreds of free live and recorded webinars, blog posts, demos and unbiased product reviews available on our website at: http://www.senturus.com/senturus-resources/
SIS Software & Solver BI360 Customer Presentation Nov 2016Debbie Peavy
http://www.sisn.com/november-webinar-solver-bi360/
In this webinar we will cover:
Excel based Report Writer (financial and operational)
Excel based Budgeting/Forecasting tool
Web portal to house Excel based reports
Dashboards and a SQl based, user friendly Data Warehouse
Accessible on your smartphone or tablet via a free app
Cognos Offering Manager Rachel Su demos the cool new functionality and improvements of Cognos Analytics 11.1.4 including custom visualizations, crosstabs and KPI widget improvements, compact legends, Exploration, Jupyter Notebooks and Smarts. View the video recording and download this deck at: https://senturus.com/resources/what-new-in-cognos-analytics-11-1-4/
Senturus offers a full spectrum of services for business analytics. Our resource library has hundreds of free live and recorded webinars, blog posts, demos and unbiased product reviews available on our website at: http://www.senturus.com/senturus-resources/
Landing Self Service Analytics using Microsoft Azure & Power BIVisual_BI
This webinar recording is designed to provide guidance for implementing self-service analytics utilizing Microsoft’s cloud data platform (Azure & Power BI) for broad consumption across the organization.
BizViz CA PPM Integration communicates directly with CA PPM using a web service, gets a list of active users, and leverages the CA PPM security model to ensure that all the data is shown based on the security rights. You can also leverage Active Directory or another application. Thus we bring Clarity to your PPM. Administrators can embed the dashboards in the corporate intranet, CA PPM or SharePoint.
Expanding the capabilities of SAC with App DesignVisual_BI
SAC Application Design provides the ability to build more powerful applications on the cloud through advanced scripting capabilities. In this webinar replay, we will be focusing on the major features of Application Design and how it would add value to SAP Analytics Cloud.
This webinar we will focus on products of Tableau, it’s data preparation and analytics capabilities and evaluate its features with that of other leading BI tools.
In this webinar recording, we evaluate Traditional BI tools like SAP Business Objects (Web Intelligence and SAP Lumira Designer) and compare them against Self-Service BI and Data Discovery capabilities of the top players in the market, namely SAP Analytics Cloud, Microsoft Power BI, Tableau, Qlik Sense & TIBCO Spotfire.
SAP Solution Guide for SAP Partners- Build to Innovate- OEM PartnersShivakumar Vishwanath
The document describes various SAP analytics and business intelligence solutions that can be embedded by OEM partners, including SAP Crystal Reports for pixel-perfect reporting, SAP Crystal Server for scalable report delivery, the SAP BusinessObjects BI Suite for comprehensive BI capabilities, SAP BusinessObjects Web Intelligence for interactive analysis, and SAP BusinessObjects BI Edge Edition for small and midsize businesses. It provides information on the key functions, benefits, and related solutions for each product.
In this webinar replay, we explore the various options available in SAP Lumira Designer and Visual BI Extensions for SAP Lumira Designer – (VBX) to help migrate existing SAP Dashboards/Xcelsius and BusinessObjects Explorer applications to SAP Lumira Designer/ SAP Analytics Cloud (SAC).
Centigon Solutions is a software company founded in 2008 that provides location intelligence solutions. Their CMaps Analytics software allows business users to integrate geographic data and analytics into SAP BusinessObjects tools without GIS expertise. It can be used to build executive dashboards to visualize KPIs and territories, as well as operational analytics for tasks like managing vendors and alerts. The plugin installs directly into SAP Dashboards and allows dragging location data onto maps and other visualizations.
MAIA is a large Indian business intelligence product company with over 50,000 licensed users and 300 customers in India, the Middle East, and Africa. Some of its key products include 1KEY Agile BI Suite for reporting and analysis, 1KEY FCM for financial consolidation, and postXBRL for business reporting. MAIA has received several awards and recognition for its product innovation leadership in business intelligence. It offers solutions like 1KEY Cube for multi-dimensional analysis and 1KEY Touch Dashboard for rich interactive dashboards. MAIA's hybrid BI architecture provides an easy to deploy platform for online and offline reporting and analytics.
Orchestrating the Future: Navigating Today's Data Workflow Challenges with Ai...Kaxil Naik
Navigating today's data landscape isn't just about managing workflows; it's about strategically propelling your business forward. Apache Airflow has stood out as the benchmark in this arena, driving data orchestration forward since its early days. As we dive into the complexities of our current data-rich environment, where the sheer volume of information and its timely, accurate processing are crucial for AI and ML applications, the role of Airflow has never been more critical.
In my journey as the Senior Engineering Director and a pivotal member of Apache Airflow's Project Management Committee (PMC), I've witnessed Airflow transform data handling, making agility and insight the norm in an ever-evolving digital space. At Astronomer, our collaboration with leading AI & ML teams worldwide has not only tested but also proven Airflow's mettle in delivering data reliably and efficiently—data that now powers not just insights but core business functions.
This session is a deep dive into the essence of Airflow's success. We'll trace its evolution from a budding project to the backbone of data orchestration it is today, constantly adapting to meet the next wave of data challenges, including those brought on by Generative AI. It's this forward-thinking adaptability that keeps Airflow at the forefront of innovation, ready for whatever comes next.
The ever-growing demands of AI and ML applications have ushered in an era where sophisticated data management isn't a luxury—it's a necessity. Airflow's innate flexibility and scalability are what makes it indispensable in managing the intricate workflows of today, especially those involving Large Language Models (LLMs).
This talk isn't just a rundown of Airflow's features; it's about harnessing these capabilities to turn your data workflows into a strategic asset. Together, we'll explore how Airflow remains at the cutting edge of data orchestration, ensuring your organization is not just keeping pace but setting the pace in a data-driven future.
Session in https://budapestdata.hu/2024/04/kaxil-naik-astronomer-io/ | https://dataml24.sessionize.com/session/667627
Predictably Improve Your B2B Tech Company's Performance by Leveraging DataKiwi Creative
Harness the power of AI-backed reports, benchmarking and data analysis to predict trends and detect anomalies in your marketing efforts.
Peter Caputa, CEO at Databox, reveals how you can discover the strategies and tools to increase your growth rate (and margins!).
From metrics to track to data habits to pick up, enhance your reporting for powerful insights to improve your B2B tech company's marketing.
- - -
This is the webinar recording from the June 2024 HubSpot User Group (HUG) for B2B Technology USA.
Watch the video recording at https://youtu.be/5vjwGfPN9lw
Sign up for future HUG events at https://events.hubspot.com/b2b-technology-usa/
ViewShift: Hassle-free Dynamic Policy Enforcement for Every Data LakeWalaa Eldin Moustafa
Dynamic policy enforcement is becoming an increasingly important topic in today’s world where data privacy and compliance is a top priority for companies, individuals, and regulators alike. In these slides, we discuss how LinkedIn implements a powerful dynamic policy enforcement engine, called ViewShift, and integrates it within its data lake. We show the query engine architecture and how catalog implementations can automatically route table resolutions to compliance-enforcing SQL views. Such views have a set of very interesting properties: (1) They are auto-generated from declarative data annotations. (2) They respect user-level consent and preferences (3) They are context-aware, encoding a different set of transformations for different use cases (4) They are portable; while the SQL logic is only implemented in one SQL dialect, it is accessible in all engines.
#SQL #Views #Privacy #Compliance #DataLake
The Ipsos - AI - Monitor 2024 Report.pdfSocial Samosa
According to Ipsos AI Monitor's 2024 report, 65% Indians said that products and services using AI have profoundly changed their daily life in the past 3-5 years.
4th Modern Marketing Reckoner by MMA Global India & Group M: 60+ experts on W...Social Samosa
The Modern Marketing Reckoner (MMR) is a comprehensive resource packed with POVs from 60+ industry leaders on how AI is transforming the 4 key pillars of marketing – product, place, price and promotions.
Beyond the Basics of A/B Tests: Highly Innovative Experimentation Tactics You...Aggregage
This webinar will explore cutting-edge, less familiar but powerful experimentation methodologies which address well-known limitations of standard A/B Testing. Designed for data and product leaders, this session aims to inspire the embrace of innovative approaches and provide insights into the frontiers of experimentation!