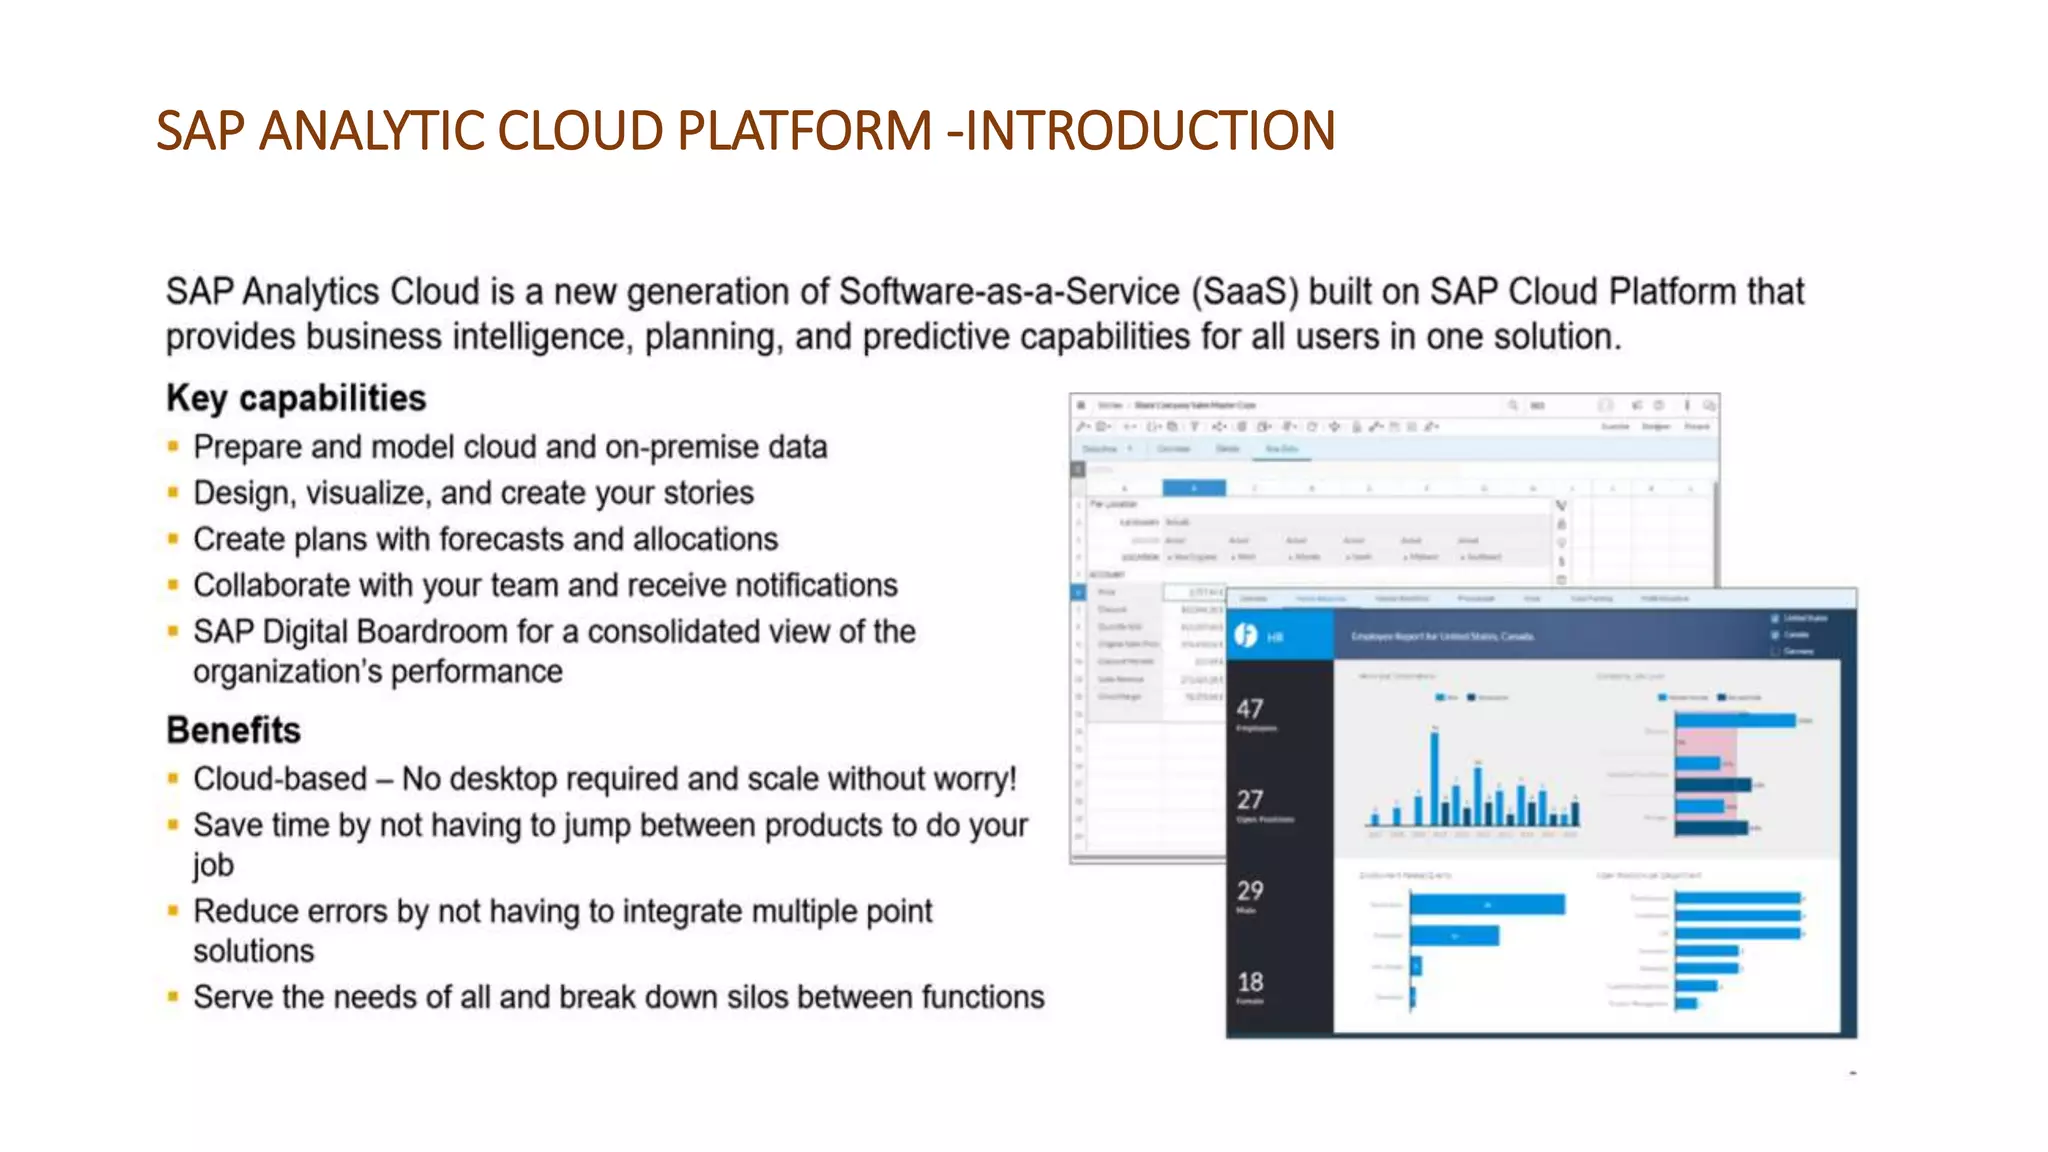
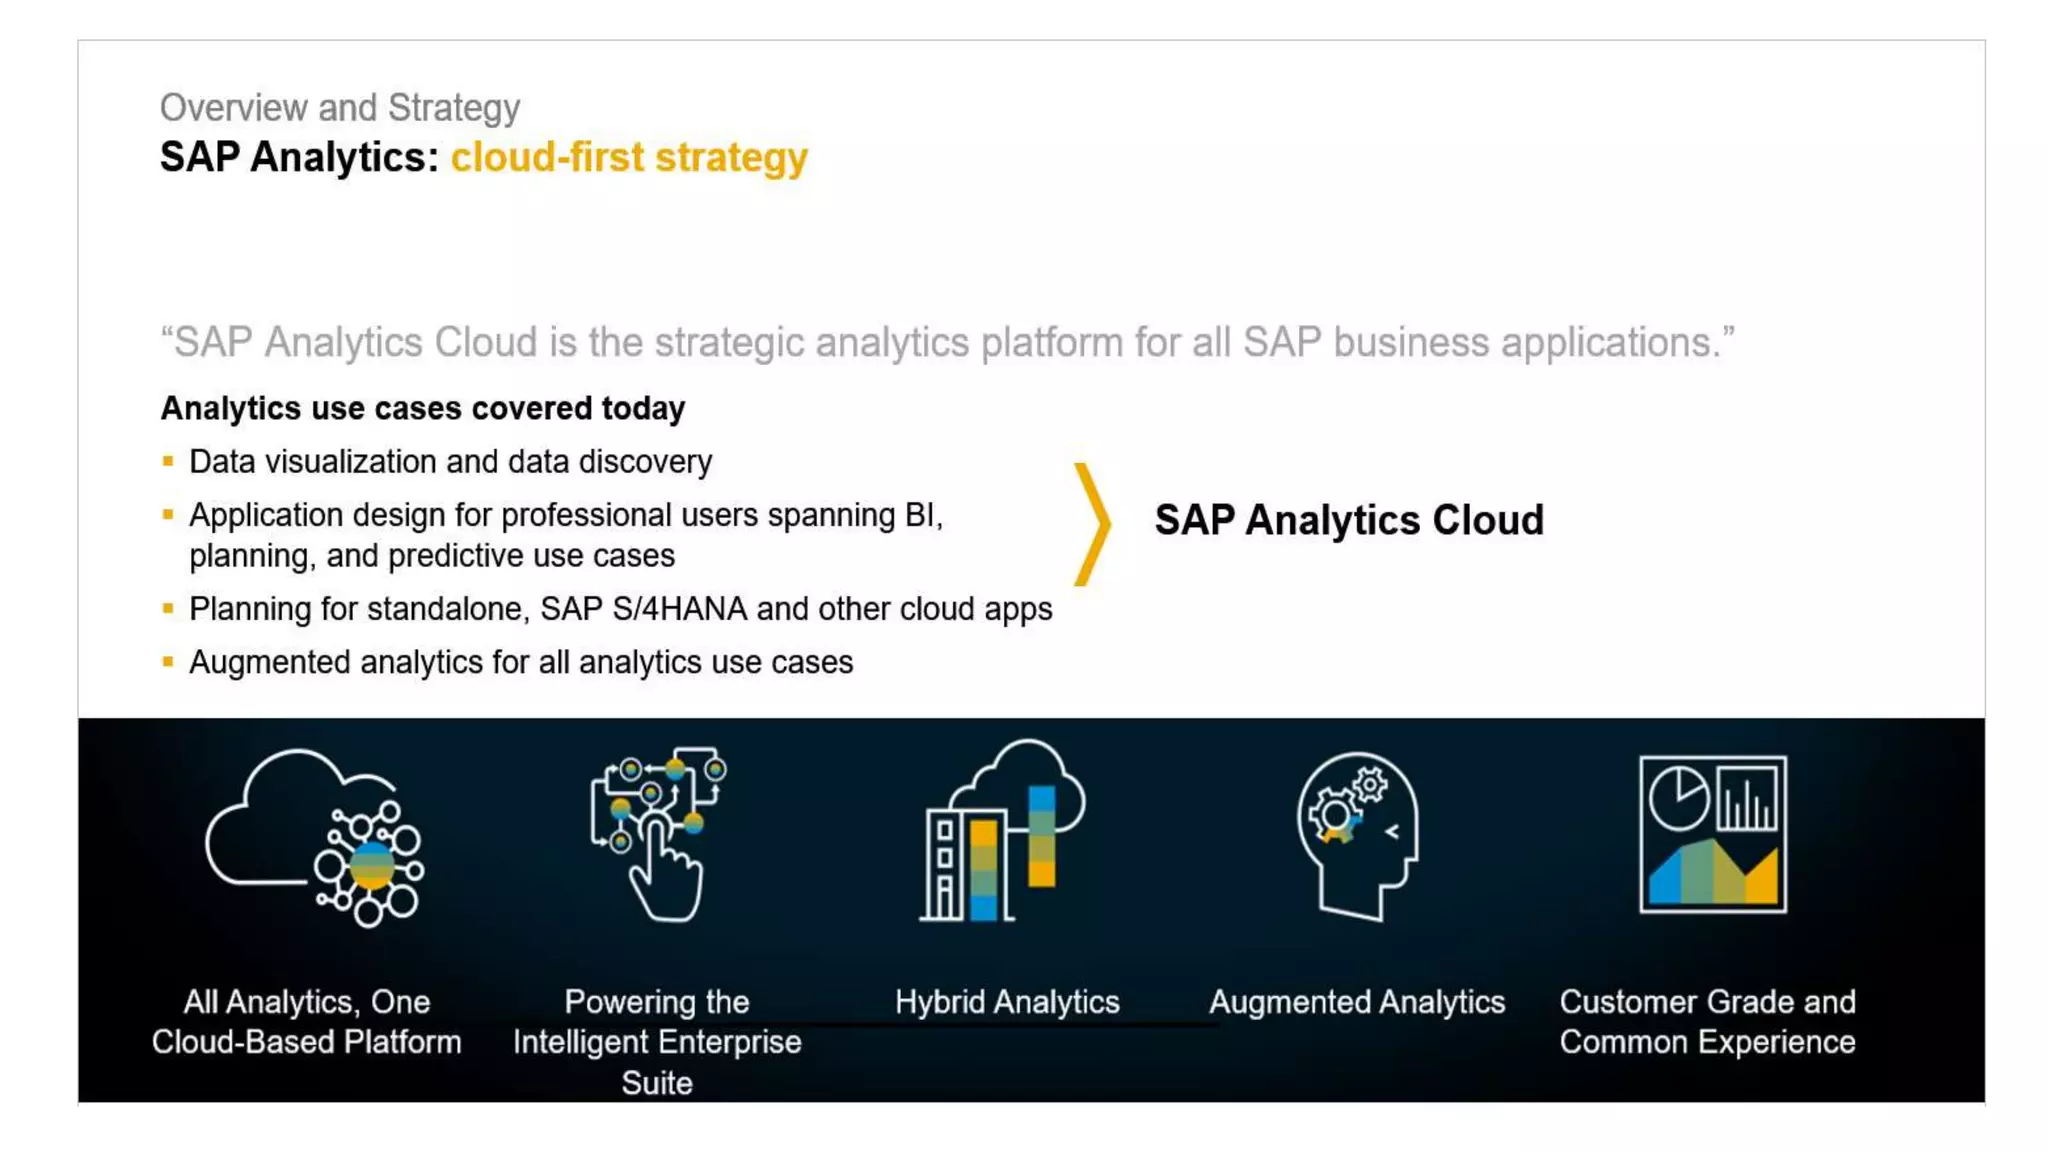
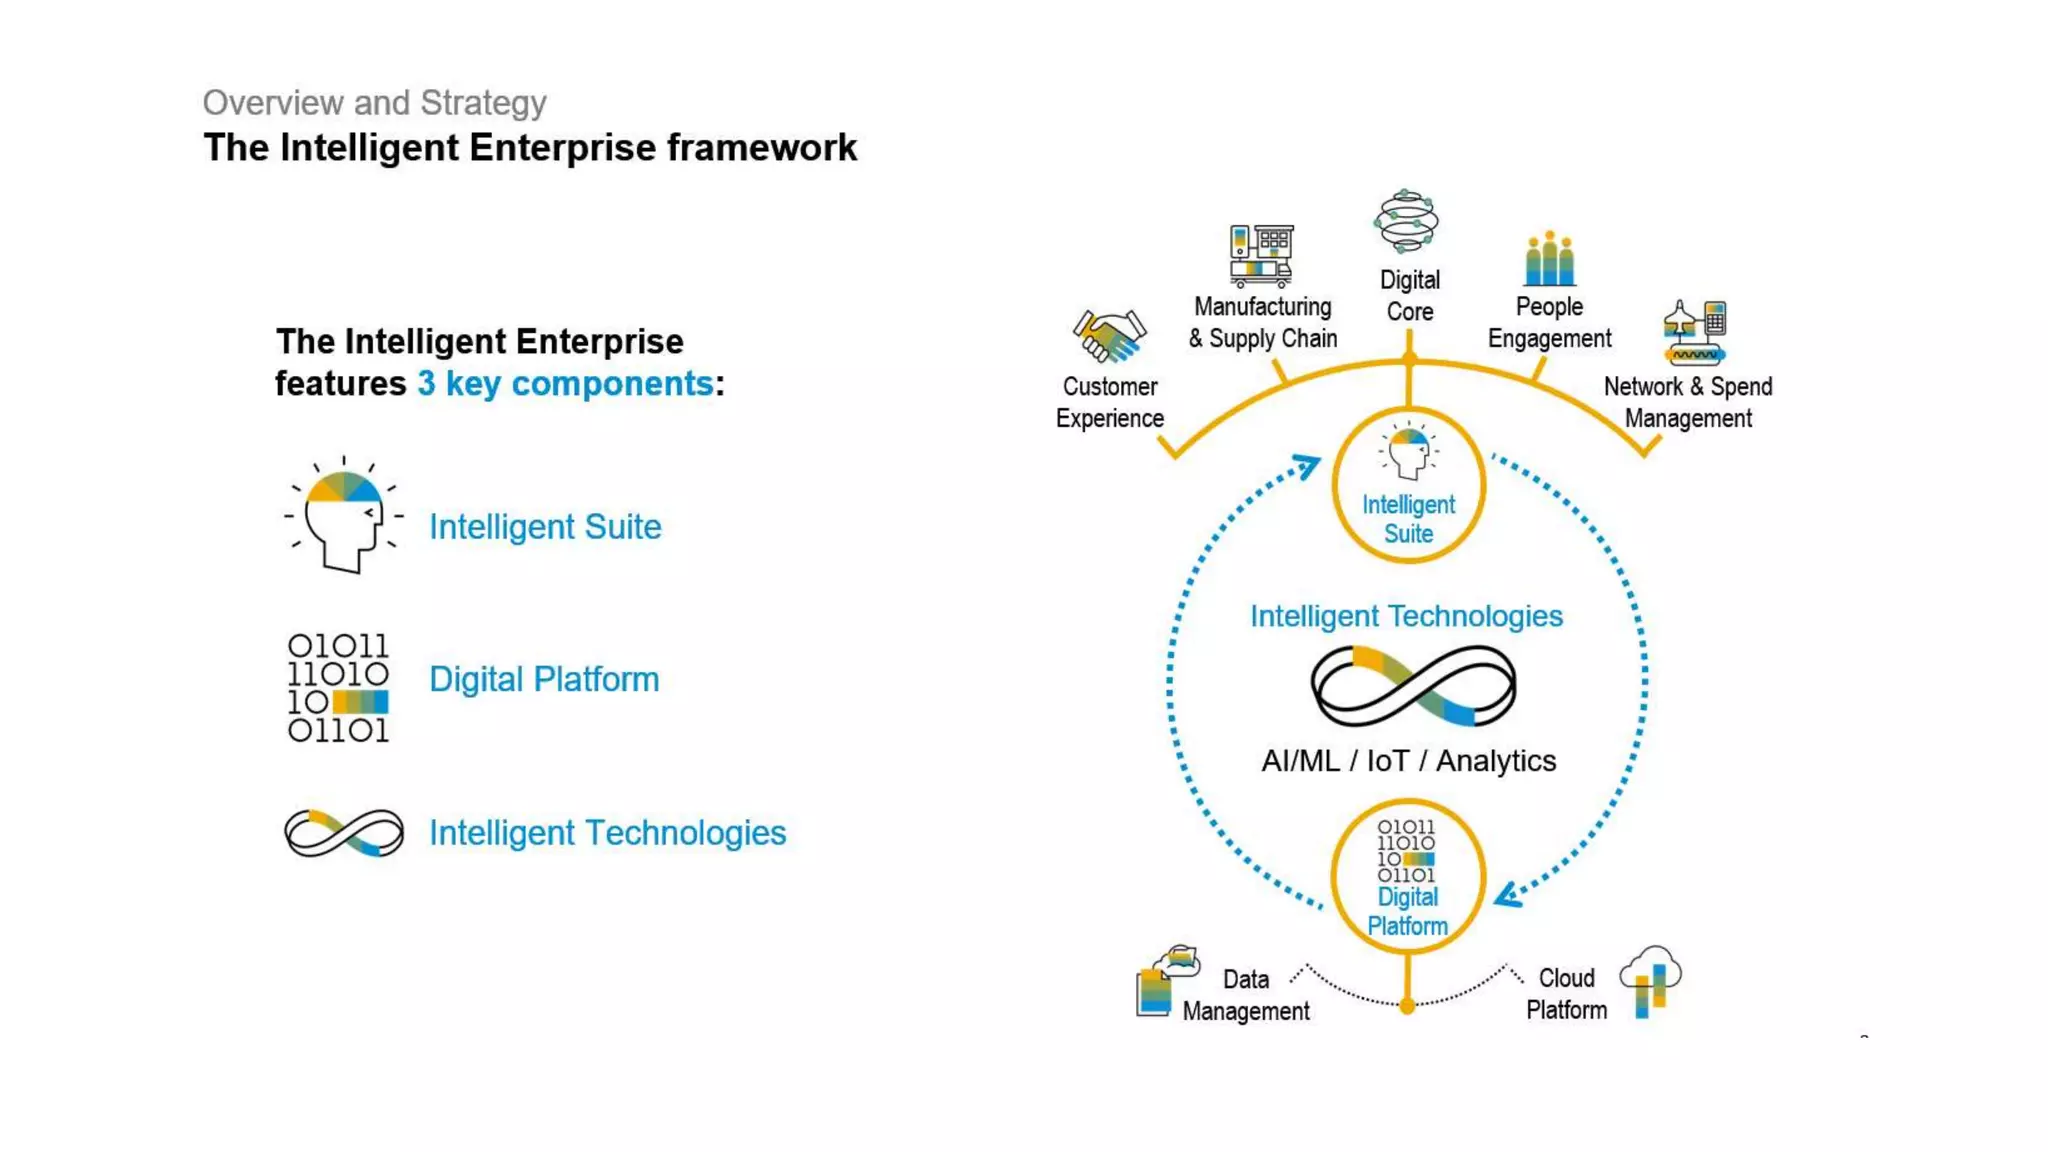
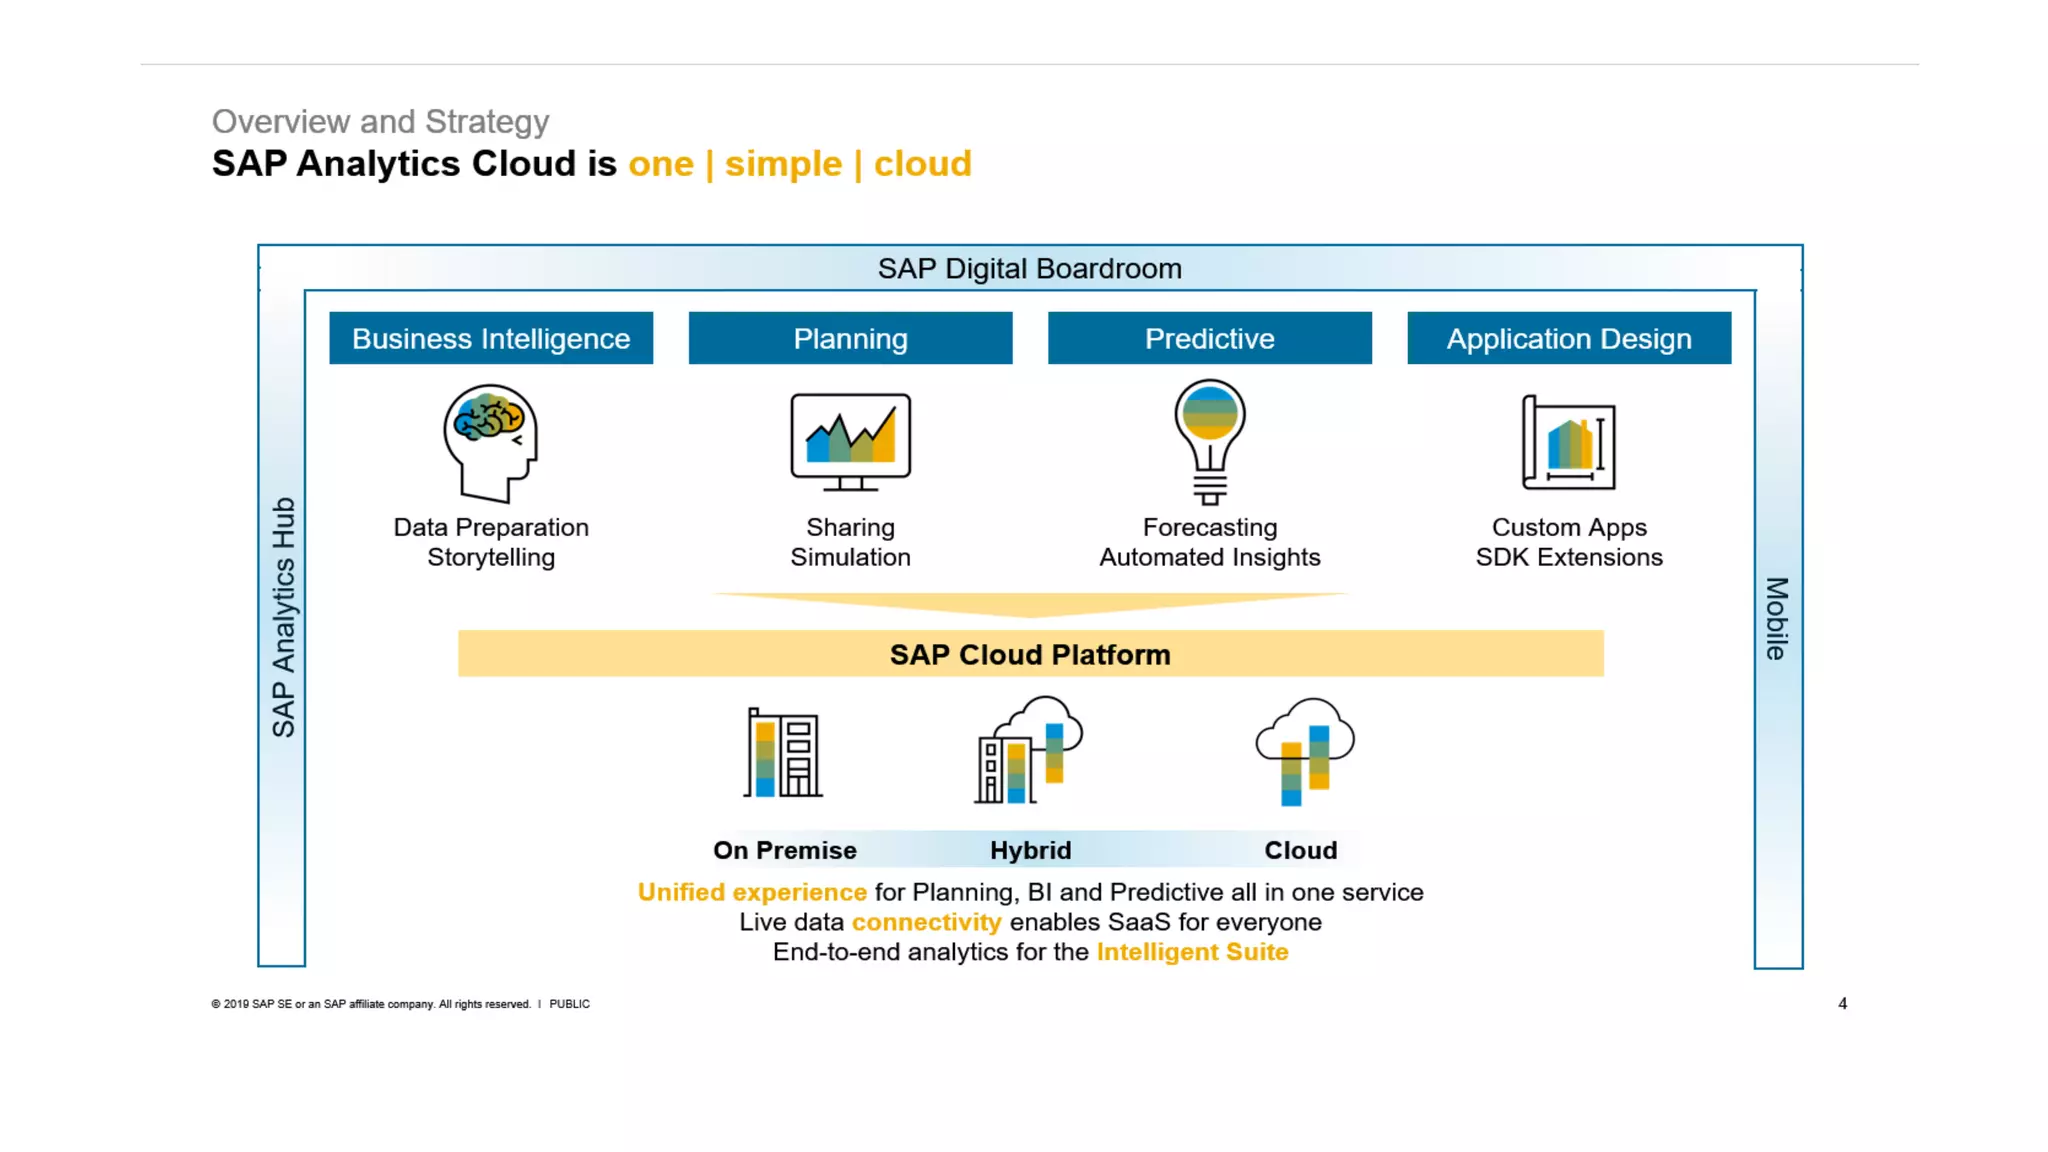
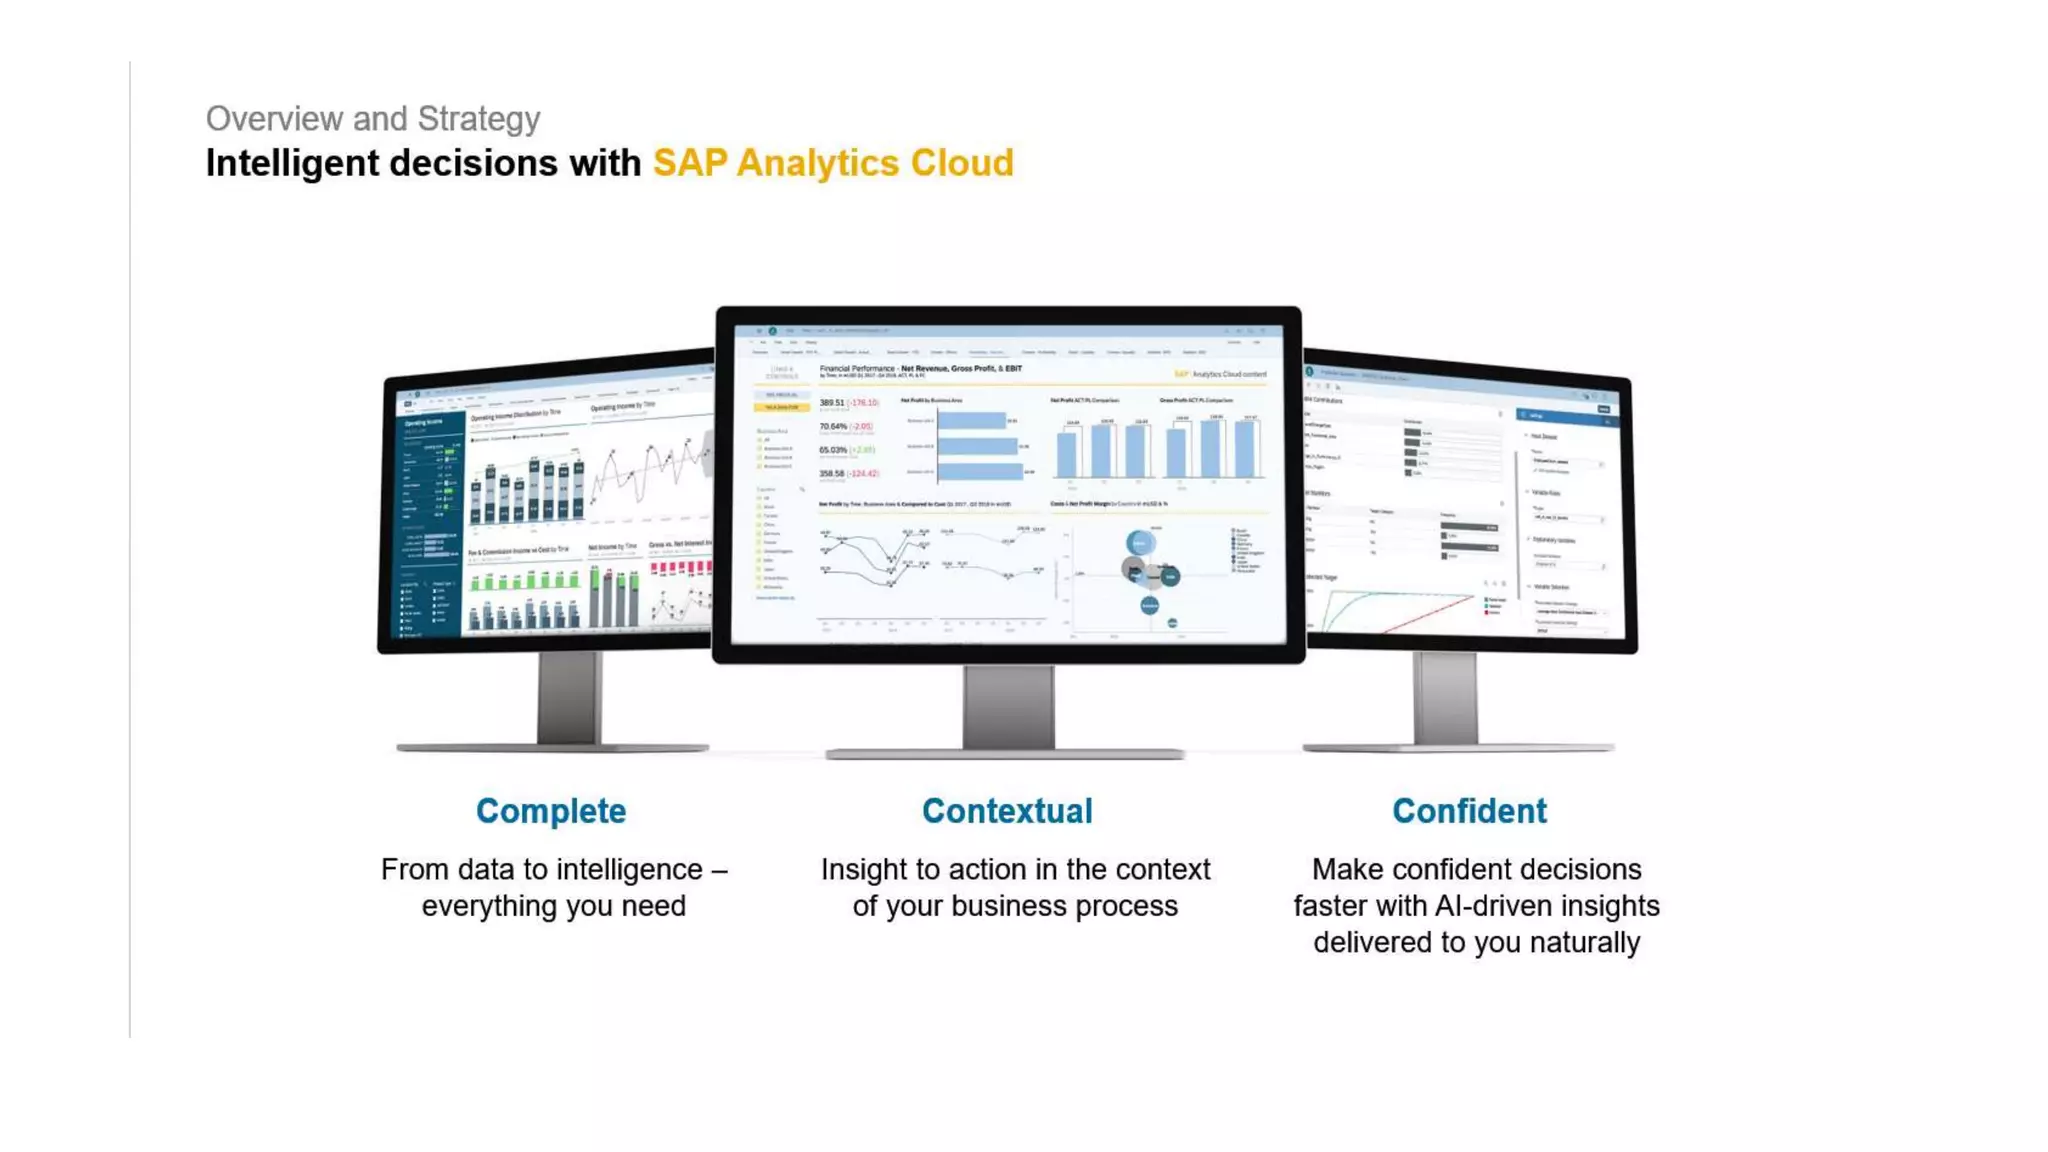
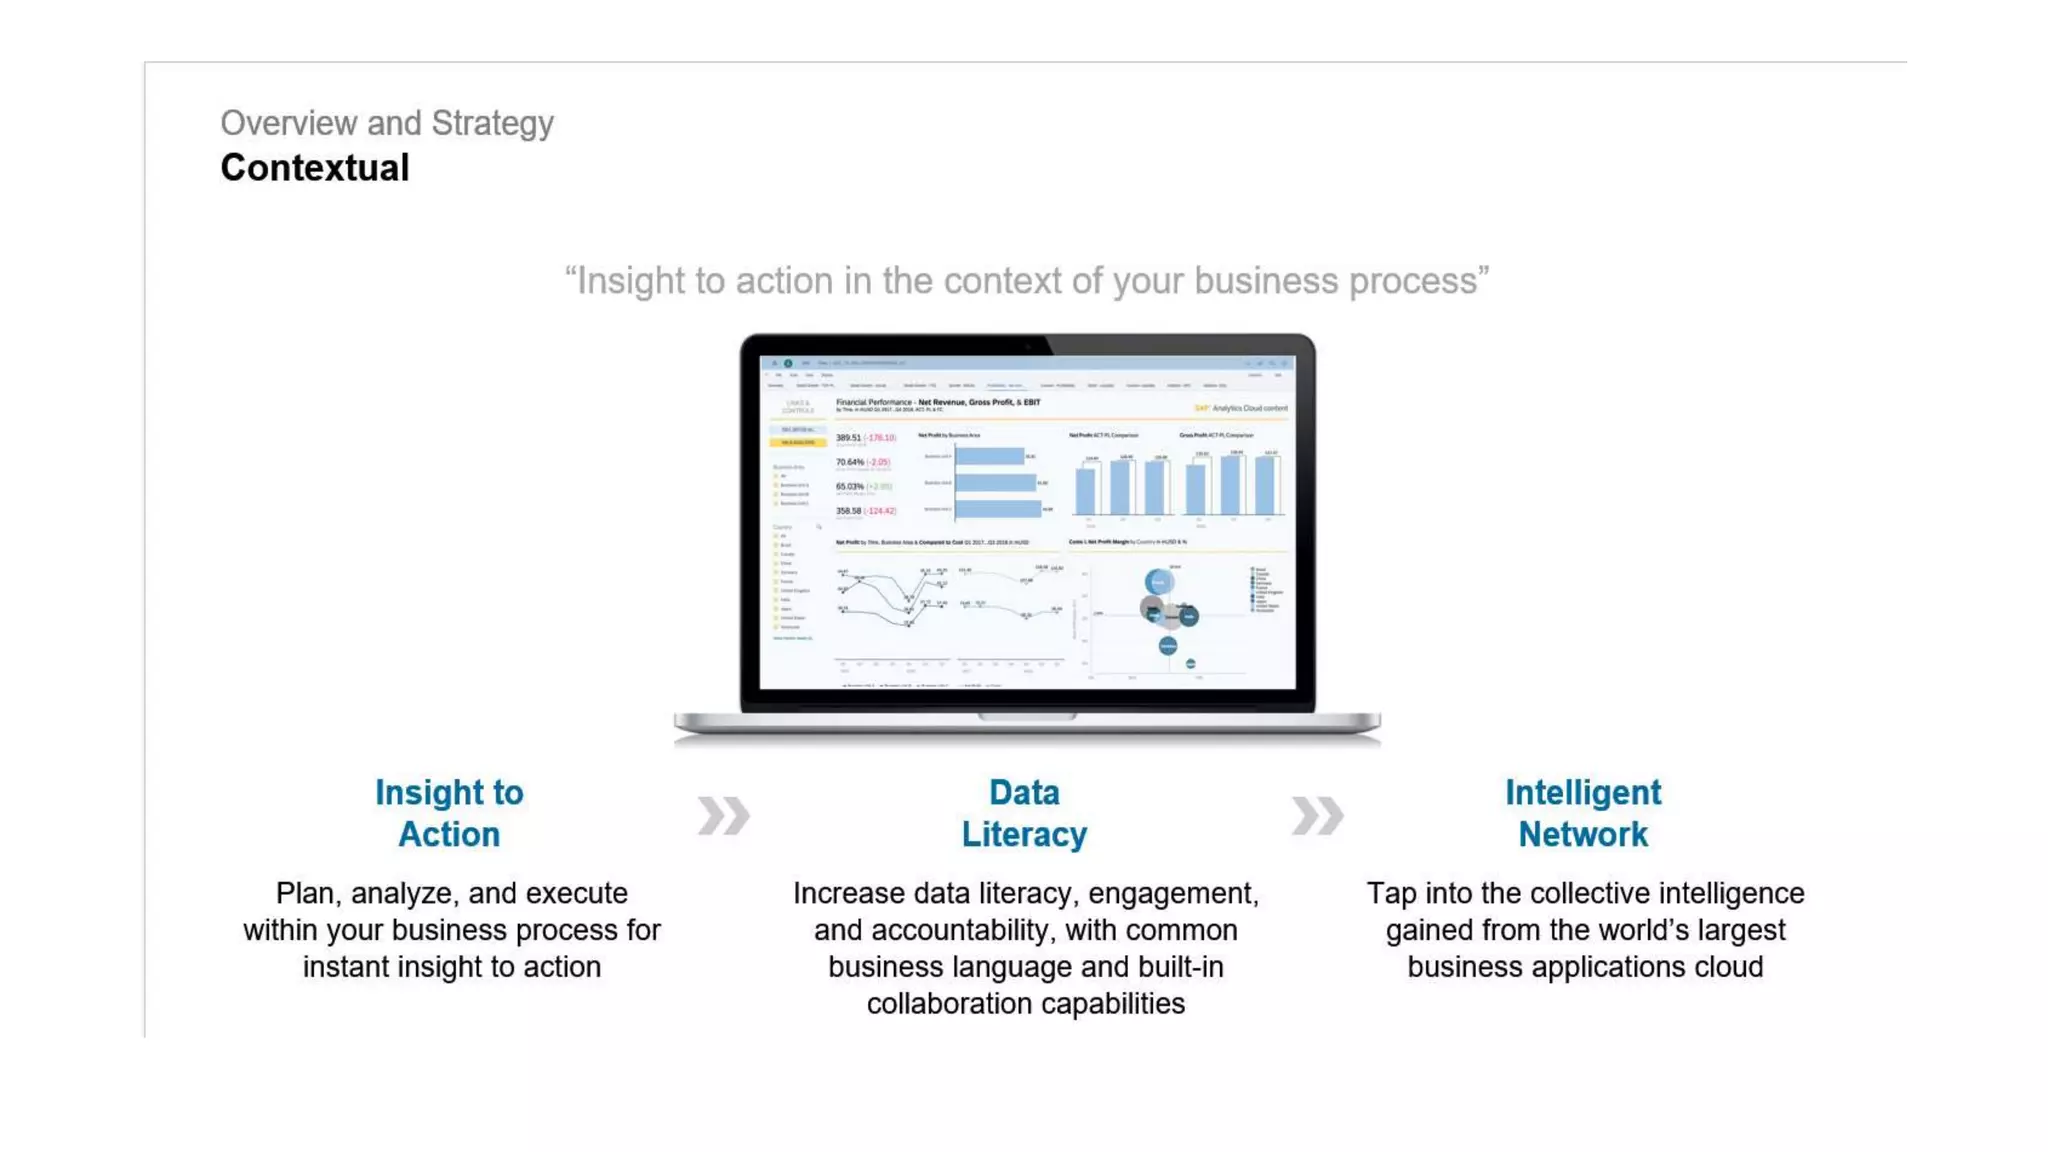
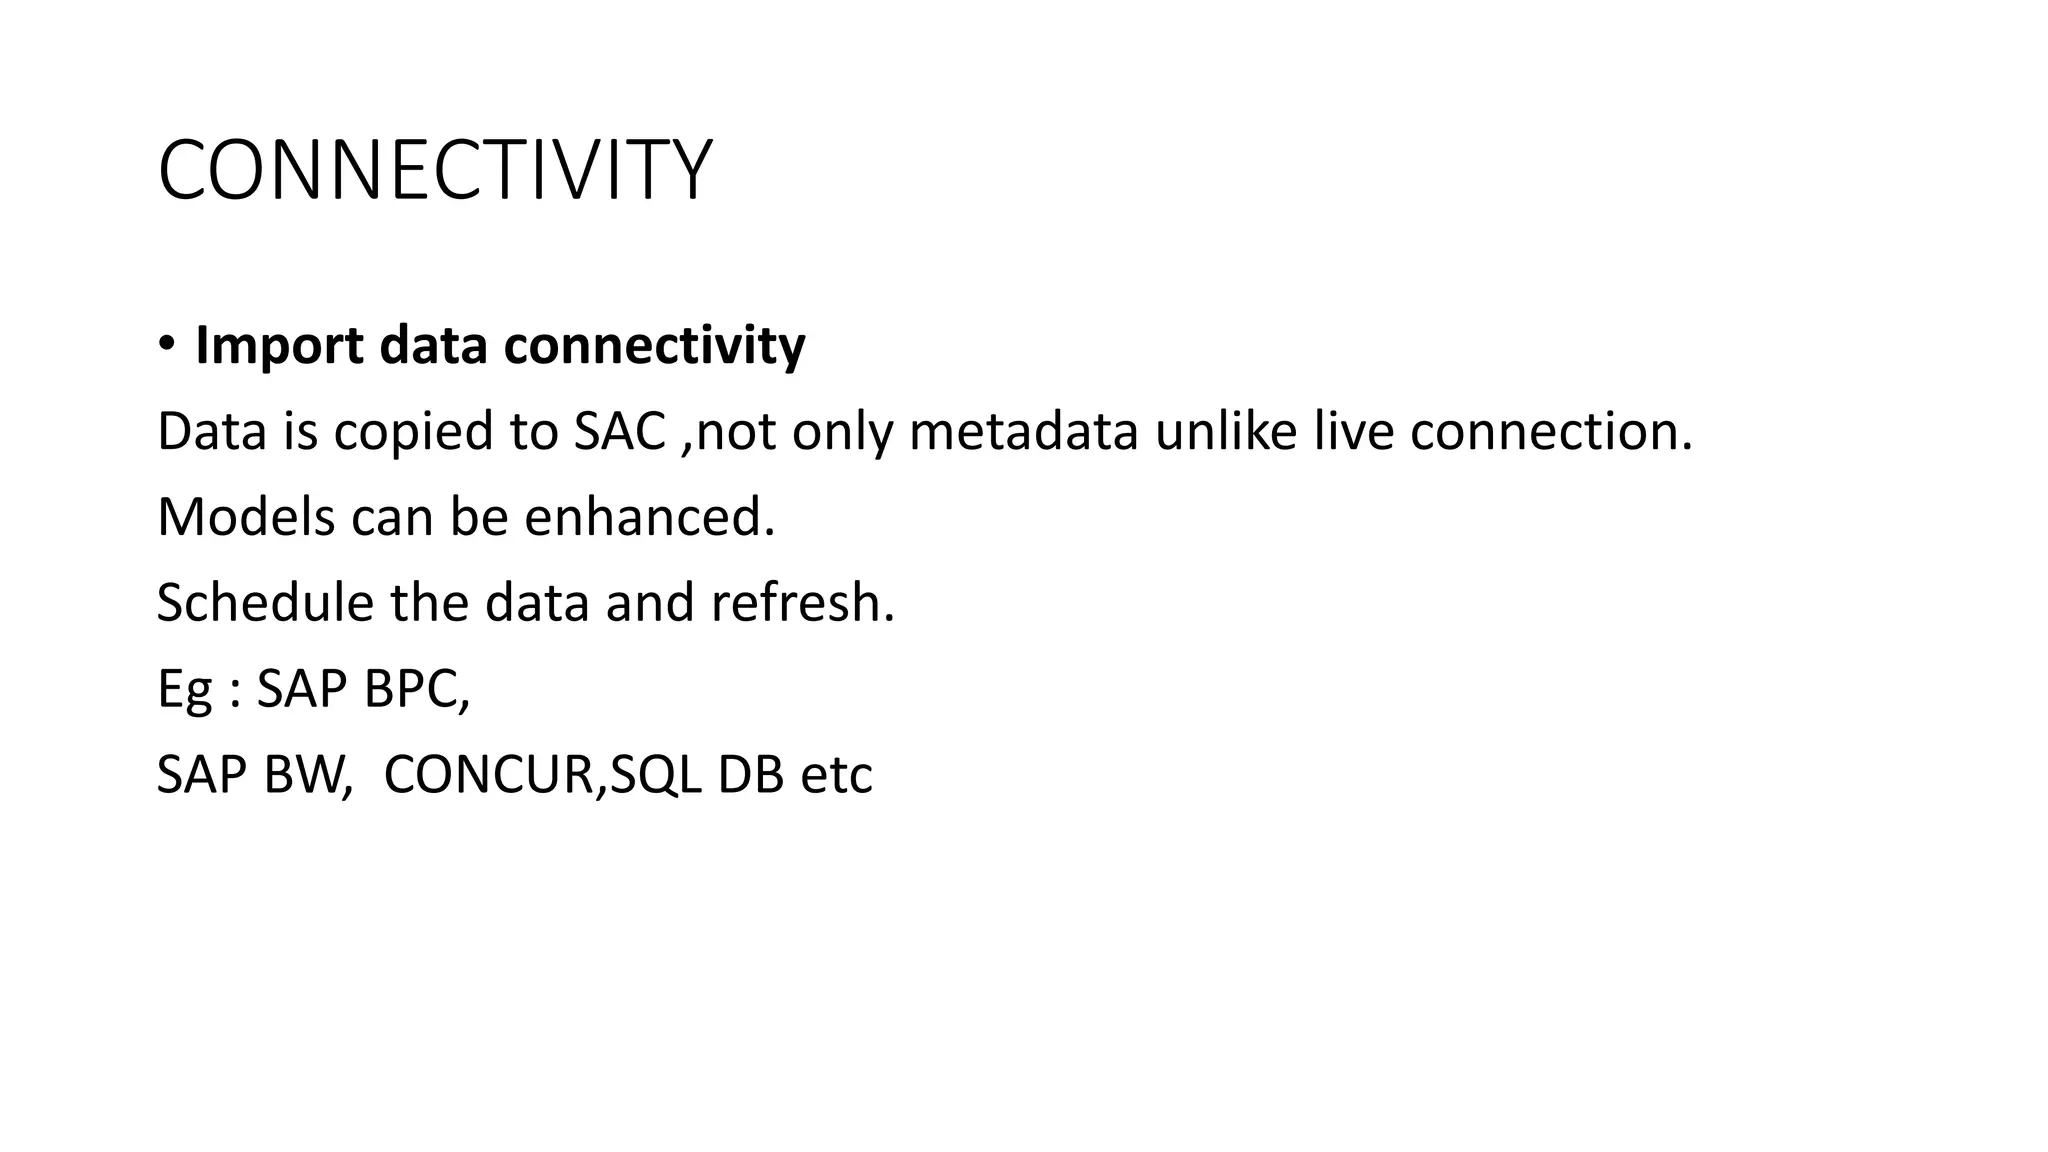
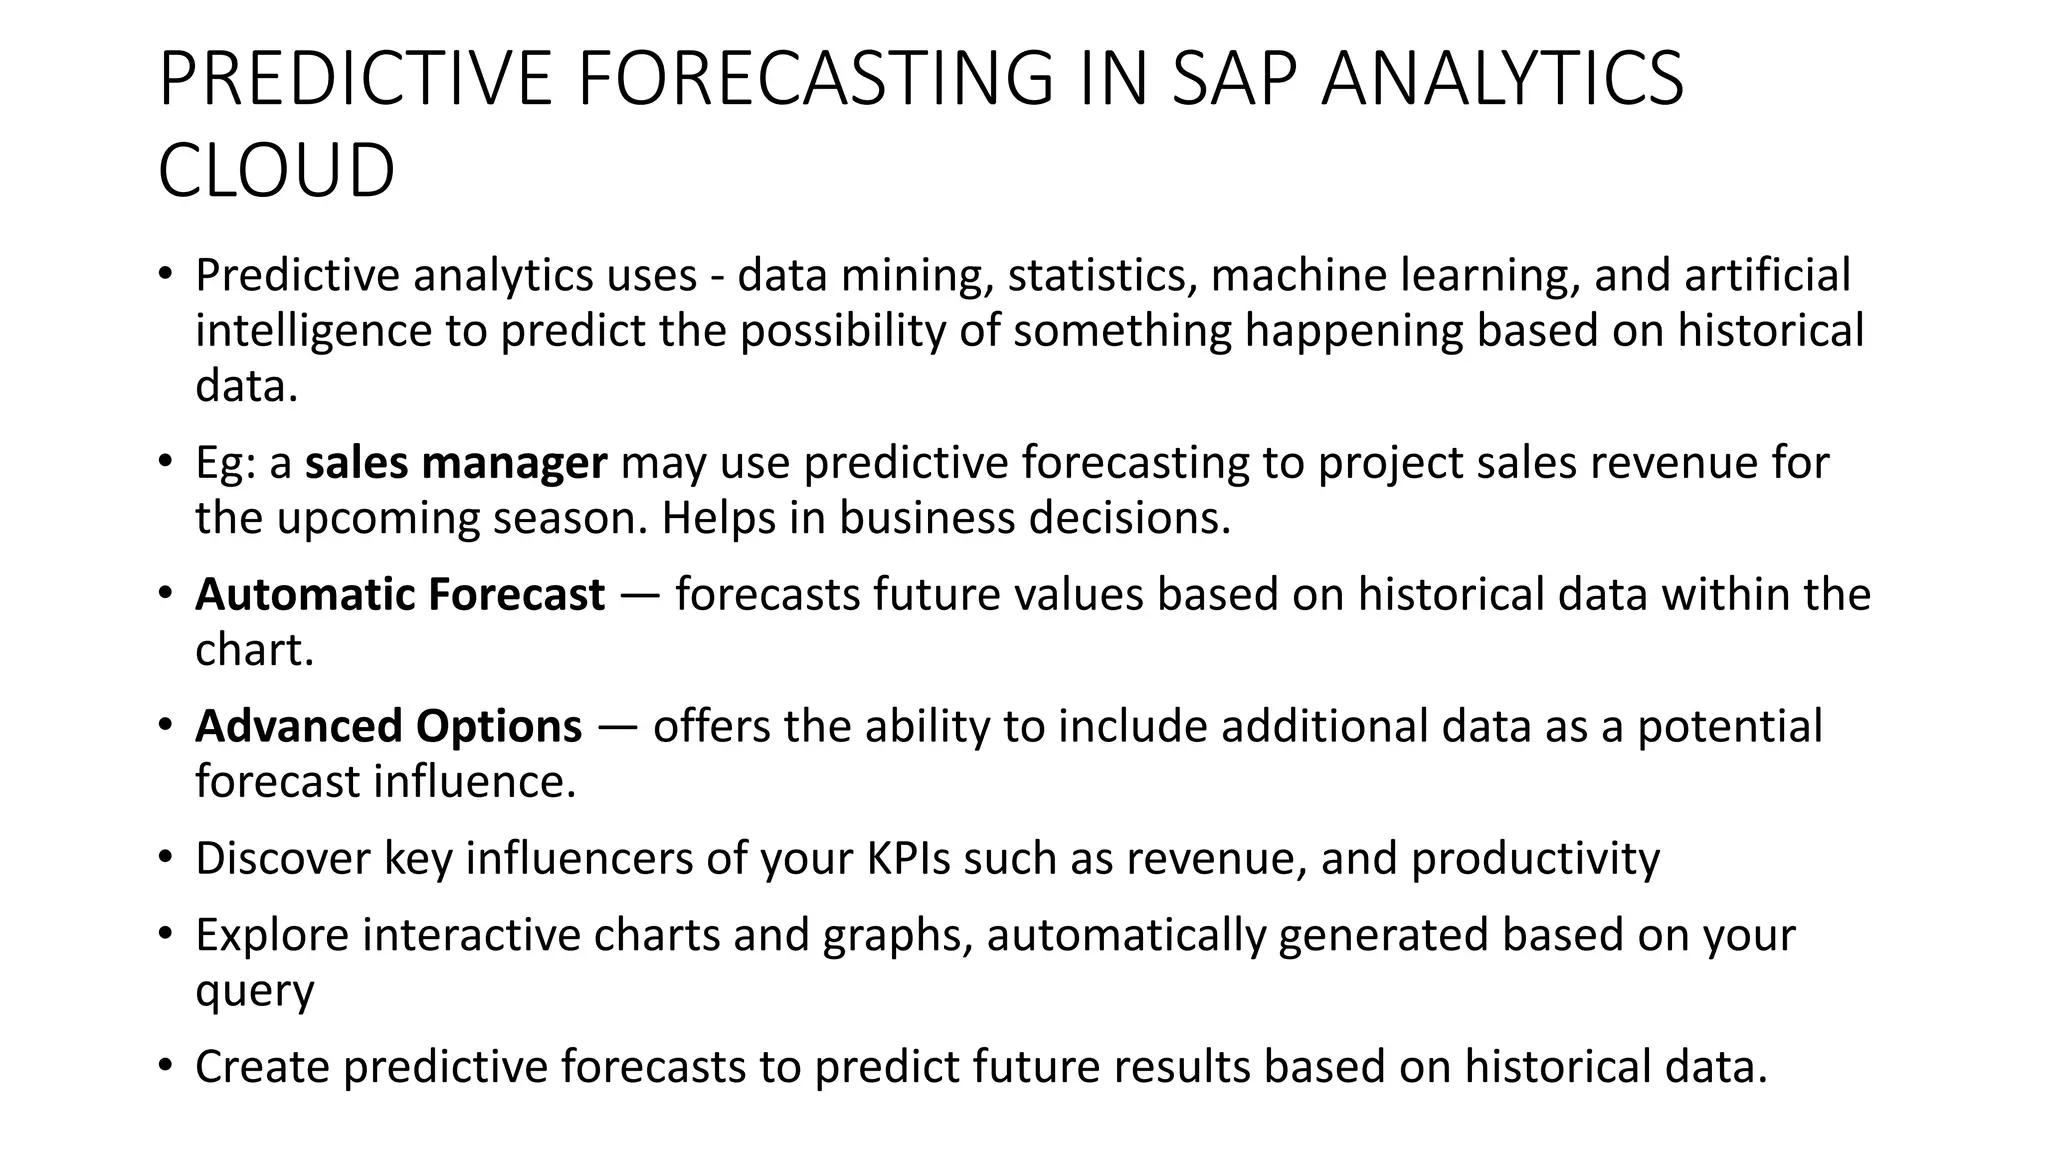
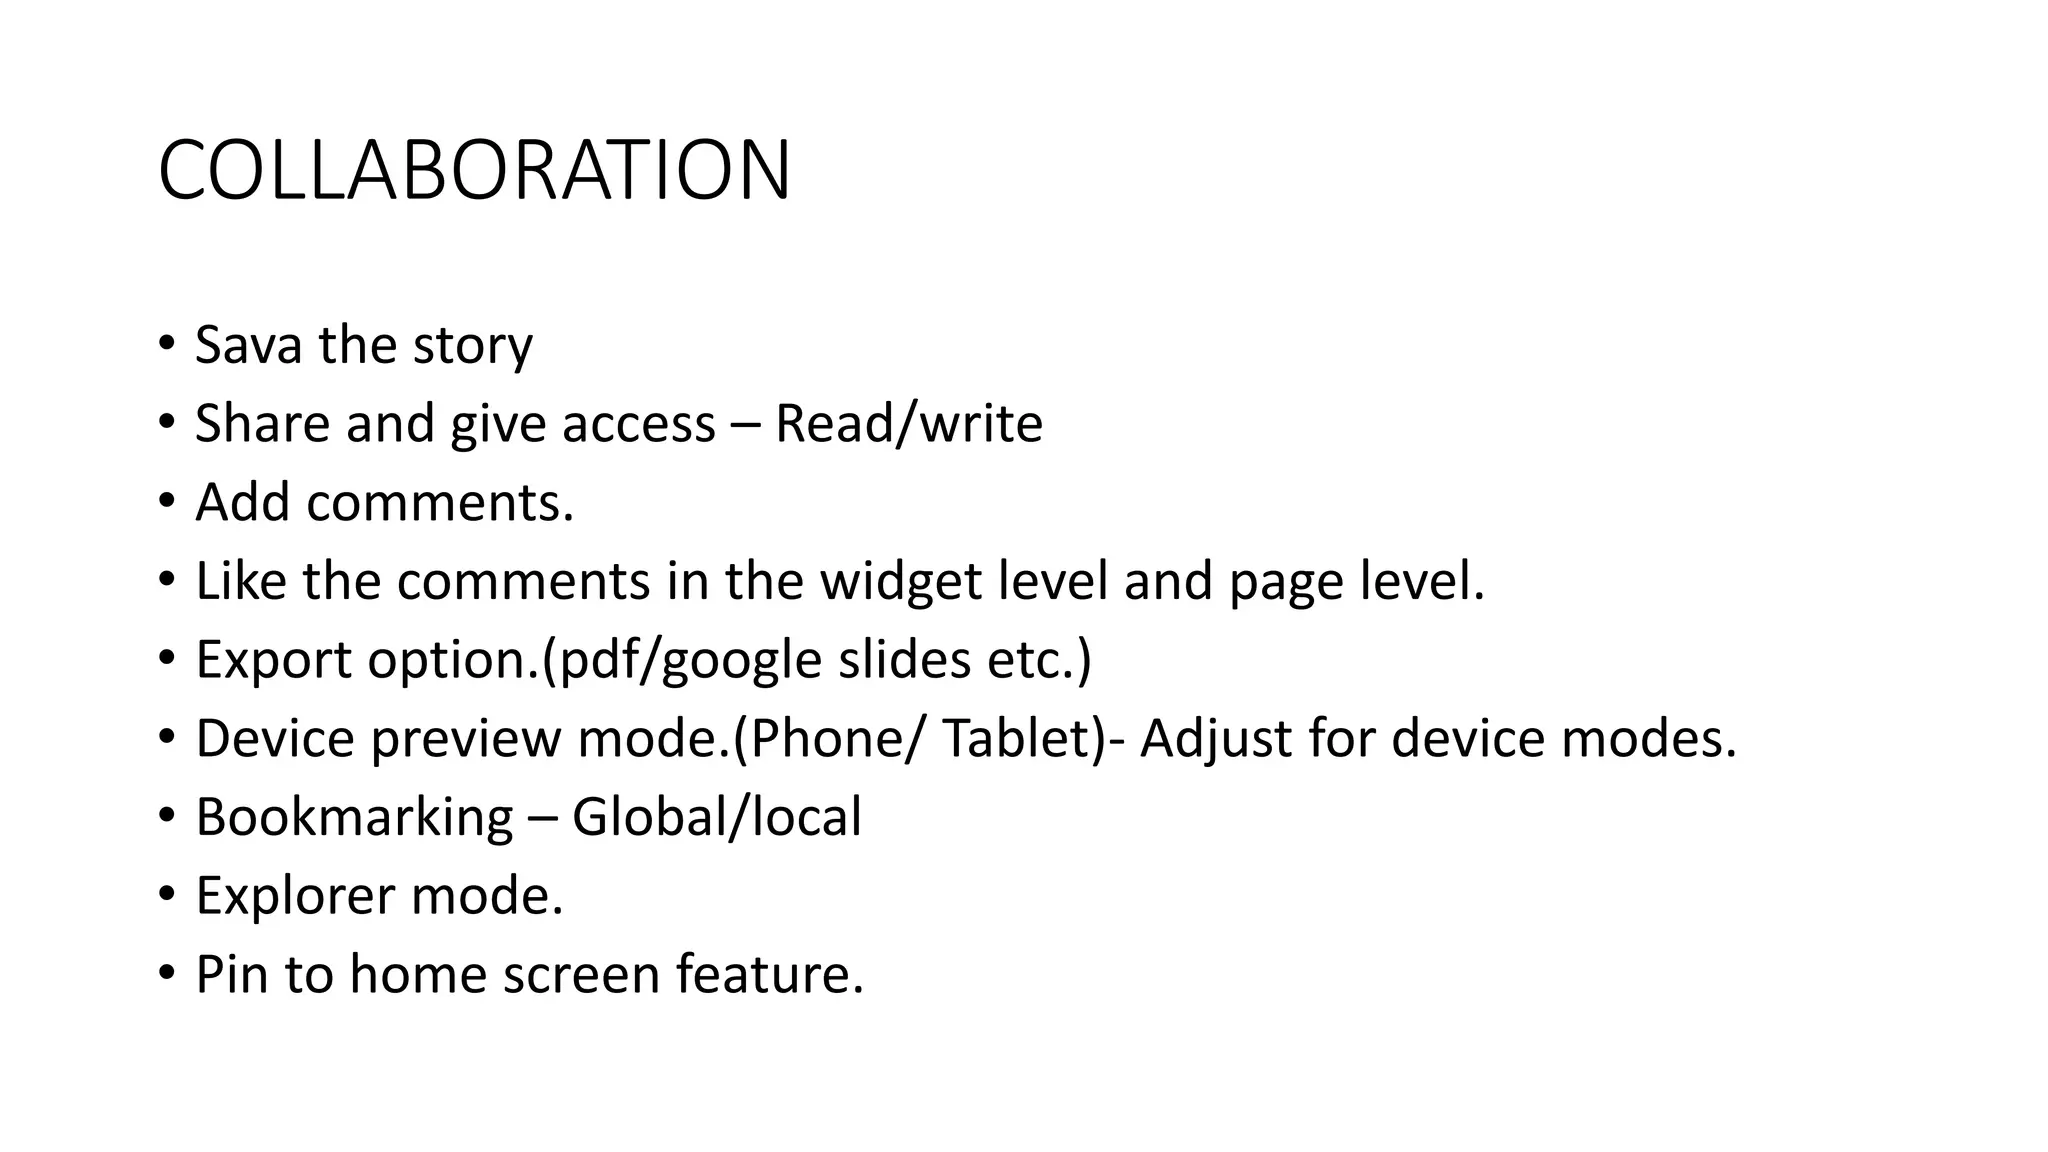
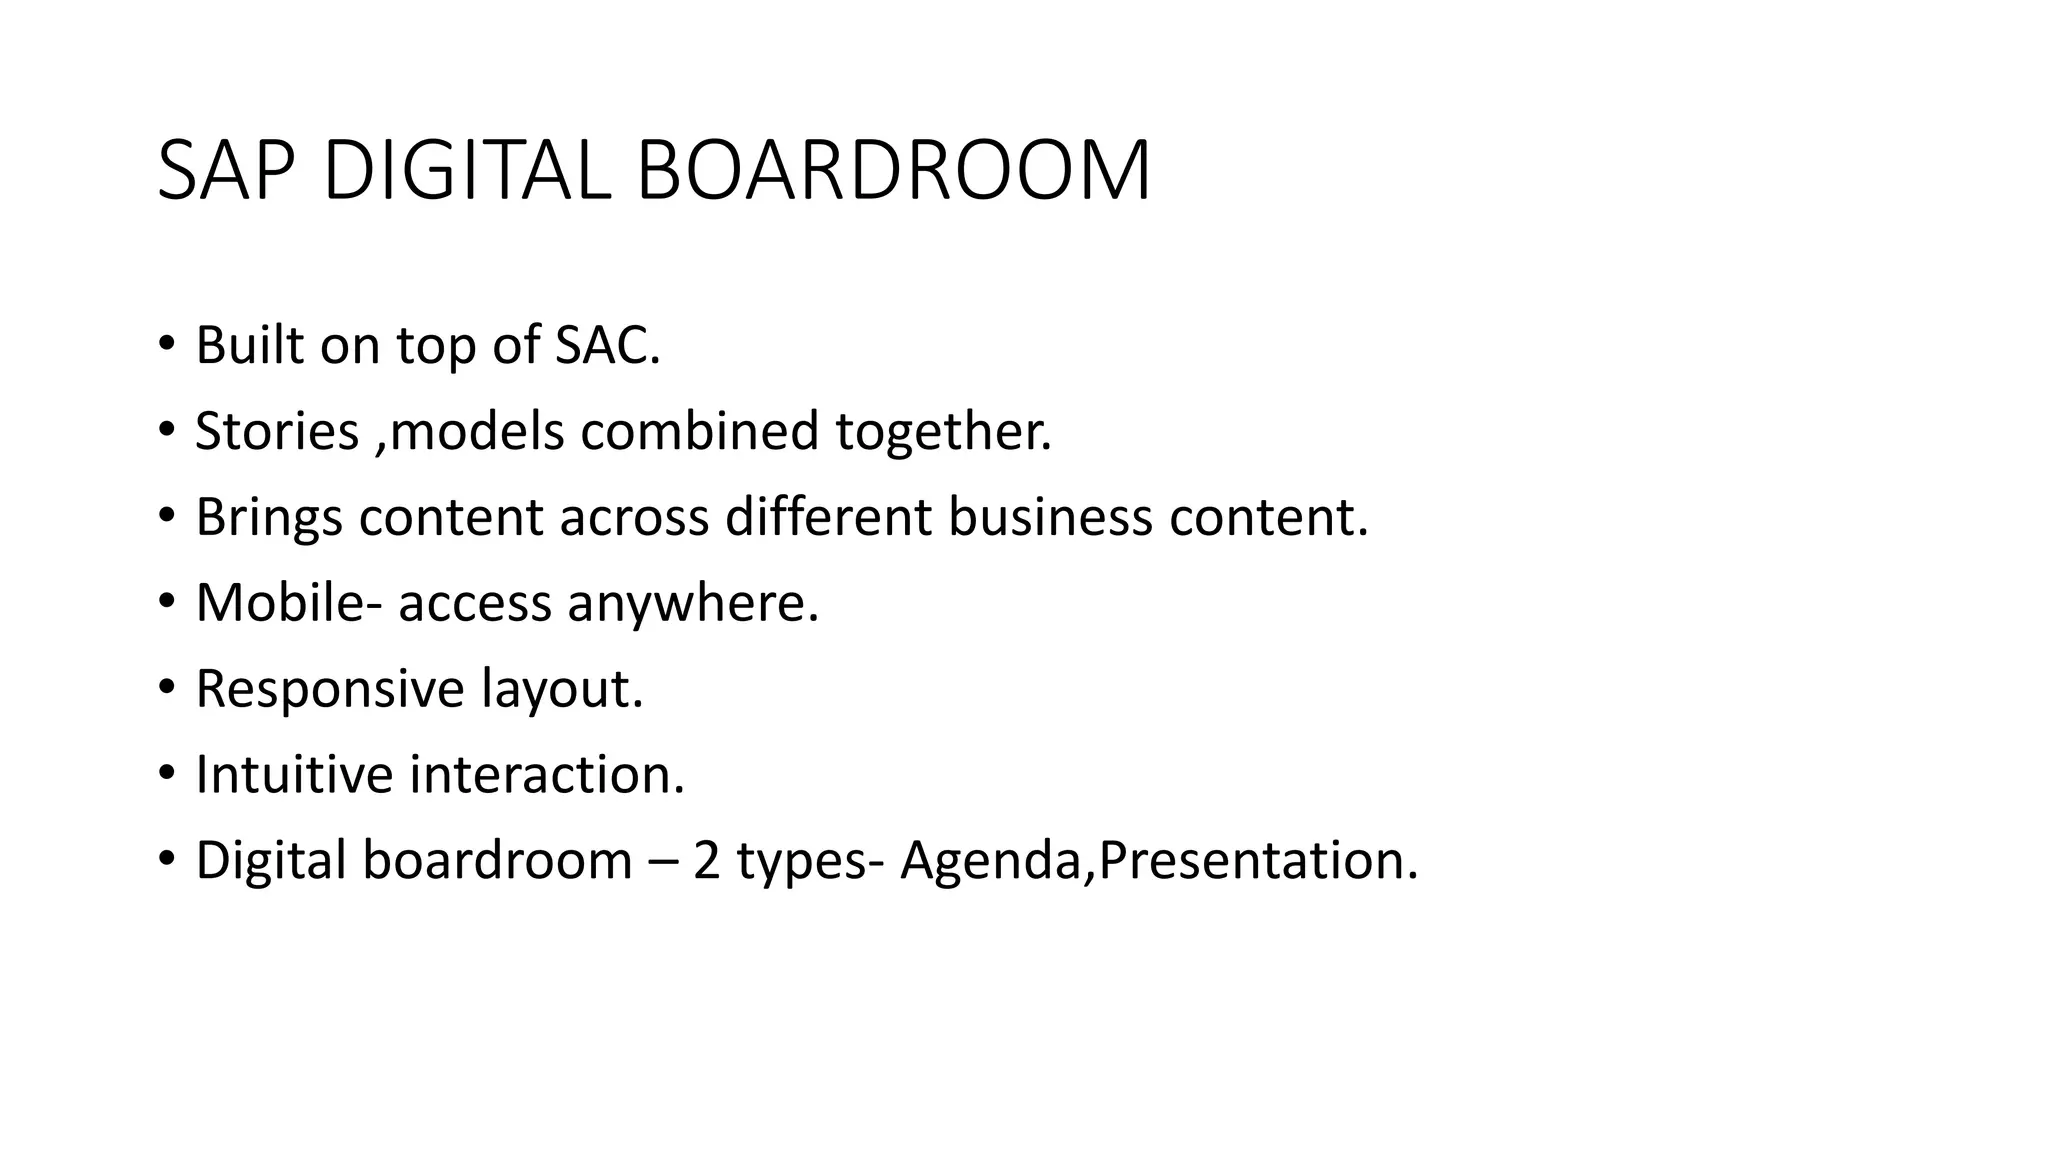
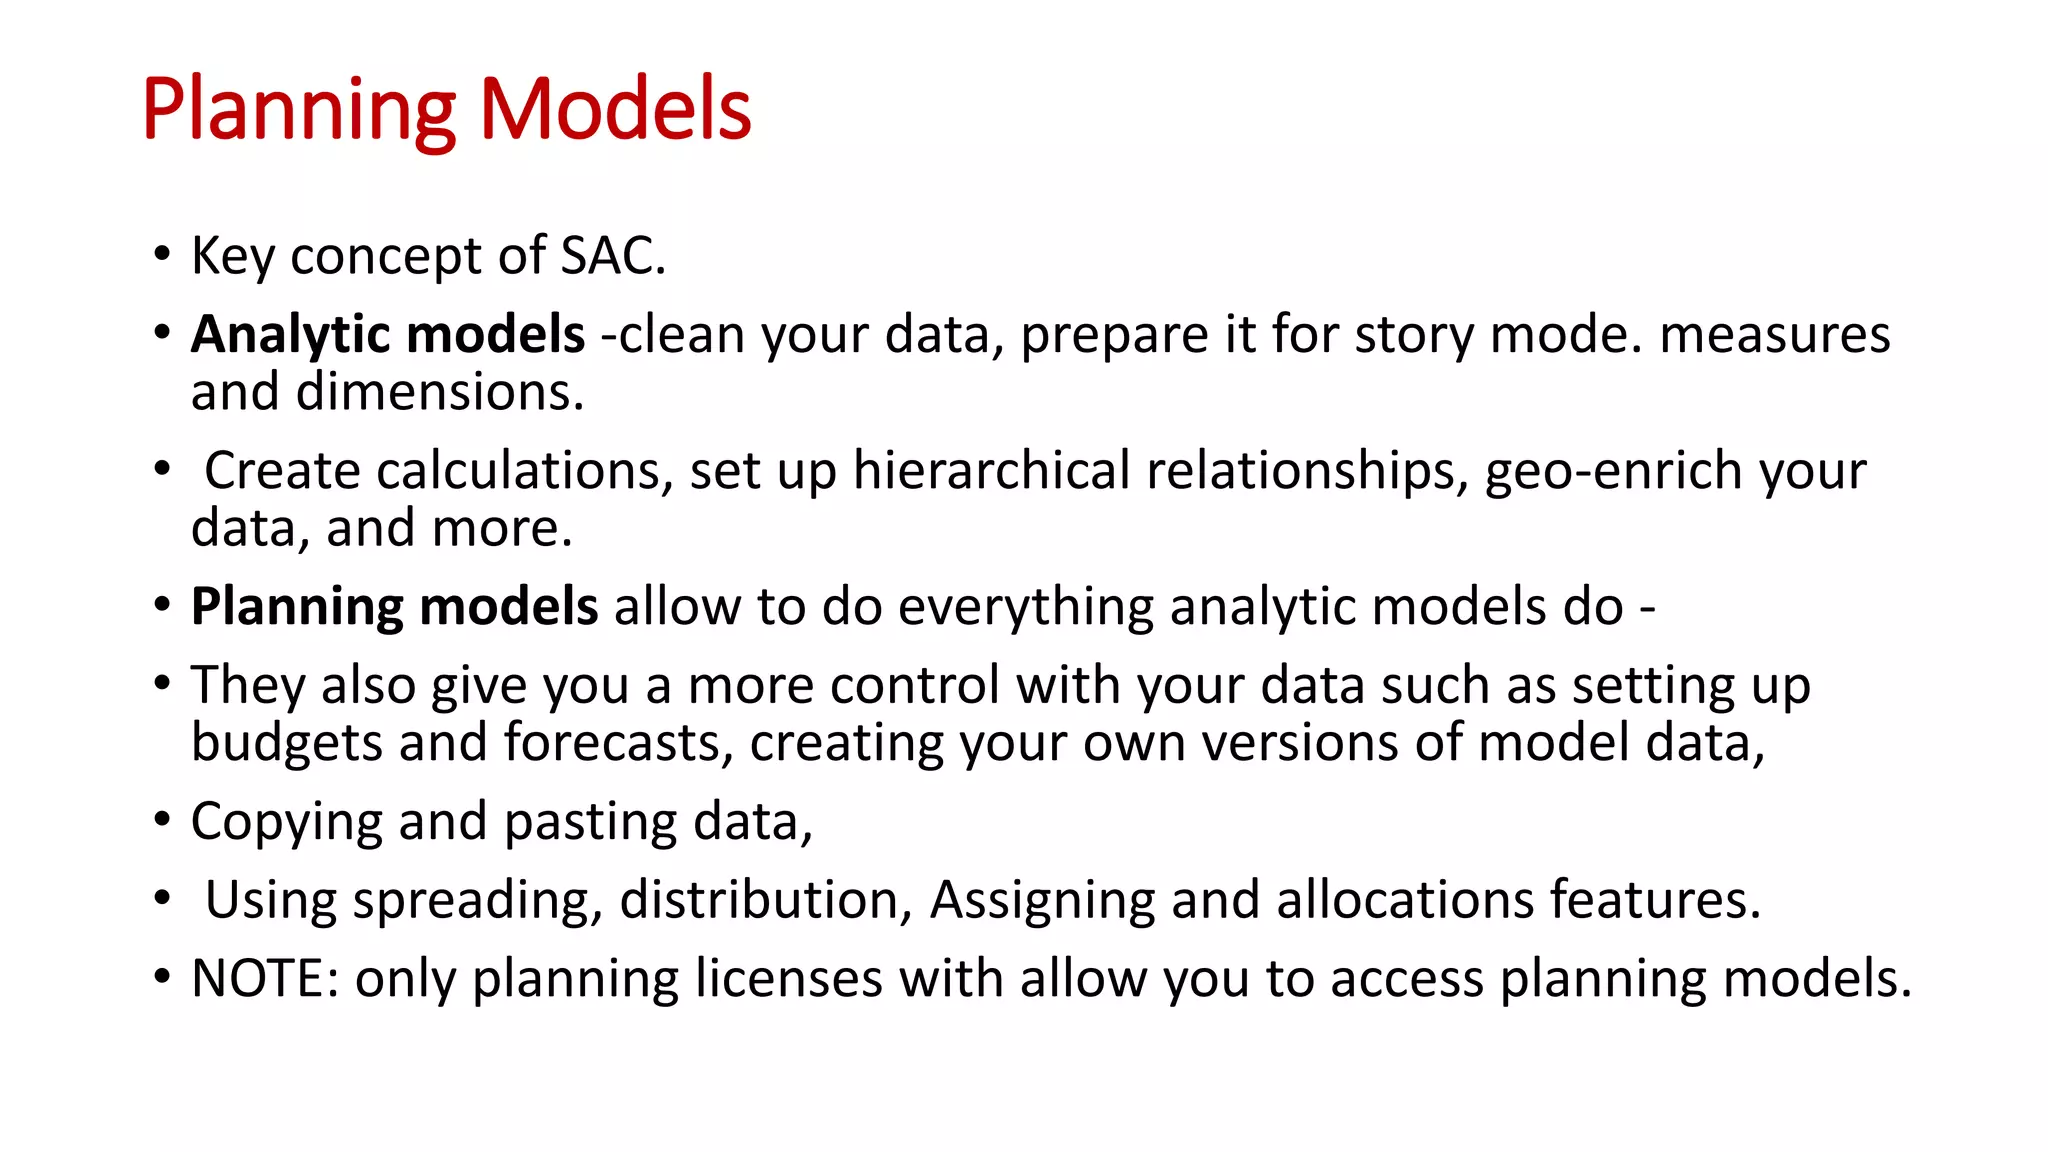
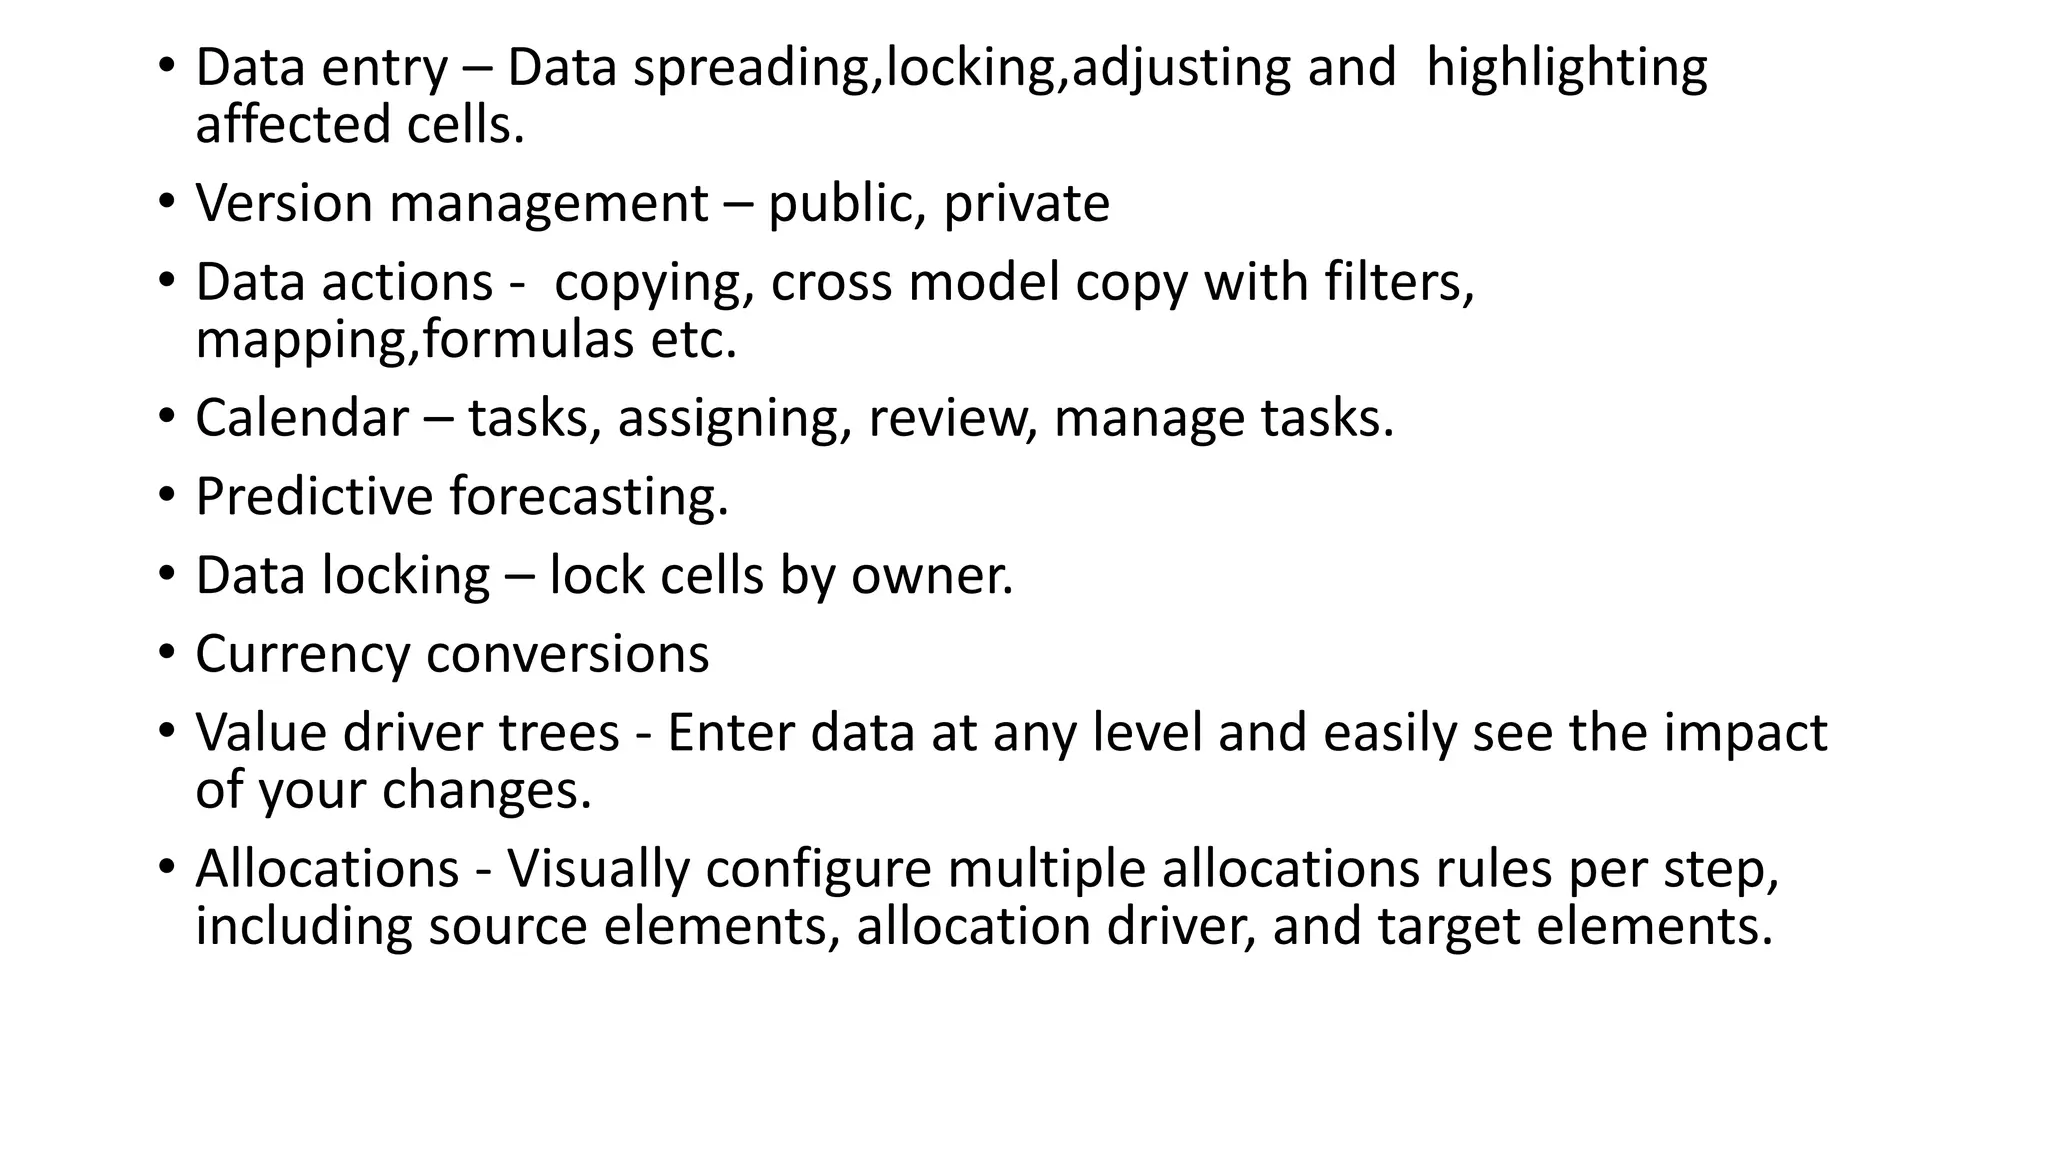
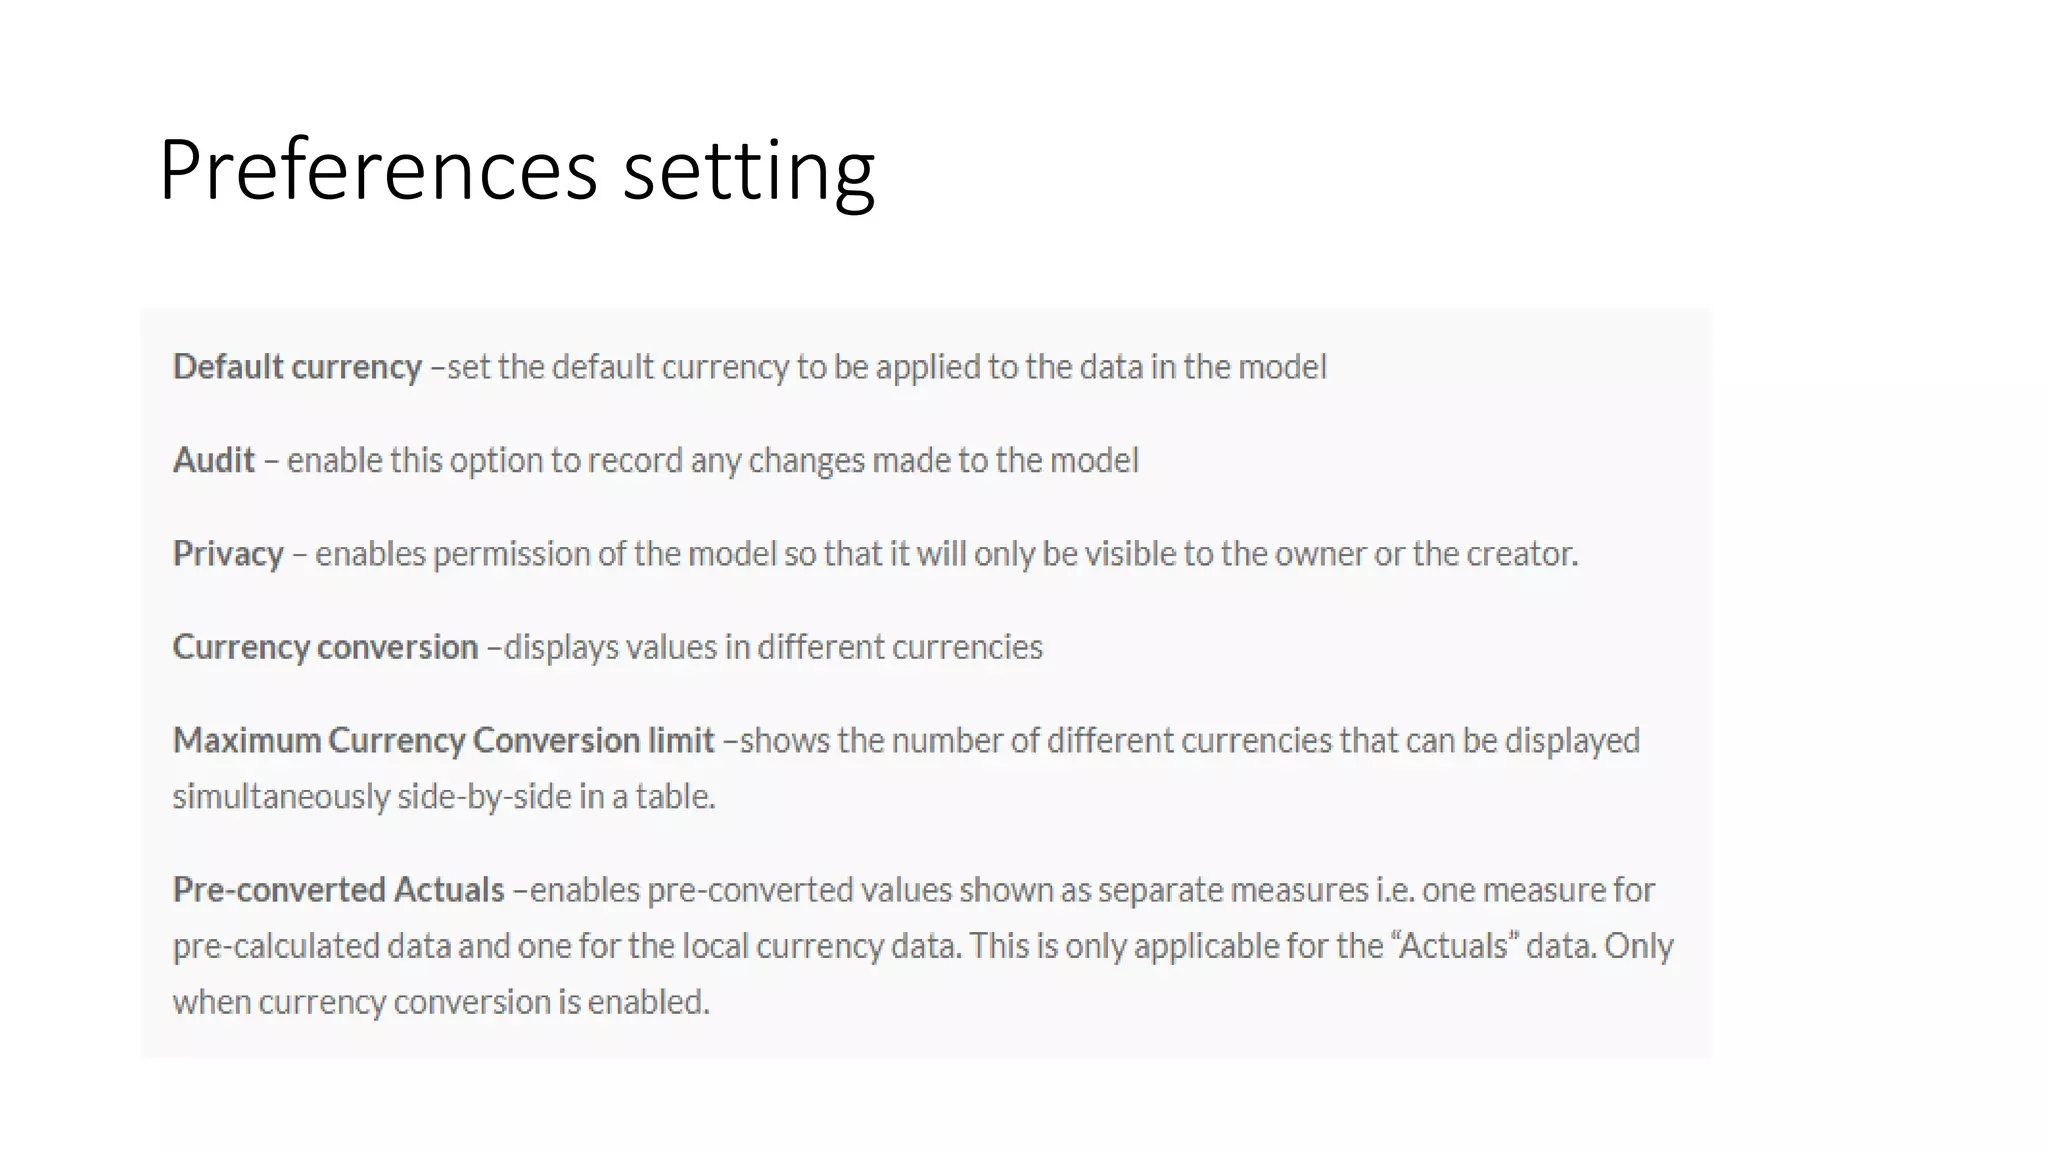
SAP ANALYTICS CLOUD
PLATFORM
WELCOME
SAP ANALYTIC CLOUD PLATFORM -INTRODUCTION
MODELLING IN SAC
CONNECTIVITY
• Import data connectivity
Data is copied to SAC ,not only metadata unlike live connection.
Models can be enhanced.
Schedule the data and refresh.
Eg : SAP BPC,
SAP BW, CONCUR,SQL DB etc
DEMO
• APPLICATION DEMO
• IMPORT DATA - MODEL
• EXPLORE DATA
• CREATING FIRST STORY.
• CALCULATIONS
• LINKED ANALYSIS
• INPUT CONTROLS AND FILTERS
• GEOMAP
• THRESHOLD,VARIANCE,
AUGMENTED ANALYTICS- SMART ASSIST
FEATURES
• Smart assist feature.
• Copy to page/canvas.
• Add smart insights feature to the widgets.- 360 look to data.
• Smart discovery option.(ML,AI)
• Expected and actual value.
• Simulation.
PREDICTIVE FORECASTING IN SAP ANALYTICS
CLOUD
• Predictive analytics uses - data mining, statistics, machine learning, and artificial
intelligence to predict the possibility of something happening based on historical
data.
• Eg: a sales manager may use predictive forecasting to project sales revenue for
the upcoming season. Helps in business decisions.
• Automatic Forecast — forecasts future values based on historical data within the
chart.
• Advanced Options — offers the ability to include additional data as a potential
forecast influence.
• Discover key influencers of your KPIs such as revenue, and productivity
• Explore interactive charts and graphs, automatically generated based on your
query
• Create predictive forecasts to predict future results based on historical data.
COLLABORATION
• Sava the story
• Share and give access – Read/write
• Add comments.
• Like the comments in the widget level and page level.
• Export option.(pdf/google slides etc.)
• Device preview mode.(Phone/ Tablet)- Adjust for device modes.
• Bookmarking – Global/local
• Explorer mode.
• Pin to home screen feature.
SAC SECURITY
• Folder level and story level sharing access control.
• Read, write, full access, update, delete etc options in share control
feature.
• Add users and team options.
• Model Security based on User Roles (Privacy Setting).
• Custom roles can be created.
• Dimension level security.
SAP DIGITAL BOARDROOM
• Built on top of SAC.
• Stories ,models combined together.
• Brings content across different business content.
• Mobile- access anywhere.
• Responsive layout.
• Intuitive interaction.
• Digital boardroom – 2 types- Agenda,Presentation.
• DIGITAL BOARDROOM DEMO
Planning Models
• Key concept of SAC.
• Analytic models -clean your data, prepare it for story mode. measures
and dimensions.
• Create calculations, set up hierarchical relationships, geo-enrich your
data, and more.
• Planning models allow to do everything analytic models do -
• They also give you a more control with your data such as setting up
budgets and forecasts, creating your own versions of model data,
• Copying and pasting data,
• Using spreading, distribution, Assigning and allocations features.
• NOTE: only planning licenses with allow you to access planning models.
• Data entry – Data spreading,locking,adjusting and highlighting
affected cells.
• Version management – public, private
• Data actions - copying, cross model copy with filters,
mapping,formulas etc.
• Calendar – tasks, assigning, review, manage tasks.
• Predictive forecasting.
• Data locking – lock cells by owner.
• Currency conversions
• Value driver trees - Enter data at any level and easily see the impact
of your changes.
• Allocations - Visually configure multiple allocations rules per step,
including source elements, allocation driver, and target elements.
Create model which is planning enabled.
Preferences setting
Dimension settings.
• Other settings are available at the dimension level are:
• Setting the Threshold: sets the Threshold or Apply conditional
formatting on Accounts. This option is only available in the Account
dimension. You can set the conditional formatting on Accounts at the
story level or in the Model itself. By setting the Threshold in the
Model , it would apply the conditional formatting to any stories
where the Dimension or Model is used .
• Add columns and Rows: adds additional columns and rows
• Copy Rows icon: copies the row
• Delete Rows and Columns: deletes rows and columns
• Next step is to add the Master data to the Account dimension.
• Account dimension has many columns. You can either type the members directly
in the grid .
• or you can prepare the master data in the Excel in the same format as Account
dimension and simply copy and paste the members in the dimension grid.
Add data to organizational dimensions also.
Add master data to generic dimension.
Once all the dimensions are created, click on Save icon to create the Model.
We have successfully created a Planning model from scratch with Account, Time, Categories,
Organizational and Generic dimensions in it.
Loading the Transaction Data into Model:
SAP ANALYTIC DESIGNER
Thank You

Sap Analytics Cloud

  • 1.
  • 2.
    SAP ANALYTIC CLOUDPLATFORM -INTRODUCTION
  • 10.
  • 11.
    CONNECTIVITY • Import dataconnectivity Data is copied to SAC ,not only metadata unlike live connection. Models can be enhanced. Schedule the data and refresh. Eg : SAP BPC, SAP BW, CONCUR,SQL DB etc
  • 13.
    DEMO • APPLICATION DEMO •IMPORT DATA - MODEL • EXPLORE DATA • CREATING FIRST STORY. • CALCULATIONS • LINKED ANALYSIS • INPUT CONTROLS AND FILTERS • GEOMAP • THRESHOLD,VARIANCE,
  • 14.
    AUGMENTED ANALYTICS- SMARTASSIST FEATURES • Smart assist feature. • Copy to page/canvas. • Add smart insights feature to the widgets.- 360 look to data. • Smart discovery option.(ML,AI) • Expected and actual value. • Simulation.
  • 15.
    PREDICTIVE FORECASTING INSAP ANALYTICS CLOUD • Predictive analytics uses - data mining, statistics, machine learning, and artificial intelligence to predict the possibility of something happening based on historical data. • Eg: a sales manager may use predictive forecasting to project sales revenue for the upcoming season. Helps in business decisions. • Automatic Forecast — forecasts future values based on historical data within the chart. • Advanced Options — offers the ability to include additional data as a potential forecast influence. • Discover key influencers of your KPIs such as revenue, and productivity • Explore interactive charts and graphs, automatically generated based on your query • Create predictive forecasts to predict future results based on historical data.
  • 16.
    COLLABORATION • Sava thestory • Share and give access – Read/write • Add comments. • Like the comments in the widget level and page level. • Export option.(pdf/google slides etc.) • Device preview mode.(Phone/ Tablet)- Adjust for device modes. • Bookmarking – Global/local • Explorer mode. • Pin to home screen feature.
  • 17.
    SAC SECURITY • Folderlevel and story level sharing access control. • Read, write, full access, update, delete etc options in share control feature. • Add users and team options. • Model Security based on User Roles (Privacy Setting). • Custom roles can be created. • Dimension level security.
  • 18.
    SAP DIGITAL BOARDROOM •Built on top of SAC. • Stories ,models combined together. • Brings content across different business content. • Mobile- access anywhere. • Responsive layout. • Intuitive interaction. • Digital boardroom – 2 types- Agenda,Presentation.
  • 21.
  • 22.
    Planning Models • Keyconcept of SAC. • Analytic models -clean your data, prepare it for story mode. measures and dimensions. • Create calculations, set up hierarchical relationships, geo-enrich your data, and more. • Planning models allow to do everything analytic models do - • They also give you a more control with your data such as setting up budgets and forecasts, creating your own versions of model data, • Copying and pasting data, • Using spreading, distribution, Assigning and allocations features. • NOTE: only planning licenses with allow you to access planning models.
  • 25.
    • Data entry– Data spreading,locking,adjusting and highlighting affected cells. • Version management – public, private • Data actions - copying, cross model copy with filters, mapping,formulas etc. • Calendar – tasks, assigning, review, manage tasks. • Predictive forecasting. • Data locking – lock cells by owner. • Currency conversions • Value driver trees - Enter data at any level and easily see the impact of your changes. • Allocations - Visually configure multiple allocations rules per step, including source elements, allocation driver, and target elements.
  • 27.
    Create model whichis planning enabled.
  • 29.
  • 33.
    Dimension settings. • Othersettings are available at the dimension level are: • Setting the Threshold: sets the Threshold or Apply conditional formatting on Accounts. This option is only available in the Account dimension. You can set the conditional formatting on Accounts at the story level or in the Model itself. By setting the Threshold in the Model , it would apply the conditional formatting to any stories where the Dimension or Model is used . • Add columns and Rows: adds additional columns and rows • Copy Rows icon: copies the row • Delete Rows and Columns: deletes rows and columns
  • 34.
    • Next stepis to add the Master data to the Account dimension. • Account dimension has many columns. You can either type the members directly in the grid . • or you can prepare the master data in the Excel in the same format as Account dimension and simply copy and paste the members in the dimension grid.
  • 36.
    Add data toorganizational dimensions also.
  • 38.
    Add master datato generic dimension. Once all the dimensions are created, click on Save icon to create the Model. We have successfully created a Planning model from scratch with Account, Time, Categories, Organizational and Generic dimensions in it.
  • 39.
    Loading the TransactionData into Model:
  • 43.
  • 47.